Fig. 2
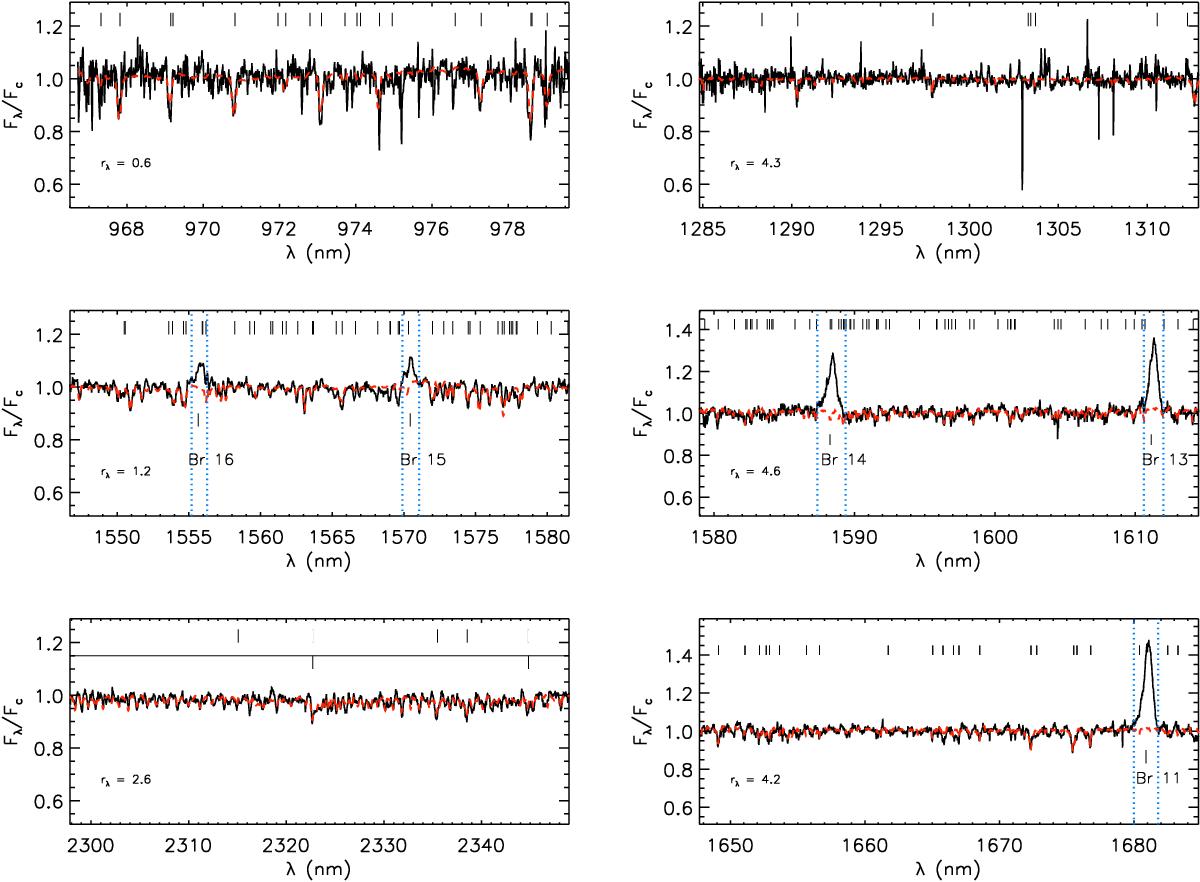
Left: three portions in the YHK bands of the GIANO spectrum of XZ Tau (solid black line) with the rotationally-broadened and veiled spectrum of the M2 template (dashed red line) overplotted in the same wavelength ranges. Absorption features, mainly of the iron-peak group, are indicated with short lines. We refer interested readers to Rayner et al. (2009) and Sharon et al. (2010) for more details about absorption features. In the bottom panel, 12CO and 13CO molecular bands are represented by a horizontal line. Main emission features are marked and excluded from the analysis. Right: the same for DR Tau in three different wavelength regions, with the dashed red line representing the K7 template.
Current usage metrics show cumulative count of Article Views (full-text article views including HTML views, PDF and ePub downloads, according to the available data) and Abstracts Views on Vision4Press platform.
Data correspond to usage on the plateform after 2015. The current usage metrics is available 48-96 hours after online publication and is updated daily on week days.
Initial download of the metrics may take a while.