Free Access
Fig. 9
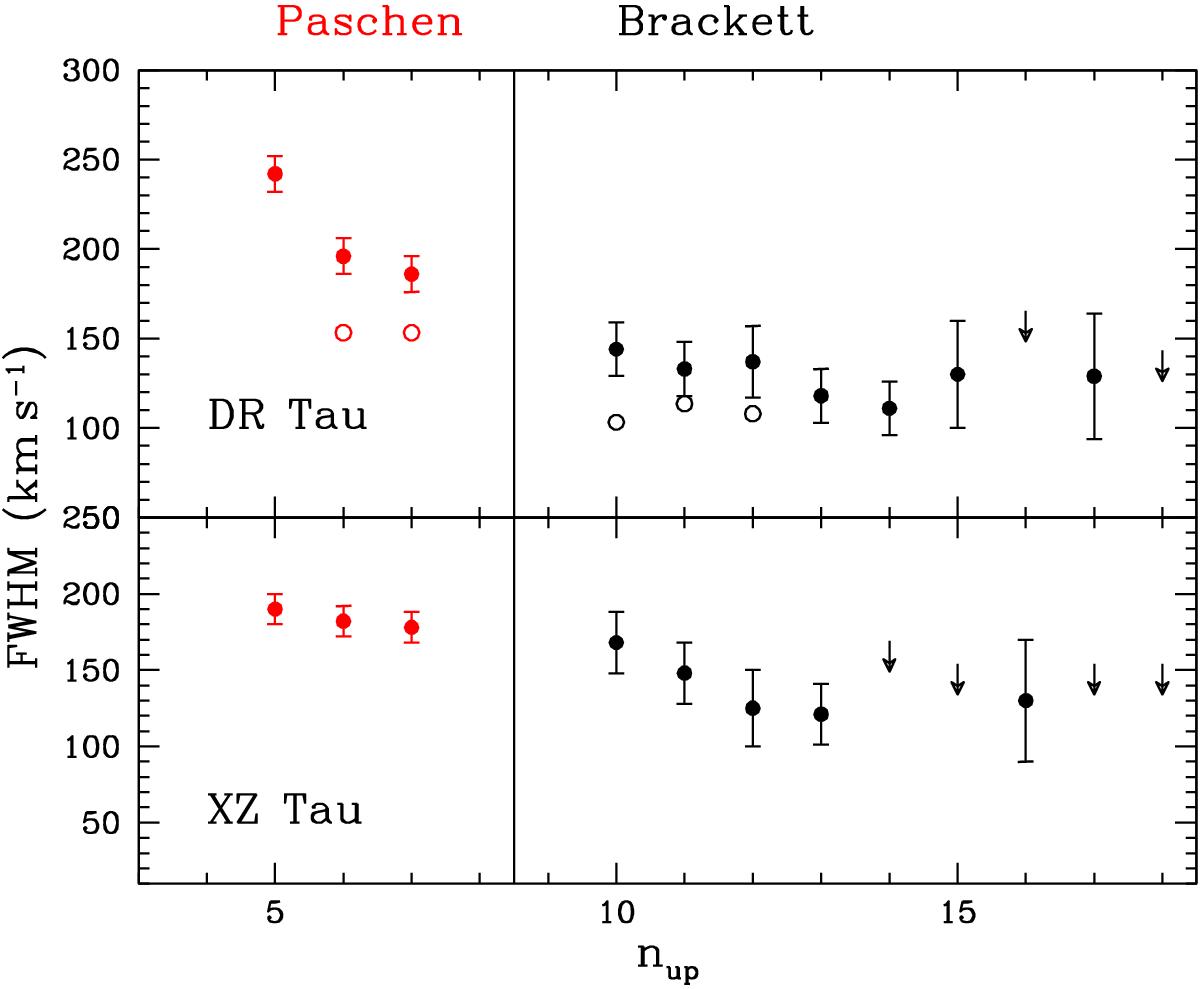
Measured FWHM of H i Paschen and Brackett lines in DR Tau (upper) and XZ Tau (bottom). Upper limits are indicated by arrows. Open dots in the DR Tau plot indicate the width of the main line component once the blue-shifted component has been removed through profile decomposition.
Current usage metrics show cumulative count of Article Views (full-text article views including HTML views, PDF and ePub downloads, according to the available data) and Abstracts Views on Vision4Press platform.
Data correspond to usage on the plateform after 2015. The current usage metrics is available 48-96 hours after online publication and is updated daily on week days.
Initial download of the metrics may take a while.