Fig. 11
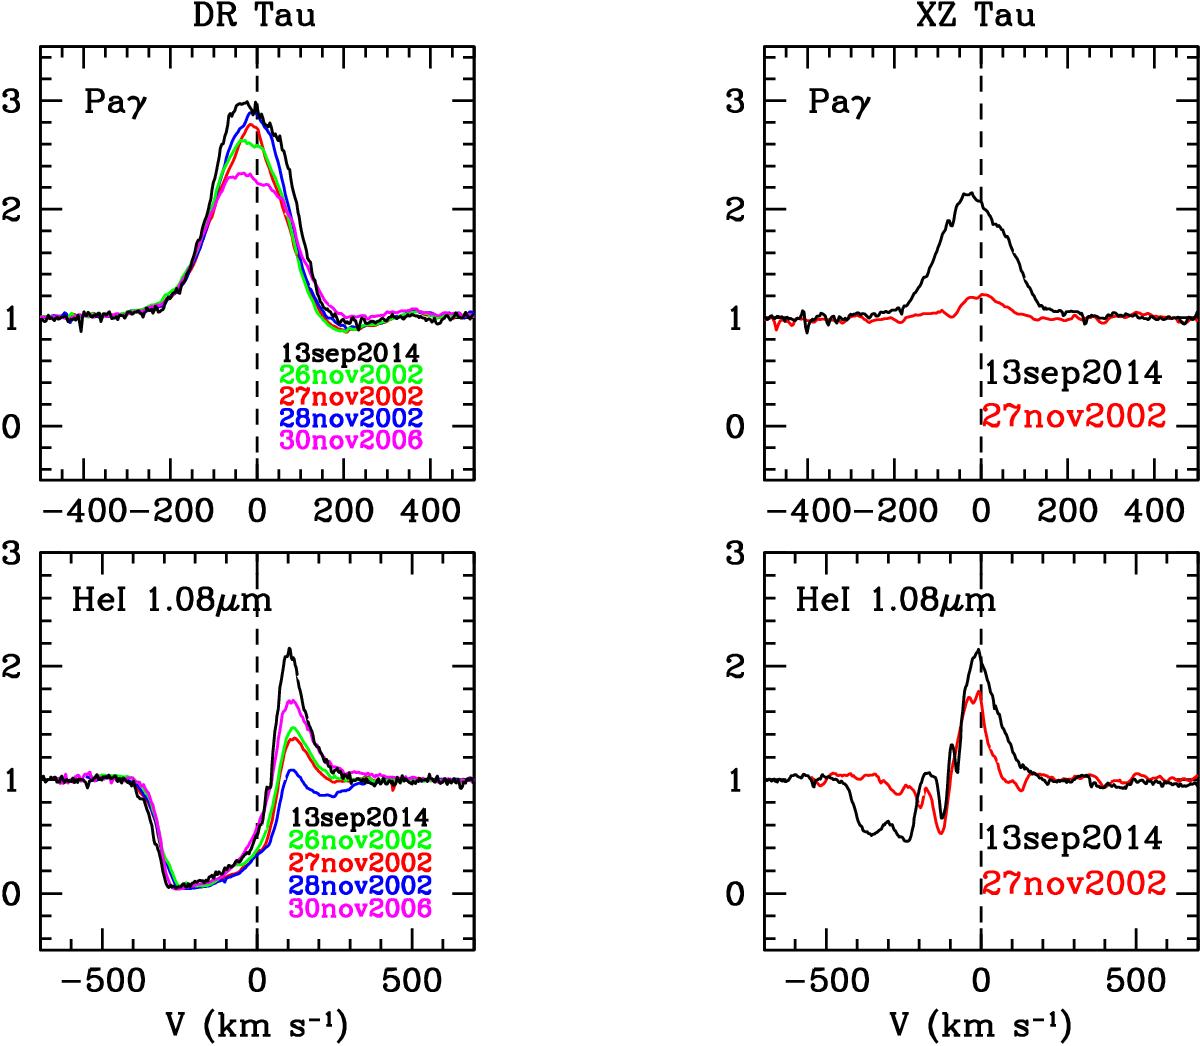
Left: continuum normalised spectra of the He i 1.08 μm (bottom panel) and Paβ (upper panel) line profiles of DR Tau observed in different epochs. Black curves refer to the more recent GIANO spectra presented in this paper, whereas coloured curves are Keck spectra from Edwards et al. (2006) acquired on different dates in 2002 and 2006. Right: same for XZ Tau.
Current usage metrics show cumulative count of Article Views (full-text article views including HTML views, PDF and ePub downloads, according to the available data) and Abstracts Views on Vision4Press platform.
Data correspond to usage on the plateform after 2015. The current usage metrics is available 48-96 hours after online publication and is updated daily on week days.
Initial download of the metrics may take a while.