Free Access
Fig. 13
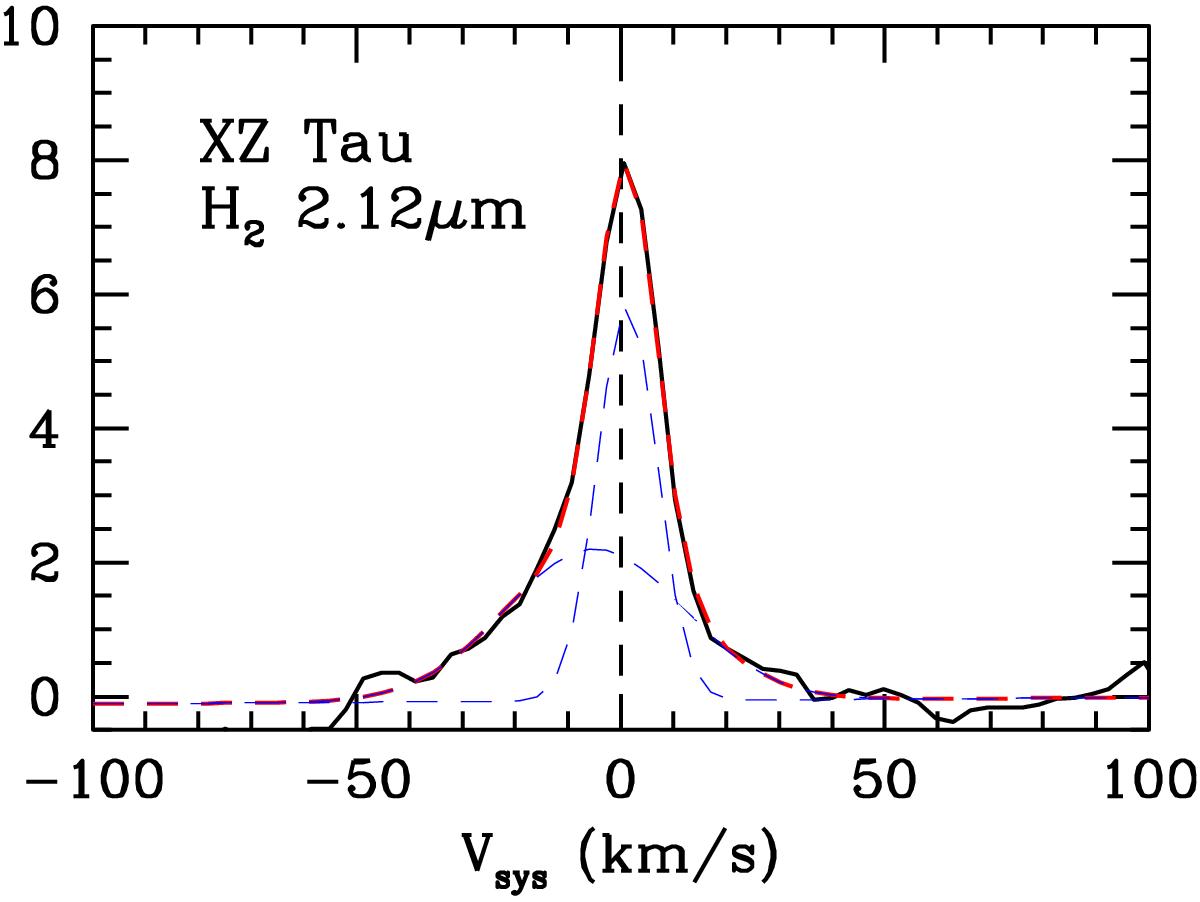
Profile of the H2 2.12 μm line detected in XZ Tau with the fit of the two Gaussian components superimposed. The red-dashed line is the best fit obtained by the sum of the two Gaussian components plotted as blue-dashed lines. Parameters of the two components are given in Table 2.
Current usage metrics show cumulative count of Article Views (full-text article views including HTML views, PDF and ePub downloads, according to the available data) and Abstracts Views on Vision4Press platform.
Data correspond to usage on the plateform after 2015. The current usage metrics is available 48-96 hours after online publication and is updated daily on week days.
Initial download of the metrics may take a while.