[https://doi.org/10.1051/0004-6361:20030622]
[https://doi.org/10.1051/0004-6361:20020127]
[https://doi.org/10.1051/0004-6361/201322953]
[https://doi.org/10.1051/0004-6361:20031606]
[https://doi.org/10.1051/0004-6361:20078184]
[https://doi.org/10.1051/0004-6361/201015020]
[https://doi.org/10.1051/0004-6361:20065427]
| Issue |
A&A
Volume 605, September 2017
|
|
|---|---|---|
| Article Number | C4 | |
| Number of page(s) | 20 | |
| Section | Galactic structure, stellar clusters and populations | |
| DOI | https://doi.org/10.1051/0004-6361/201322953e | |
| Published online | 22 September 2017 | |
Hot horizontal branch stars in NGC 288 – effects of diffusion and stratification on their atmospheric parameters (Corrigendum)
1 European Southern Observatory, Karl-Schwarzschild-Str. 2, 85748 Garching, Germany
e-mail: This email address is being protected from spambots. You need JavaScript enabled to view it.
2 Institut für Theoretische Physik und Astrophysik, Olshausenstraße 40, 24118 Kiel, Germany
3 Georg-August-Universität, Institut für Astrophysik, Friedrich-Hund-Platz 1, 37077 Göttingen, Germany
4 Département de Physique et d’Astronomie, Université de Moncton, Moncton, New Brunswick, E1A 3E9, Canada
5 Département de physique, Université de Montréal, Montréal, Québec, H3C 3J7, Canada
6 NASA Goddard Space Flight Center, Exploration of the Universe Division, Code 667, Greenbelt, MD 20771, USA
7 Stellar Astrophysics Centre, Department of Physics & Astronomy, University of Århus, Ny Munkegade 120, 8000 Århus C, Denmark
Abstract
We found that the script to determine the masses of the stars contains two errors. This script and a related one have been used to determine masses of globular cluster stars and distances to field stars in 12 papers published between 1990 and 2014. While the numerical values need to be revised none of the conclusions are affected. We provide the updated numerical values and figures for all 12 publications here. In addition we describe the effects on those refereed publications that used the distances to the field stars.
Key words: stars: horizontal-branch / stars: atmospheres / stars: AGB and post-AGB / globular clusters: general / errata, addenda
© ESO, 2017
1. Introduction
We discovered that the script used in a number of papers by our group to determine the masses of the horizontal branch (HB) stars contains two errors (see Sect. 2.1 for the corrected values). This script was used also to determine masses of hot stars (mostly HB stars) in globular clusters by Moehler et al. (2011, ω Cen, Sect. 2.2, Moehler & Sweigart (2006, NGC 6388, Sect. 2.4, Moehler et al. (2003, M 3 and M 13, Sect. 2.5, Moehler et al. (2000b, NGC 6752, Sect. 2.7, Moehler et al. (2000a, 47 Tuc and NGC 362, Sect. 2.6, Moehler et al. (1998, UV bright stars, Sect. 2.8, Moehler et al. (1997, NGC 6752, Sect. 2.9, Moehler et al. (1995, M 15, Sect. 2.10, and Moni Bidin et al. (2007, NGC 6752, Sect. 2.3, but not for de Boer et al. (1995, NGC 6397).
A similar script with the same errors was used earlier to determine distances for subdwarf B stars in the field of the Milky Way by Theissen et al. (1993, sdB, Sect. 3.1 and Moehler et al. (1990, sdB, Sect. 3.2. The script was not used for Dreizler et al. (1990).
These distances were then used for other research (see Sect. 4): distances to intermediate- and high-velocity clouds by de Boer et al. (1994a, Sect. 4.1, Centurión et al. (1994, Sect. 4.3, Smoker et al. (2004, 2006, Sect. 4.8, kinematic studies by Colin et al. (1994, Sect. 4.2, de Boer et al. (1997, Sect. 4.4, Geffert (1998, Sect. 4.5, and Altmann et al. (2004, Sect. 4.7, and also to study resolved sdB binaries (Heber et al. 2002, Sect. 4.6).
These scripts were derived from Eq. (1)  (1)which can be translated to
  (2)with
  (3)(assuming a const. mass of M∗ = 0.5·M⊙) or to
 ![Mathematical equation: \begin{equation} \label{eq:mass} \log {\frac{M_\ast}{M_\odot}} = \log g_\ast + 0.4 \cdot [(m-M)_0 -V_\ast+A_V+V_{\rm th}] - C2 , \end{equation}](/articles/aa/full_html/2017/09/aa22953e-13/aa22953e-13-eq6.png) (4)with
(4)with  (5)As Vth in these equations we used the V magnitude tabulated by Kurucz (1992). When first doing so we noticed that the distances derived that way were about 2.5 times larger than the ones obtained using bolometric corrections. The Kurucz flux values are measured per nm, while the flux at V = 0 is given per Å. Assuming that the fluxes were integrated and not averaged across the wavelength interval we added
  to the Vth values to correct this difference in binning, while
  would have been required for a factor of ten.
Once we found that error we used instead the following equations to determine masses and distance together with the bolometric corrections from Flower (1996) (6)which can be rewritten to
 ![Mathematical equation: \begin{equation} \label{eq:mass_bc2} \log {\frac{M_\ast}{M_\odot}} = \log g_\ast + 0.4 \cdot [(m-M)_0-V_\ast+A_V - BC] -4 \cdot \log T_\ast +C3 , \end{equation}](/articles/aa/full_html/2017/09/aa22953e-13/aa22953e-13-eq14.png) (7)with
(7)with  (8)The equation for the distances then becomes
  (9)with
  (10)(again assuming a const. mass of M∗ = 0.5·M⊙)
For stars between 7943 K and 56 728 K (the hottest star in Flower 1996) we fitted a 5th polynomial to the bolometric corrections versus effective temperature. For hotter stars we extrapolated a 4th polynomial fitted for the temperature range 10 000 K ≤ Teff ≤ 56 728 K, which proved to be more robust at the hot end.
As one can see, the terms relating to the surface gravity, visual brightness, distance, or mass are the same in the equations using the theoretical visual magnitude or using bolometric corrections. In Fig. 1 we show the terms −0.4·BC−4·log T∗ + C3 from Eq. (7) and  from Eq. (4) for [M/H] = 0 and log g = 4.5 versus effective temperature (with
  ).
).
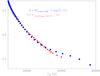 |
Fig. 1 Values of −0.4·BC−4·log T∗ + C3 from Eq. (7) and |
Figure 1 illustrates that the differences are very small, as already seen in the comparison of masses derived both ways in Moni Bidin et al. (2007, their Fig. 7).
In the following sections we will present the revised masses and distances for the stars studied including some revised diagrams and revised tables. The title of each subsection refers to the publication in question.
2. Masses of hot stars in globular clusters
The publications discussed in this section determine effective temperatures, surface gravities, and helium abundances of hot stars in globular clusters and derive their masses from the known apparent brightnesses, reddenings, and distances. Most of them deal with horizontal branch stars, except for Moehler et al. (1998), which analyses UV-bright stars. Moehler et al. (2014, 2003, 2000b) also provide estimates of some metal abundances.
2.1. Moehler et al. (2014, NGC 288)
On average the mass values according to Eq. (6) are (3.2±6.5)% higher than the original ones for homogeneous model atmospheres and (9.4±3.4)% higher for stratified model atmospheres (applying the same offset to the bolometric corrections as we applied to Vth in the original paper). The conclusions are not affected by this change. Figure 2 contains the corrected values for Moehler et al. (2011, Sect 2.2 and Moni Bidin et al. (2007, Sect. 2.3.
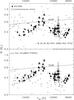 |
Fig. 2 Figure to replace Fig. 6 in Moehler et al. (2014, NGC 288). Masses from line profile fits. For comparison we also show a canonical zero-age horizontal branch from Moehler et al. (2003). In the upper plot we also show results from FORS2 observations of hot HB stars in M 80, NGC 5986 (Moni Bidin et al. 2009), NGC 6752 (Moni Bidin et al. 2007), and M 22 (Salgado et al. 2013). In the lower plot we also provide the results obtained from FLAMES and FORS2 observations of hot horizontal branch stars in ω Cen (Moehler et al. 2011, small squares; Moni Bidin et al. 2011, small triangles). |
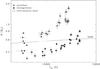 |
Fig. 3 Figure to replace Fig. 11 in Moehler et al. (2014, NGC 288). Masses determined from line profile fits for stars bluer than the Grundahl jump, using homogeneous (filled circles) and stratified (filled triangles) model spectra. |
2.2. Moehler et al. (2011, ω Cen)
See Fig. 4.
The mass values according to Eq. (6) are on average (8.7±2.6)% higher than the original ones for the cool stars in Group1, (6.9±11.1)% lower for the hot stars in Group1, and (3.2±8.0)% lower for the stars in Group2. For the hot stars in Group1 and the stars in Group2 we had used metal-poor theoretical magnitudes in the original paper. The conclusions are not affected.
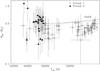 |
Fig. 4 Figure to replace Fig. 7 in Moehler et al. (2011, ω Cen). The effective temperatures and masses derived for our target stars (formal errors multiplied by two, see text [original paper] for details). Helium-poor and helium-rich stars are marked by open squares and filled triangles, respectively. The stars with super-solar helium abundances are shown with the parameters derived from models without C/N enhancement. The lines mark the zero-age horizontal branch for Y = 0.23 (solid) and 0.38 (dashed, see text [original paper] for details). |
2.3. Moni Bidin et al. (2007, NGC 6752)
On average the mass values according to Eq. (6) are (11.3±2.7)% higher than the original ones for effective temperatures between 11 000 K and 18 000 K and (2.8±2.2)% lower for lower and higher effective temperatures. This effect is discussed already in the original paper and its conclusions are not affected.
Table to replace Table 1 in Moni Bidin et al. (2007, NGC 6752). Atmospheric parameters and derived masses for target stars.
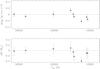 |
Fig. 5 Figure to replace Fig. 6 in Moni Bidin et al. (2007, NGC 6752). Differences of surface gravities and derived masses between this work and Moehler et al. (2000b) for the nine stars in common. The errors are the quadratic sum of the ones for each set of data. The difference is in the sense (our) – (M00). |
Figure 7 of Moni Bidin et al. (2007) shows the mass values according to Eq. (4) in its upper panel and the mass values according to Eq. (6) in its lower panel. Therefore we do not provide an updated version of this figure here.
2.4. Moehler et al. (2006, NGC 6388)
See Fig. 6.
On average the mass values according to Eq. (6) are (4.1±5.9)% higher than the original ones. The conclusions are not affected by this change.
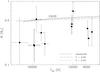 |
Fig. 6 Figure to replace Fig, 6 in Moehler & Sweigart (2006, NGC 6388). Effective temperatures and masses for our target stars. For comparison we show both the canonical ZAHB (Y = 0.23, solid line) and two helium-rich ZAHBs (Y = 0.33, long dashed line; Y = 0.43, short dashed line). |
2.5. Moehler et al. (2003, M 3 and M 13)
See Fig. 7.
On average the mass values according to Eq. (6) are (3.1±0.9)% lower than the original ones for stars cooler than 12 000 K and (9.3±3.6)% higher for the hotter stars. The conclusions are not affected by this change.
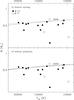 |
Fig. 7 Figure to replace Fig. 9 in Moehler et al. (2003, M 3 and M 13). Temperatures and masses of the programme stars in M 3 and M 13 (from metal-rich model atmospheres for stars hotter than 12 000 K and metal-poor model atmospheres for cooler stars; in both cases metal lines were included in the theoretical spectra) compared to evolutionary tracks. a) The solid line marks the canonical ZAHB and the mixed ZAHB is given by the short-dashed line (see Sect. 6.1 [of the original paper] for details). b) Again the solid line marks the canonical ZAHB and the polluted ZAHBs are given by the dotted (Y = 0.28) and long-dashed line (Y = 0.33), respectively (see Sect. 6.2 [of the original paper] for details). |
2.6. Moehler et al. (2000a, 47 Tuc and NGC 362)
See Table 2.
On average the mass values according to Eq. (6) are (0.2±7.6)% lower than the original ones. The new masses
of the probable SMC members MJ65 (9.2 M⊙), MJ94 (7.4 M⊙), and MJ5381 (5.7 M⊙) are now slightly closer to their evolutionary masses of 7 M⊙, 4 M⊙, and 5 M⊙, respectively. The conclusions are not affected by these changes.
Table to replace Table 2 in Moehler et al. (2000a, 47 Tuc and NGC 362). Atmospheric parameters and masses for the programme stars as derived from low and medium resolution spectroscopic data. The surface gravities derived from the low resolution spectrophotometric data are rather uncertain. We also give the reduced χ2 values from the line profile fits and the errors listed below are the rms errors of the fit routine adjusted as described in the text [original paper]. The three rightmost columns give the cluster resp. SMC membership according to the radial velocity, proper motion, and derived mass of the star (see Sect. 5 [of the original paper] for details). A – means that the information places a star neither to the globular cluster nor to the SMC. Brackets note dubious assignments.
2.7. Moehler et al. (2000b, NGC 6752)
We summarise the average ratios between mass values derived using Eqs. (6) and (4), respectively, in Table 3. The different ratios found for different model atmosphere metallicities reflect also the fact that we used theoretical Vth magnitudes of the same metallicity as the model atmospheres, while the bolometric corrections are not distinguished by metallicity.
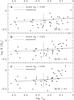 |
Fig. 8 Figure to replace Fig. 7a–c in Moehler et al. (2000b, NGC 6752). Temperatures and masses (derived from Buonanno et al.’s photometry) of the programme stars in NGC 6752. a) Determined using model atmospheres with cluster metallicity ([M/H] = −1.5), b) adopting a solar metallicity ([M/H] = 0) for the model atmospheres, c) adopting a super–solar metallicity ([M/H] = +0.5) for the model atmospheres. For more details see Sect. 4.1 [of the original paper]. The dashed resp. solid lines mark the ZAHB masses for a metallicity [M/H] = −1.54, as computed with and without mixing, respectively. (see Sect. 4.2 and Fig. 4 [of the original paper] for details). |
Table to replace Table 2 in Moehler et al. (2000b, NGC 6752). Physical parameters, helium abundances, and masses for the target stars in NGC 6752 as derived using metal-poor model atmospheres. We used the photometry of Buonanno et al. (1986) to derive the masses.
Table to replace Table 3 in Moehler et al. (2000b, NGC 6752). Physical parameters, helium abundances, and masses for the target stars in NGC 6752 as derived using solar metallicity model atmospheres.
Table to replace Table 5 in Moehler et al. (2000b, NGC 6752). Physical parameters, helium abundances, and masses for the target stars in NGC 6752 as derived using metal-rich model atmospheres.
Table to replace Table 6 in Moehler et al. (2000b, NGC 6752) Mean mass ratios between spectroscopically derived masses and predicted zero-age HB masses at the same effective temperatures. B 2697, B 3006 and stars cooler than 11 500 K are excluded from this comparison. ηR gives the Reimer’s mass loss parameter for the respective ZAHB. We derived the masses using the photometry of Buonanno et al. (1986). The cited errors are standard deviations.
2.8. Moehler et al. (1998, UV bright stars in globular clusters)
See Table 8.
On average the mass values according to Eq. (6) are (5.2±8.0)% lower than the original ones for stars cooler than
25 000 K and (15.1±3.2)% higher for the hotter stars. The surface gravity required to obtain a mass of 0.55 M⊙ for Y453 changed from 5.65 to 5.63 (Sect. 6.2 [of the original paper]). The conclusions are not affected by these changes.
Table to replace Table 2 in Moehler et al. (1998, UV bright stars). List of observed stars and their atmospheric parameters. The metallicities and radial velocities for the clusters are taken from the May 1997 tabulation of Harris (1996).
2.9. Moehler et al. (1997, NGC 6752)
On average the mass values according to Eq. (6) are (5.1±5.2)% lower than the original ones for stars cooler than 35 000 K and (17.4±5.3)% higher for the two hotter stars. We repeat the description of the determination of the average logarithmic mass below with the new values (Sect. 5 of the original paper):
“To determine the mean mass of the sdBs (this paper and Heber et al. (1986)) we took all stars with Teff> 20 000 K, excluding B 617 (due to the strange offset between temperatures from continuum and from line profiles) and the post-EHB stars B 852, B 1754, B 4380, resulting in a total of 16 stars. We then calculated the weighted mean of the logarithmic masses for these stars (the weights being derived from the inverse errors). The mean logarithmic mass for these stars then is −0.330 (=0.467 M⊙). The logarithmic standard deviation is 0.043 dex and the expected mean logarithmic error as derived from the observational errors is 0.054 dex. The mean mass therefore agrees extremely well with the value of 0.488 M⊙ predicted by canonical HB theory for these stars (Dorman et al. 1993) and the standard deviation is less than expected. If we omit the stars observed in 1992 (due to their higher errors) we get a mean logarithmic mass for the remaining 12 stars of −0.356 (=0.44 M⊙), which is somewhat lower than the result above but still in good agreement with theoretical predictions. There is no significant difference between the mean mass for the eleven stars below the gap (⟨ log M ⟩ = −0.333; ⟨ M ⟩ = 0.463 M⊙) and the five stars inside the gap region (⟨ log M ⟩ = −0.324; ⟨ M ⟩ = 0.474 M⊙); again pointing towards their nature being identical. The five stars above the gap (V< , Teff< 20 000 K) have a mean logarithmic mass of −0.523 (=0.299 M⊙) with a logarithmic standard deviation of 0.059 (compared to an expected error of 0.073). Canonical theory would predict for these stars a mean logarithmic mass of −0.256 (=0.554 M⊙) with a scatter of 0.018 dex.”
The conclusions are not affected by these changes.
The data for other clusters shown in Fig. 10 are the corrected ones from Sect. 2.10.
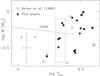 |
Fig. 9 Figure to replace Fig. 9 in Moehler et al. (1997, NGC 6752). The resulting logarithmic masses listed in Table 3 [original paper, Table 9 here] vs. log Teff. The objects that were not used to derive the mean sdB mass (B 617, B 852, B 1754, B 4380) are marked by circles. Also plotted is the Zero Age HB for [Fe/H] = −1.48 of Dorman et al. (1993). The long dashed line marks the gap region seen in the CMD by Buonanno et al. (1986). |
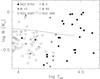 |
Fig. 10 Figure to replace Fig. 10 in Moehler et al. (1997, NGC 6752). The resulting masses plotted in Fig. 9 [original paper, Fig. 9 here] compared to masses of BHB stars in other clusters. The BHB data are taken from Paper I (Moehler et al. 1995, M 15), II (de Boer et al. 1995, NGC 6397), and Crocker et al. (1988, M 5, M 92, and NGC 288) |
Table to replace Table 3 in Moehler et al. (1997, NGC 6752). Physical parameters of the observed stars. The star numbers and V, B−V data are taken from Buonanno et al. (1986), except for 3-118, whose data were obtained from Caloi et al. (1986).
Table to replace Table 2 in Moehler et al. (1995, M 15). Results in M 15. The numbers of the stars refer to Buonanno et al. (1983) and Battistini et al. (1985).
2.10. Moehler et al. (1995, M 15)
See Figs. 11, 12, and Table 10.
The mass values according to Eq. (6) are on average (12±11)%, (7.7±4.6)%, (8.4±4.3)%, (3.9±3.7)% lower than the original ones for cases a,b,c, and d in Table 10, respectively. The average mass of the three stars above the gap from the “compromise” method changes from (0.80±0.40) M⊙ to (0.79±0.46) M⊙. All masses shown in Fig. 12 were rederived using the bolometric correction where necessary, that is, for all references except de Boer et al. (1994b).
The average ratio of the derived mass for a given temperature to the theoretically predicted mass on the ZAHB changes from 0.79 to 0.74, which in turn increases the corresponding photometric error from  to
to  . The conclusions are unaffected by these changes.
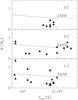 |
Fig. 11 Figure to replace Fig. 8 in Moehler et al. (1995, M15) The resulting masses for the stars inM15, plotted against Teff. The solid line represents a ZAHB model taken from Dorman et al. (1991) for [Fe/H] = −2.26 (YMS = 0.246, and [O/Fe] = 0.75). The short dashed line represents an extension of the ZAHB towards higher temperatures taken from Sweigart (1987) for YMS0.20 and ZMS = 104. a) Teff only from low resolution spectra b) parameters only from Balmer lines (the masses for B 348 (1.45 M⊙) and B 440 (3.08 M⊙) are left out, because they would corrupt the comparability of the plots) c) parameters from combination of continuum (resp. Q index) and Balmer lines. The marked stars are B 208, B 325, and B 276, for which the masses should be treated with great caution (see text [original paper]). |
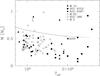 |
Fig. 12 Figure to replace Fig. 10 in Moehler et al. (1995, M 15). The resulting masses for the stars in M 15 (Table 2c and d [original paper, Table 10 here]), NGC 6752 (Moehler et al. 1994), M 5, M 92, NGC 288 (Crocker et al. 1988), and NGC 6397 (de Boer et al. 1994b) plotted against Teff. The solid line represents a ZAHB model taken from Dorman et al. (1991) for [Fe/H] = −2.26 (YMS = 0.246, and [O/Fe] = 0.75). The short dashed line represents an extension of the ZAHB towards higher temperatures taken from Sweigart (1987) for YMS = 0.20 and ZMS = 10-4. |
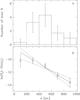 |
Fig. 13 Figure to replace Fig. 6a and b in Theissen et al. (1993). a) Average distribution of the statistically complete sample perpendicular to the galactic plane, created by 10 000 Monte Carlo simulations. b) Regression of lnNi−2lnzi to determine the scale height which follows from the negative inverse of the slope. Ni denotes the number of stars in bin i, zi the distance. The full drawn line is the least square fit, weighted with the inverse errors; the dashed lines are extreme fits giving the errors in scale height. |
3. Distances to hot stars in the field
The publications discussed in this section determine effective temperatures and surface gravities of hot subdwarf stars in the field of the Milky Way and derive their distances from the known apparent brightnesses, reddenings, and an assumed mass of 0.5 M⊙.
3.1. Theissen et al. (1993)
See Fig. 13 and Tables 11 and 12.
For PG 1701+359 we get a much smaller distance with Eq. (6) than the one listed in Theissen et al. (1993). We think that the original distance is the erroneous one as the theoretical magnitude derived from it differs by from the one corresponding to its atmospheric parameters. Excluding this object the distance values according to Eq. (9) are on average (3.8±6.2)% larger than the original ones. With the new distances we derive a slightly lower scale height of 170 pc, whose smaller error bares are probably due to the improved distance for PG 1701+359. With the new scale height the derived space density changes from 1.9
 pc-3 to 2.2
 pc-3. The conclusions are not affected.
Table to replace Table 3 of Theissen et al. (1993). Atmospheric parameters, interstellar extinctions, and distances of the single stars.
Table to replace Table 4 of Theissen et al. (1993). Deconvolved photometry, atmospheric parameters, and distances of the binary stars.
3.2. Moehler et al. (1990)
See Figs. 14, 15, and Table 13.
The distance values according to Eq. (9) are on average (6.8±2.5)% larger than the original ones. The scale height changes from (250±45) pc to (230±30) pc and the space density changes from 1×10⁻⁶ pc-3 to 1.1×10⁻⁶ pc-3. The conclusions are not affected.
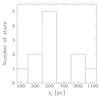 |
Fig. 14 Figure to replace Fig. 5 in Moehler et al. (1990). z distribution histogram of the sdB stars in the statistical-complete part of our sample. |
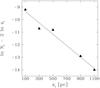 |
Fig. 15 Figure to replace Fig. 6 in Moehler et al. (1990). Determination of the scale height zs from the regression of lnNi−2lnzi. The full drawn line gives the regression resulting from the stars of our statistically complete sample. |
Table to replace Table 4 of Moehler et al. (1990). Physical parameters derived for the programme sdB stars.
4. Publications using distances for further analysis
In this section we describe – where known – the effects of the erroneous distances on further analyses. The information for de Boer et al. (1994a); Colin et al. (1994); Centurión et al. (1994); de Boer et al. (1997); Geffert (1998); Altmann et al. (2004) and Smoker et al. (2004, 2006) were kindly provided by K. S. de Boer and J. V. Smoker, respectively.
4.1. de Boer et al. (1994, distances to high-velocity clouds)
For the determination of the lower limit to the distance of the high-velocity gas Complex C three stars from Moehler et al. (1990) were used. The distance of these stars ought to have been on average (4.8±1.6)% larger, but this is an insignificant change in relation with the other uncertainties for such a determination. This publication was ultimately superseded by the review by van Woerden & Wakker (2004).
4.2. Colin et al. (1994, kinematics of sdB stars)
This first paper on galactic orbits of sdB stars used six stars from the Moehler et al. (1990) paper. Distances were on average (7±6)% too small. The conclusions are unaffected and this research was much extended by de Boer et al. (1997), using 41 stars.
4.3. Centurión et al. (1994, distances to high-velocity gas)
Using the presence or absence of Na i and Ca ii interstellar absorption lines towards various stars from Moehler et al. (1990) and Theissen et al. (1993), distance limits for high-velocity gas clouds were attempted to be obtained. Correcting for the revised distances as given in the above sections leads to the following results. Towards Complex C I the stellar distance now is 6% larger and the distance to the gas becomes larger accordingly. Towards Complex C IB the distance to the three stars used are on average 1% larger, so a negligible effect on the conclusions. Towards the Magellanic Stream, the three stars used are on average 7% more distant, but the conclusions are unchanged. Towards the Anticentre Cohen Stream the stellar distances are on average unchanged, so the conclusions are unaffected. Towards the AC complexes the stellar distances are now 7% larger but no interstellar absorption lines had been detected.
4.4. de Boer et al. (1997, kinematics of sdB stars)
The distribution perpendicular to the galactic plane of sdB stars was derived from sdB star orbits. 22 of the 41 stars came from Moehler et al. (1990). The paper also contains a discussion of the effects errors in the distances would have. A subset of the astrometric sample had been taken from Saffer et al. (1994) whose distances were smaller by up to a factor of 1.5 than distances derived with our methods. Due to the script error, the distances of the 22 Moehler et al. (1990) sdB stars included in the orbit study have to be to corrected upwards by on average 6.3%. This would increase the derived scale height by a few percent. That change is well within all other uncertainty limits so the conclusion of the paper, including the value of the scale height, stays unchanged.
4.5. Geffert (1998, kinematics)
Using Hipparcos data for fields around the globular clusters M 3 and M 92, also for the star PG 1716+426 the proper motion could be derived. The orbit calculated used the distance from Theissen et al. (1993) of 1200 ± 300 pc. The revised distance is 1300 ± 330 pc (see Table 12 above), well inside the margin of uncertainty, and this small change does not affect the conclusions of the paper.
4.6. Heber et al. (2002, resolving binary sdB stars)
This paper used WFPC2 images from the Hubble Space Telescope to resolve subdwarf B star systems that showed indications for late-type companions. The change of distance for PG 1718+519 from 810 pc to 880 pc changes the linear separation of the two components for that system from 230 AU to 240 AU. The conclusions are unaffected.
4.7. Altmann et al. (2004, kinematics of sdB stars)
This study considerably extended the above mentioned work by de Boer et al. (1997), now including 114 stars. The orbits and the overall spatial distribution of the sdB stars are based on distances derived with a different method than the one from Moehler et al. (1990). However, 19 stars from de Boer et al. (1997) were included, among them 17 with distances from the script used by Moehler et al. (1990). Again, distances of these 17 stars ought to have been larger by on average 6.3%. Since these stars form only a small fraction of the sample, the conclusions of this paper remain unchanged.
4.8. Smoker et al. (2004, 2006, distances to intermediate- and high-velocity clouds)
These publications used spectra of early-type stars to determine distances to intermediate- and high-velocity clouds and Ca abundances of the low velocity gas in front of these clouds. They used (among others) the stars PG 1710+426 (Moehler et al. 1990), PG 1718+519, PG 1725+252, PG 1738+505, and PG 1739+489 (all from Theissen et al. 1993), whose distances according to Eq. (9) are on average (6.8±1.6)% larger than the original ones. This does not affect their conclusions.
Acknowledgments
We thank K. S. de Boer for his help with evaluating the impact on publications using the original distances. This research has made use of NASA’s Astrophysics Data System Bibliographic Services.
References
- Altmann, M., Edelmann, H., & de Boer, K. S. 2004, A&A, 414, 181 [NASA ADS] [CrossRef] [EDP Sciences] [Google Scholar]
- Battistini, P., Bregoli, G., Fusi Pecci, F., Lolli, M., & Epps Bingham, E. A. 1985, A&AS, 61, 487 [NASA ADS] [Google Scholar]
- Buonanno, R., Buscema, G., Corsi, C. E., Iannicola, G., & Fusi Pecci, F. 1983, A&AS, 51, 83 [NASA ADS] [Google Scholar]
- Buonanno, R., Caloi, V., Castellani, V., et al. 1986, A&AS, 66, 79 [NASA ADS] [Google Scholar]
- Cacciari, C., Fusi Pecci, F., Bragaglia, A., & Buzzoni, A. 1995, A&A, 301, 684 [NASA ADS] [Google Scholar]
- Caloi, V., Castellani, V., Danziger, J., et al. 1986, MNRAS, 222, 55 [NASA ADS] [CrossRef] [Google Scholar]
- Centurión, M., Vladilo, G., de Boer, K. S., Herbstmeier, U., & Schwarz, U. J. 1994, A&A, 292, 261 [NASA ADS] [Google Scholar]
- Colin, J., de Boer, K. S., Dauphole, B., et al. 1994, A&A, 287, 38 [NASA ADS] [Google Scholar]
- Crocker, D. A., Rood, R. T., & O’Connell, R. W. 1988, ApJ, 332, 236 [NASA ADS] [CrossRef] [Google Scholar]
- de Boer, K. S., Altan, A. Z., Bomans, D. J., et al. 1994a, A&A, 286, 925 [NASA ADS] [Google Scholar]
- de Boer, K. S., Schmidt, J. H., & Heber, U. 1994b, in Proc. Hot Stars in the Galactic Halo, eds. S. J. Adelman, A. R. Upgren, & C. J. Adelman (CUP), 277 [Google Scholar]
- de Boer, K. S., Schmidt, J. H. K., & Heber, U. 1995, A&A, 303, 95 [NASA ADS] [Google Scholar]
- de Boer, K. S., Aguilar Sanchez, Y., Altmann, M., et al. 1997, A&A, 327, 577 [NASA ADS] [Google Scholar]
- Dorman, B., Lee, Y.-W., & Vandenberg, D. A. 1991, ApJ, 366, 115 [NASA ADS] [CrossRef] [Google Scholar]
- Dorman, B., Rood, R. T., & O’Connell, R. W. 1993, ApJ, 419, 596 [CrossRef] [Google Scholar]
- Dreizler, S., Heber, U., Werner, K., Moehler, S., & de Boer, K. S. 1990, A&A, 235, 234 [NASA ADS] [Google Scholar]
- Flower, P. J. 1996, ApJ, 469, 355 [NASA ADS] [CrossRef] [Google Scholar]
- Geffert, M. 1998, A&A, 340, 305 [NASA ADS] [Google Scholar]
- Harris, W. E. 1996, AJ, 112, 1487 [NASA ADS] [CrossRef] [Google Scholar]
- Heber, U., & Langhans, G. 1986, in New Insights in Astrophysics, Eight Years of UV Astronomy with IUE, ed. E. J. Rolfe, ESA SP, 263, 279 [Google Scholar]
- Heber, U., Kudritzki, R. P., Caloi, V., Castellani, V., & Danziger, J. 1986, A&A, 162, 171 [NASA ADS] [Google Scholar]
- Heber, U., Moehler, S., Napiwotzki, R., Thejll, P., & Green, E. M. 2002, A&A, 383, 938 [NASA ADS] [CrossRef] [EDP Sciences] [Google Scholar]
- Kurucz, R. L. 1992, in The Stellar Populations of Galaxies, eds. B. Barbuy, & A. Renzini, IAU Symp., 149, 225 [Google Scholar]
- Lamontagne, R., Wesemael, F., & Fontaine, G. 1987, ApJ, 318, 844 [NASA ADS] [CrossRef] [Google Scholar]
- Moehler, S., & Sweigart, A. V. 2006, A&A, 455, 943 [NASA ADS] [CrossRef] [EDP Sciences] [Google Scholar]
- Moehler, S., de Boer, K. S., & Heber, U. 1990, A&A, 239, 265 [NASA ADS] [Google Scholar]
- Moehler, S., Heber, U., & de Boer, K. S. 1994, in Proc. Hot Stars in the Galactic Halo, eds. S. J. Adelman, A. R. Upgren, & C. J. Adelman (CUP), 217 [Google Scholar]
- Moehler, S., Heber, U., & de Boer, K. S. 1995, A&A, 294, 65 [NASA ADS] [Google Scholar]
- Moehler, S., Heber, U., & Rupprecht, G. 1997, A&A, 319, 109 [NASA ADS] [Google Scholar]
- Moehler, S., Landsman, W., & Napiwotzki, R. 1998, A&A, 335, 510 [NASA ADS] [Google Scholar]
- Moehler, S., Landsman, W. B., & Dorman, B. 2000a, A&A, 361, 937 [NASA ADS] [Google Scholar]
- Moehler, S., Sweigart, A. V., Landsman, W. B., & Heber, U. 2000b, A&A, 360, 120 [NASA ADS] [Google Scholar]
- Moehler, S., Landsman, W. B., Sweigart, A. V., & Grundahl, F. 2003, A&A, 405, 135 [NASA ADS] [CrossRef] [EDP Sciences] [Google Scholar]
- Moehler, S., Dreizler, S., Lanz, T., et al. 2011, A&A, 526, A136 [NASA ADS] [CrossRef] [EDP Sciences] [Google Scholar]
- Moehler, S., Dreizler, S., LeBlanc, F., et al. 2014, A&A, 565, A100 [NASA ADS] [CrossRef] [EDP Sciences] [Google Scholar]
- Moni Bidin, C., Moehler, S., Piotto, G., Momany, Y., & Recio-Blanco, A. 2007, A&A, 474, 505 [NASA ADS] [CrossRef] [EDP Sciences] [Google Scholar]
- Moni Bidin, C., Moehler, S., Piotto, G., Momany, Y., & Recio-Blanco, A. 2009, A&A, 498, 737 [NASA ADS] [CrossRef] [EDP Sciences] [Google Scholar]
- Moni Bidin, C., Villanova, S., Piotto, G., Moehler, S., & D’Antona, F. 2011, ApJ, 738, L10 [NASA ADS] [CrossRef] [Google Scholar]
- Saffer, R. A., Bergeron, P., Koester, D., & Liebert, J. 1994, ApJ, 432, 351 [NASA ADS] [CrossRef] [Google Scholar]
- Salgado, C., Moni Bidin, C., Villanova, S., Geisler, D., & Catelan, M. 2013, A&A, 559, A101 [NASA ADS] [CrossRef] [EDP Sciences] [Google Scholar]
- Smoker, J. V., Lynn, B. B., Rolleston, W. R. J., et al. 2004, MNRAS, 352, 1279 [NASA ADS] [CrossRef] [Google Scholar]
- Smoker, J. V., Lynn, B. B., Christian, D. J., & Keenan, F. P. 2006, MNRAS, 370, 151 [NASA ADS] [CrossRef] [Google Scholar]
- Sweigart, A. V. 1987, ApJS, 65, 95 [NASA ADS] [CrossRef] [Google Scholar]
- Theissen, A., Moehler, S., Heber, U., & de Boer, K. S. 1993, A&A, 273, 524 [NASA ADS] [Google Scholar]
- van Woerden, H., & Wakker, B. P. 2004, in High Velocity Clouds, eds. H. van Woerden, B. P. Wakker, U. J. Schwarz, & K. S. de Boer, Astrophys. Space Sci. Lib., 312, 195 [Google Scholar]
All Tables
Table to replace Table 1 in Moni Bidin et al. (2007, NGC 6752). Atmospheric parameters and derived masses for target stars.
Table to replace Table 2 in Moehler et al. (2000a, 47 Tuc and NGC 362). Atmospheric parameters and masses for the programme stars as derived from low and medium resolution spectroscopic data. The surface gravities derived from the low resolution spectrophotometric data are rather uncertain. We also give the reduced χ2 values from the line profile fits and the errors listed below are the rms errors of the fit routine adjusted as described in the text [original paper]. The three rightmost columns give the cluster resp. SMC membership according to the radial velocity, proper motion, and derived mass of the star (see Sect. 5 [of the original paper] for details). A – means that the information places a star neither to the globular cluster nor to the SMC. Brackets note dubious assignments.
Table to replace Table 2 in Moehler et al. (2000b, NGC 6752). Physical parameters, helium abundances, and masses for the target stars in NGC 6752 as derived using metal-poor model atmospheres. We used the photometry of Buonanno et al. (1986) to derive the masses.
Table to replace Table 3 in Moehler et al. (2000b, NGC 6752). Physical parameters, helium abundances, and masses for the target stars in NGC 6752 as derived using solar metallicity model atmospheres.
Table to replace Table 5 in Moehler et al. (2000b, NGC 6752). Physical parameters, helium abundances, and masses for the target stars in NGC 6752 as derived using metal-rich model atmospheres.
Table to replace Table 6 in Moehler et al. (2000b, NGC 6752) Mean mass ratios between spectroscopically derived masses and predicted zero-age HB masses at the same effective temperatures. B 2697, B 3006 and stars cooler than 11 500 K are excluded from this comparison. ηR gives the Reimer’s mass loss parameter for the respective ZAHB. We derived the masses using the photometry of Buonanno et al. (1986). The cited errors are standard deviations.
Table to replace Table 2 in Moehler et al. (1998, UV bright stars). List of observed stars and their atmospheric parameters. The metallicities and radial velocities for the clusters are taken from the May 1997 tabulation of Harris (1996).
Table to replace Table 3 in Moehler et al. (1997, NGC 6752). Physical parameters of the observed stars. The star numbers and V, B−V data are taken from Buonanno et al. (1986), except for 3-118, whose data were obtained from Caloi et al. (1986).
Table to replace Table 2 in Moehler et al. (1995, M 15). Results in M 15. The numbers of the stars refer to Buonanno et al. (1983) and Battistini et al. (1985).
Table to replace Table 3 of Theissen et al. (1993). Atmospheric parameters, interstellar extinctions, and distances of the single stars.
Table to replace Table 4 of Theissen et al. (1993). Deconvolved photometry, atmospheric parameters, and distances of the binary stars.
Table to replace Table 4 of Moehler et al. (1990). Physical parameters derived for the programme sdB stars.
All Figures
|
Fig. 1 Values of −0.4·BC−4·log T∗ + C3 from Eq. (7) and |
| In the text | |
|
Fig. 2 Figure to replace Fig. 6 in Moehler et al. (2014, NGC 288). Masses from line profile fits. For comparison we also show a canonical zero-age horizontal branch from Moehler et al. (2003). In the upper plot we also show results from FORS2 observations of hot HB stars in M 80, NGC 5986 (Moni Bidin et al. 2009), NGC 6752 (Moni Bidin et al. 2007), and M 22 (Salgado et al. 2013). In the lower plot we also provide the results obtained from FLAMES and FORS2 observations of hot horizontal branch stars in ω Cen (Moehler et al. 2011, small squares; Moni Bidin et al. 2011, small triangles). |
| In the text | |
|
Fig. 3 Figure to replace Fig. 11 in Moehler et al. (2014, NGC 288). Masses determined from line profile fits for stars bluer than the Grundahl jump, using homogeneous (filled circles) and stratified (filled triangles) model spectra. |
| In the text | |
|
Fig. 4 Figure to replace Fig. 7 in Moehler et al. (2011, ω Cen). The effective temperatures and masses derived for our target stars (formal errors multiplied by two, see text [original paper] for details). Helium-poor and helium-rich stars are marked by open squares and filled triangles, respectively. The stars with super-solar helium abundances are shown with the parameters derived from models without C/N enhancement. The lines mark the zero-age horizontal branch for Y = 0.23 (solid) and 0.38 (dashed, see text [original paper] for details). |
| In the text | |
|
Fig. 5 Figure to replace Fig. 6 in Moni Bidin et al. (2007, NGC 6752). Differences of surface gravities and derived masses between this work and Moehler et al. (2000b) for the nine stars in common. The errors are the quadratic sum of the ones for each set of data. The difference is in the sense (our) – (M00). |
| In the text | |
|
Fig. 6 Figure to replace Fig, 6 in Moehler & Sweigart (2006, NGC 6388). Effective temperatures and masses for our target stars. For comparison we show both the canonical ZAHB (Y = 0.23, solid line) and two helium-rich ZAHBs (Y = 0.33, long dashed line; Y = 0.43, short dashed line). |
| In the text | |
|
Fig. 7 Figure to replace Fig. 9 in Moehler et al. (2003, M 3 and M 13). Temperatures and masses of the programme stars in M 3 and M 13 (from metal-rich model atmospheres for stars hotter than 12 000 K and metal-poor model atmospheres for cooler stars; in both cases metal lines were included in the theoretical spectra) compared to evolutionary tracks. a) The solid line marks the canonical ZAHB and the mixed ZAHB is given by the short-dashed line (see Sect. 6.1 [of the original paper] for details). b) Again the solid line marks the canonical ZAHB and the polluted ZAHBs are given by the dotted (Y = 0.28) and long-dashed line (Y = 0.33), respectively (see Sect. 6.2 [of the original paper] for details). |
| In the text | |
|
Fig. 8 Figure to replace Fig. 7a–c in Moehler et al. (2000b, NGC 6752). Temperatures and masses (derived from Buonanno et al.’s photometry) of the programme stars in NGC 6752. a) Determined using model atmospheres with cluster metallicity ([M/H] = −1.5), b) adopting a solar metallicity ([M/H] = 0) for the model atmospheres, c) adopting a super–solar metallicity ([M/H] = +0.5) for the model atmospheres. For more details see Sect. 4.1 [of the original paper]. The dashed resp. solid lines mark the ZAHB masses for a metallicity [M/H] = −1.54, as computed with and without mixing, respectively. (see Sect. 4.2 and Fig. 4 [of the original paper] for details). |
| In the text | |
|
Fig. 9 Figure to replace Fig. 9 in Moehler et al. (1997, NGC 6752). The resulting logarithmic masses listed in Table 3 [original paper, Table 9 here] vs. log Teff. The objects that were not used to derive the mean sdB mass (B 617, B 852, B 1754, B 4380) are marked by circles. Also plotted is the Zero Age HB for [Fe/H] = −1.48 of Dorman et al. (1993). The long dashed line marks the gap region seen in the CMD by Buonanno et al. (1986). |
| In the text | |
|
Fig. 10 Figure to replace Fig. 10 in Moehler et al. (1997, NGC 6752). The resulting masses plotted in Fig. 9 [original paper, Fig. 9 here] compared to masses of BHB stars in other clusters. The BHB data are taken from Paper I (Moehler et al. 1995, M 15), II (de Boer et al. 1995, NGC 6397), and Crocker et al. (1988, M 5, M 92, and NGC 288) |
| In the text | |
|
Fig. 11 Figure to replace Fig. 8 in Moehler et al. (1995, M15) The resulting masses for the stars inM15, plotted against Teff. The solid line represents a ZAHB model taken from Dorman et al. (1991) for [Fe/H] = −2.26 (YMS = 0.246, and [O/Fe] = 0.75). The short dashed line represents an extension of the ZAHB towards higher temperatures taken from Sweigart (1987) for YMS0.20 and ZMS = 104. a) Teff only from low resolution spectra b) parameters only from Balmer lines (the masses for B 348 (1.45 M⊙) and B 440 (3.08 M⊙) are left out, because they would corrupt the comparability of the plots) c) parameters from combination of continuum (resp. Q index) and Balmer lines. The marked stars are B 208, B 325, and B 276, for which the masses should be treated with great caution (see text [original paper]). |
| In the text | |
|
Fig. 12 Figure to replace Fig. 10 in Moehler et al. (1995, M 15). The resulting masses for the stars in M 15 (Table 2c and d [original paper, Table 10 here]), NGC 6752 (Moehler et al. 1994), M 5, M 92, NGC 288 (Crocker et al. 1988), and NGC 6397 (de Boer et al. 1994b) plotted against Teff. The solid line represents a ZAHB model taken from Dorman et al. (1991) for [Fe/H] = −2.26 (YMS = 0.246, and [O/Fe] = 0.75). The short dashed line represents an extension of the ZAHB towards higher temperatures taken from Sweigart (1987) for YMS = 0.20 and ZMS = 10-4. |
| In the text | |
|
Fig. 13 Figure to replace Fig. 6a and b in Theissen et al. (1993). a) Average distribution of the statistically complete sample perpendicular to the galactic plane, created by 10 000 Monte Carlo simulations. b) Regression of lnNi−2lnzi to determine the scale height which follows from the negative inverse of the slope. Ni denotes the number of stars in bin i, zi the distance. The full drawn line is the least square fit, weighted with the inverse errors; the dashed lines are extreme fits giving the errors in scale height. |
| In the text | |
|
Fig. 14 Figure to replace Fig. 5 in Moehler et al. (1990). z distribution histogram of the sdB stars in the statistical-complete part of our sample. |
| In the text | |
|
Fig. 15 Figure to replace Fig. 6 in Moehler et al. (1990). Determination of the scale height zs from the regression of lnNi−2lnzi. The full drawn line gives the regression resulting from the stars of our statistically complete sample. |
| In the text | |
Current usage metrics show cumulative count of Article Views (full-text article views including HTML views, PDF and ePub downloads, according to the available data) and Abstracts Views on Vision4Press platform.
Data correspond to usage on the plateform after 2015. The current usage metrics is available 48-96 hours after online publication and is updated daily on week days.
Initial download of the metrics may take a while.