[https://doi.org/10.1051/0004-6361:20030622]
[https://doi.org/10.1051/0004-6361:20020127]
[https://doi.org/10.1051/0004-6361/201322953]
[https://doi.org/10.1051/0004-6361:20031606]
[https://doi.org/10.1051/0004-6361:20078184]
[https://doi.org/10.1051/0004-6361/201015020]
[https://doi.org/10.1051/0004-6361:20065427]
Fig. 13
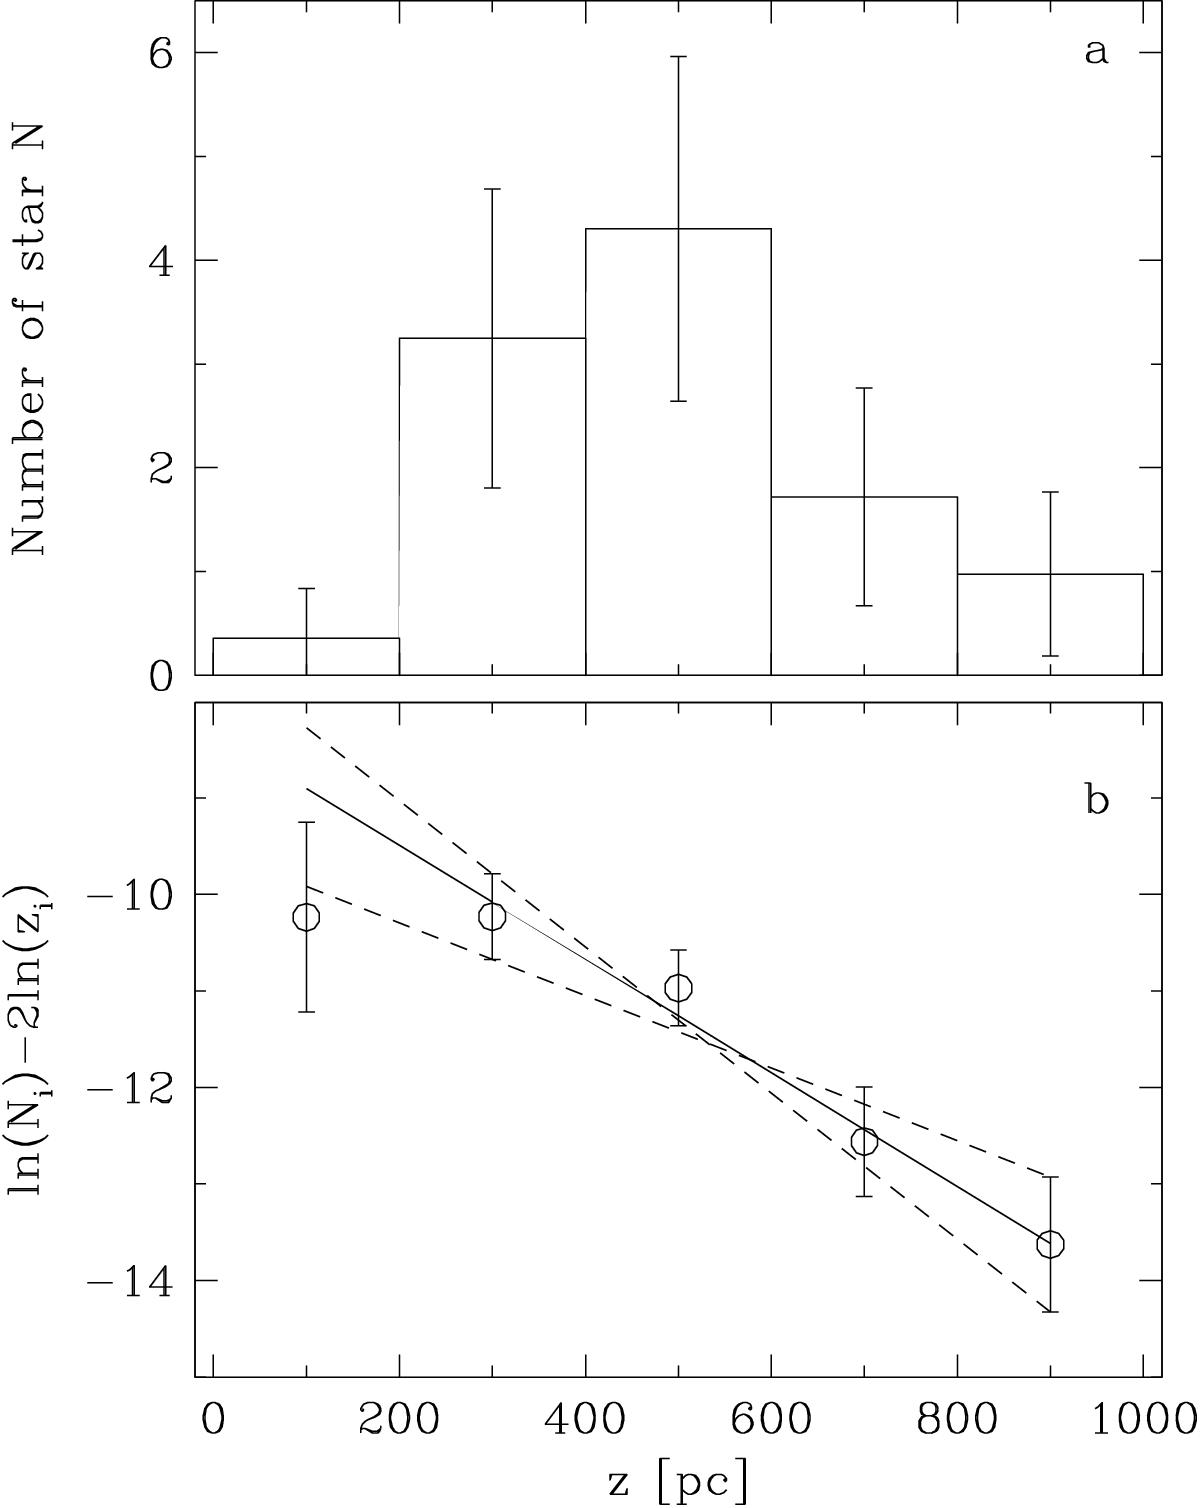
Figure to replace Fig. 6a and b in Theissen et al. (1993). a) Average distribution of the statistically complete sample perpendicular to the galactic plane, created by 10 000 Monte Carlo simulations. b) Regression of lnNi−2lnzi to determine the scale height which follows from the negative inverse of the slope. Ni denotes the number of stars in bin i, zi the distance. The full drawn line is the least square fit, weighted with the inverse errors; the dashed lines are extreme fits giving the errors in scale height.
Current usage metrics show cumulative count of Article Views (full-text article views including HTML views, PDF and ePub downloads, according to the available data) and Abstracts Views on Vision4Press platform.
Data correspond to usage on the plateform after 2015. The current usage metrics is available 48-96 hours after online publication and is updated daily on week days.
Initial download of the metrics may take a while.