[https://doi.org/10.1051/0004-6361:20030622]
[https://doi.org/10.1051/0004-6361:20020127]
[https://doi.org/10.1051/0004-6361/201322953]
[https://doi.org/10.1051/0004-6361:20031606]
[https://doi.org/10.1051/0004-6361:20078184]
[https://doi.org/10.1051/0004-6361/201015020]
[https://doi.org/10.1051/0004-6361:20065427]
Fig. 12
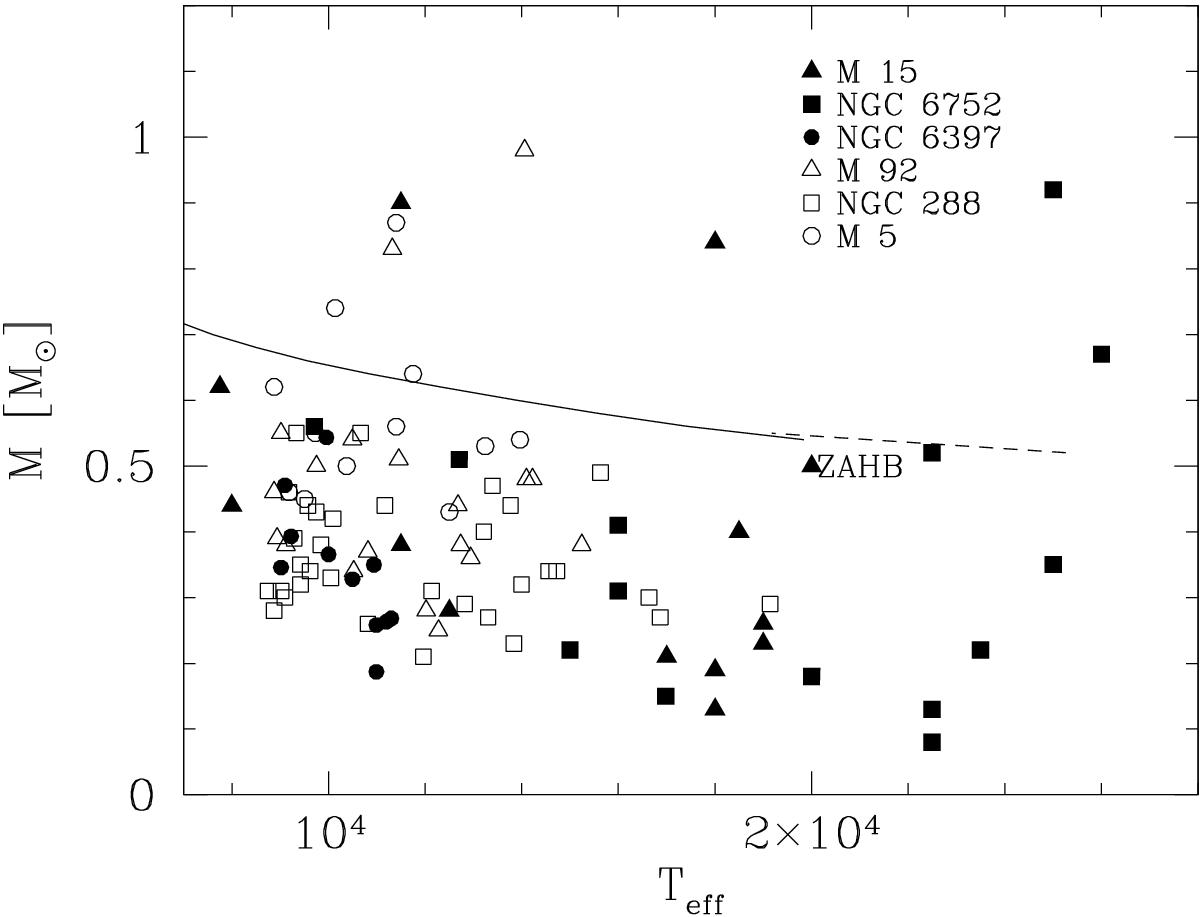
Figure to replace Fig. 10 in Moehler et al. (1995, M 15). The resulting masses for the stars in M 15 (Table 2c and d [original paper, Table 10 here]), NGC 6752 (Moehler et al. 1994), M 5, M 92, NGC 288 (Crocker et al. 1988), and NGC 6397 (de Boer et al. 1994b) plotted against Teff. The solid line represents a ZAHB model taken from Dorman et al. (1991) for [Fe/H] = −2.26 (YMS = 0.246, and [O/Fe] = 0.75). The short dashed line represents an extension of the ZAHB towards higher temperatures taken from Sweigart (1987) for YMS = 0.20 and ZMS = 10-4.
Current usage metrics show cumulative count of Article Views (full-text article views including HTML views, PDF and ePub downloads, according to the available data) and Abstracts Views on Vision4Press platform.
Data correspond to usage on the plateform after 2015. The current usage metrics is available 48-96 hours after online publication and is updated daily on week days.
Initial download of the metrics may take a while.