[https://doi.org/10.1051/0004-6361:20030622]
[https://doi.org/10.1051/0004-6361:20020127]
[https://doi.org/10.1051/0004-6361/201322953]
[https://doi.org/10.1051/0004-6361:20031606]
[https://doi.org/10.1051/0004-6361:20078184]
[https://doi.org/10.1051/0004-6361/201015020]
[https://doi.org/10.1051/0004-6361:20065427]
Fig. 7
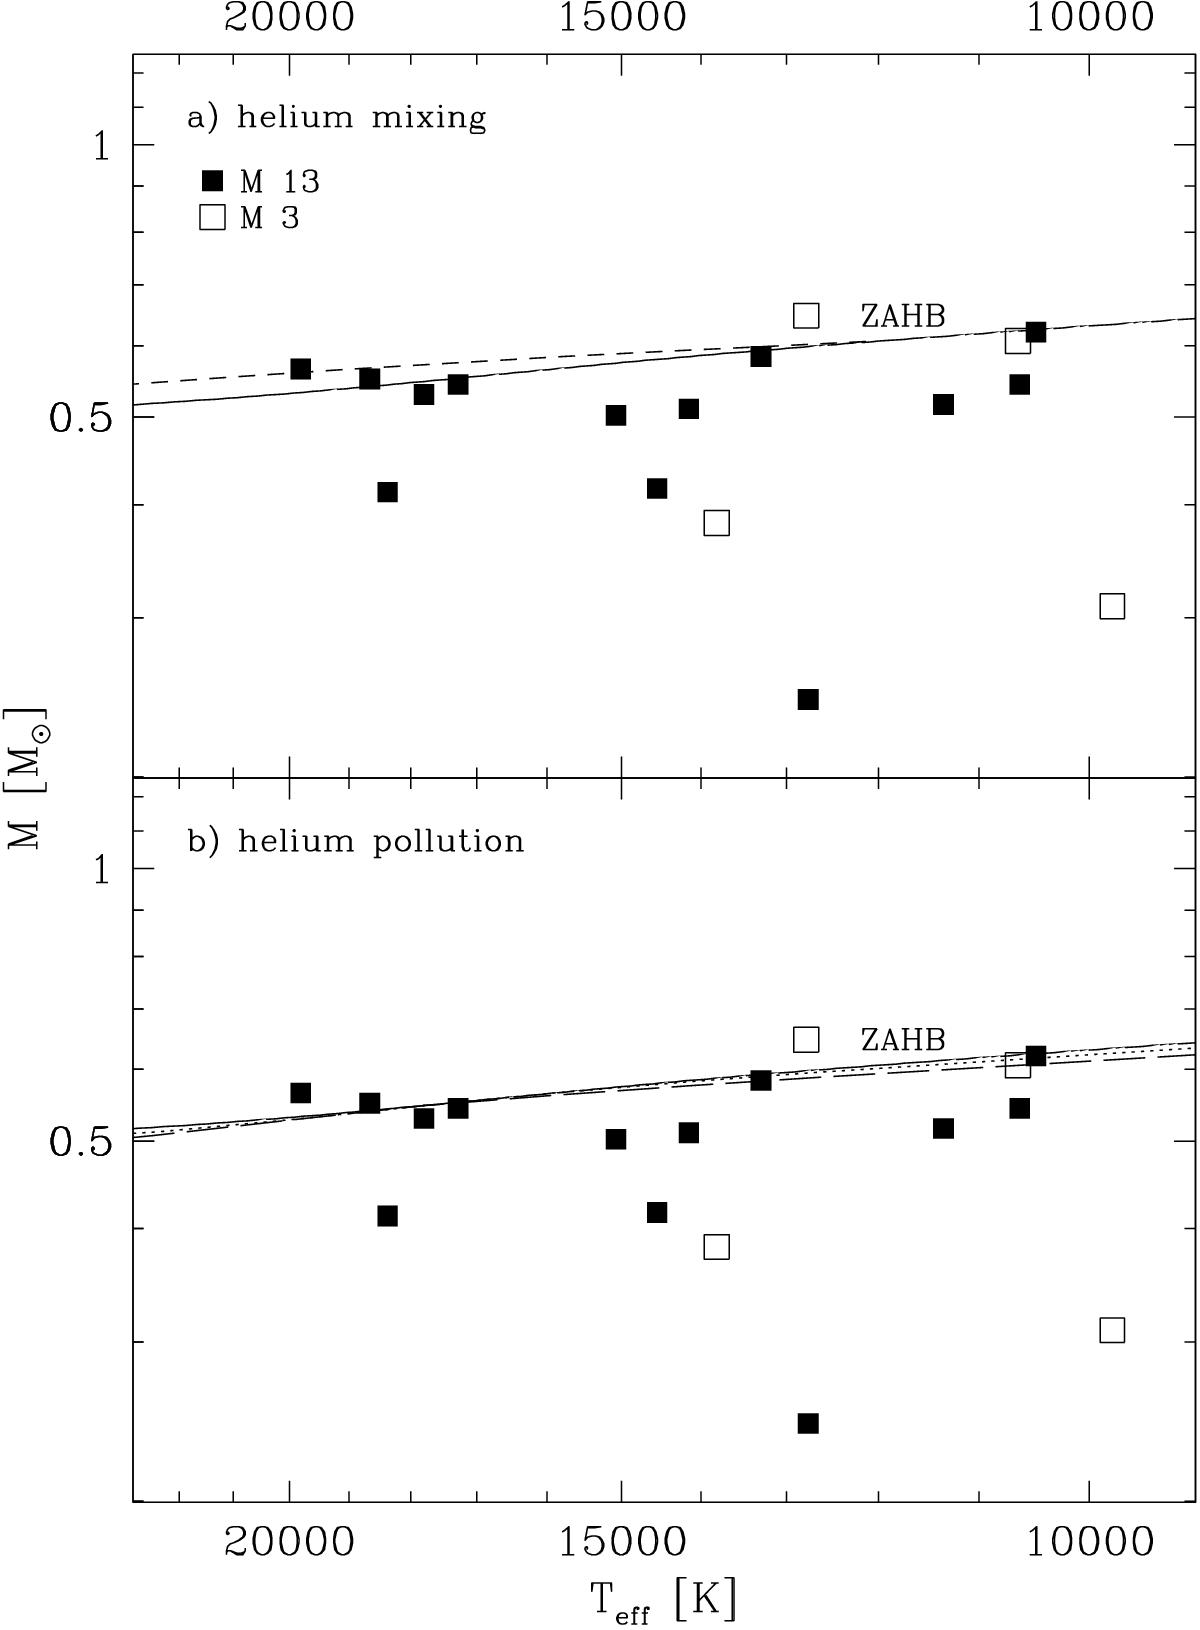
Figure to replace Fig. 9 in Moehler et al. (2003, M 3 and M 13). Temperatures and masses of the programme stars in M 3 and M 13 (from metal-rich model atmospheres for stars hotter than 12 000 K and metal-poor model atmospheres for cooler stars; in both cases metal lines were included in the theoretical spectra) compared to evolutionary tracks. a) The solid line marks the canonical ZAHB and the mixed ZAHB is given by the short-dashed line (see Sect. 6.1 [of the original paper] for details). b) Again the solid line marks the canonical ZAHB and the polluted ZAHBs are given by the dotted (Y = 0.28) and long-dashed line (Y = 0.33), respectively (see Sect. 6.2 [of the original paper] for details).
Current usage metrics show cumulative count of Article Views (full-text article views including HTML views, PDF and ePub downloads, according to the available data) and Abstracts Views on Vision4Press platform.
Data correspond to usage on the plateform after 2015. The current usage metrics is available 48-96 hours after online publication and is updated daily on week days.
Initial download of the metrics may take a while.