[https://doi.org/10.1051/0004-6361:20030622]
[https://doi.org/10.1051/0004-6361:20020127]
[https://doi.org/10.1051/0004-6361/201322953]
[https://doi.org/10.1051/0004-6361:20031606]
[https://doi.org/10.1051/0004-6361:20078184]
[https://doi.org/10.1051/0004-6361/201015020]
[https://doi.org/10.1051/0004-6361:20065427]
Fig. 11
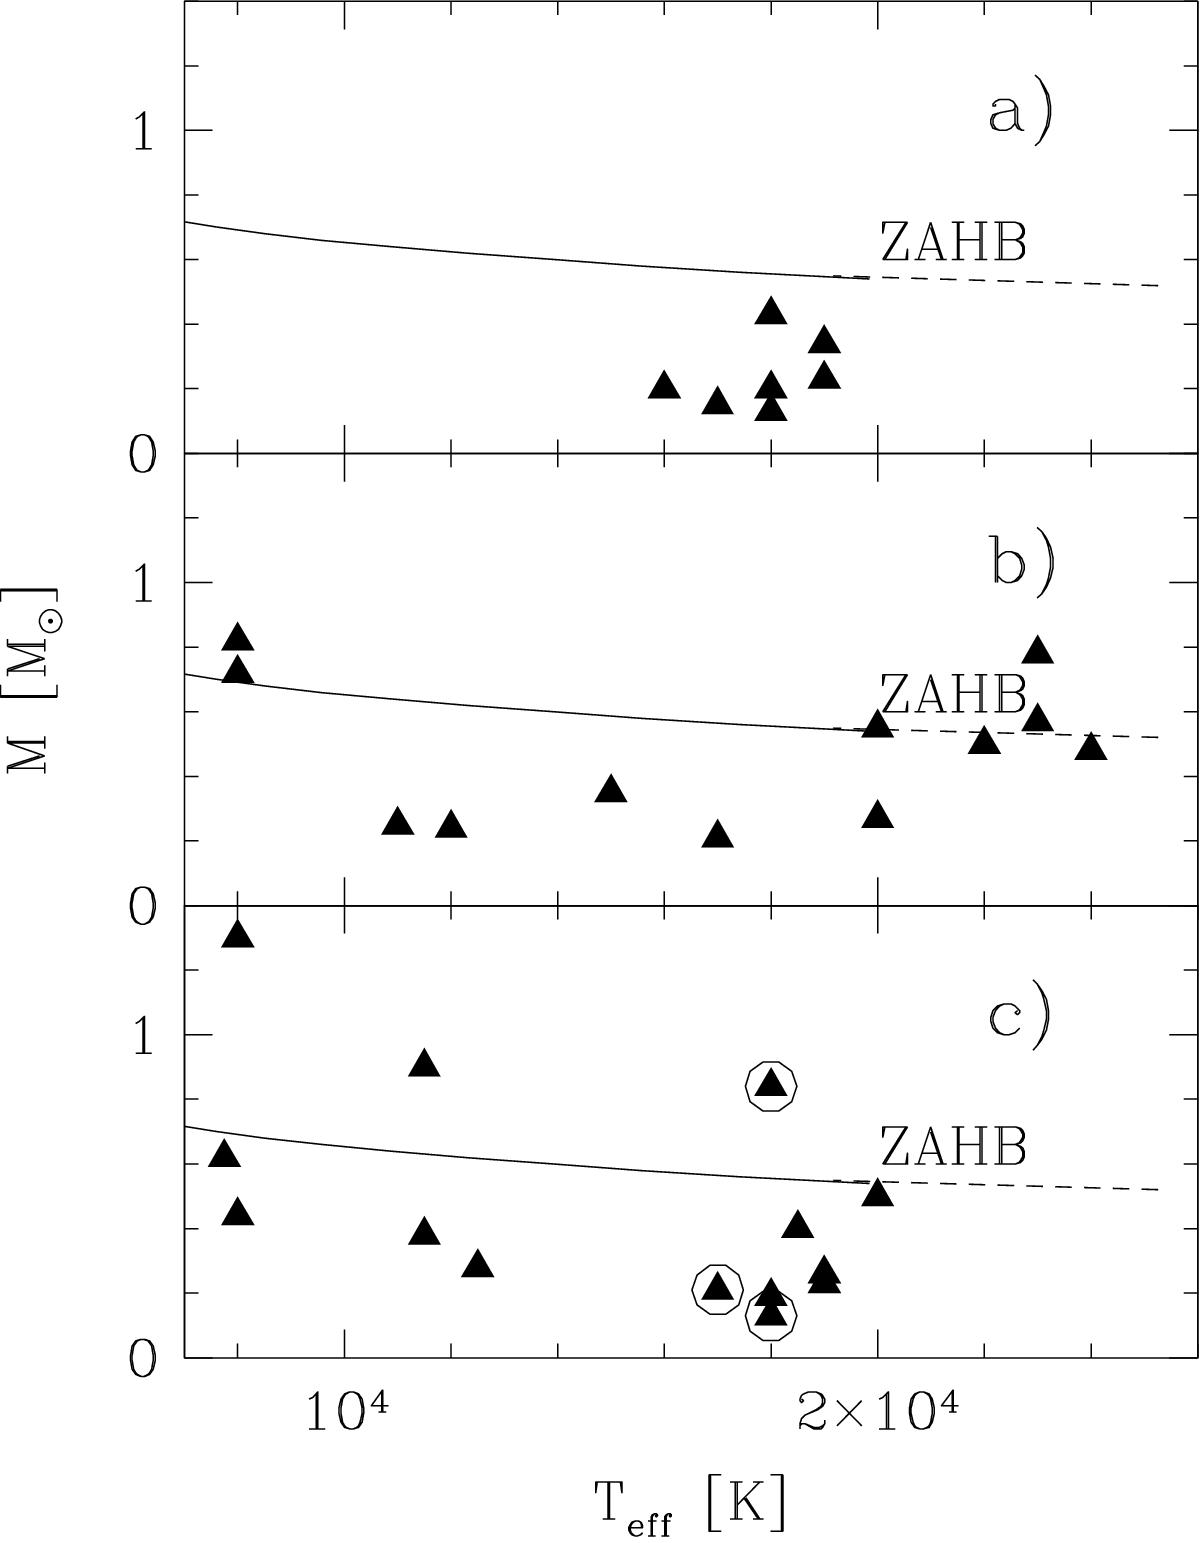
Figure to replace Fig. 8 in Moehler et al. (1995, M15) The resulting masses for the stars inM15, plotted against Teff. The solid line represents a ZAHB model taken from Dorman et al. (1991) for [Fe/H] = −2.26 (YMS = 0.246, and [O/Fe] = 0.75). The short dashed line represents an extension of the ZAHB towards higher temperatures taken from Sweigart (1987) for YMS0.20 and ZMS = 104. a) Teff only from low resolution spectra b) parameters only from Balmer lines (the masses for B 348 (1.45 M⊙) and B 440 (3.08 M⊙) are left out, because they would corrupt the comparability of the plots) c) parameters from combination of continuum (resp. Q index) and Balmer lines. The marked stars are B 208, B 325, and B 276, for which the masses should be treated with great caution (see text [original paper]).
Current usage metrics show cumulative count of Article Views (full-text article views including HTML views, PDF and ePub downloads, according to the available data) and Abstracts Views on Vision4Press platform.
Data correspond to usage on the plateform after 2015. The current usage metrics is available 48-96 hours after online publication and is updated daily on week days.
Initial download of the metrics may take a while.