| Issue |
A&A
Volume 603, July 2017
|
|
|---|---|---|
| Article Number | L6 | |
| Number of page(s) | 14 | |
| Section | Letters | |
| DOI | https://doi.org/10.1051/0004-6361/201730524 | |
| Published online | 19 July 2017 | |
Direct evidence of multiple reservoirs of volatile nitrogen in a protosolar nebula analogue
1 Institut Universitaire de France, 75231 Paris Cedex 05, France
2 Université Grenoble Alpes, CNRS, IPAG, 38000 Grenoble, France
e-mail: This email address is being protected from spambots. You need JavaScript enabled to view it.
3 Chester F. Carlson Center for Imaging Science, School of Physics & Astronomy, and Laboratory for Multiwavelength Astrophysics, Rochester Institute of Technology, 54 Lomb Memorial Drive, Rochester, NY 14623, USA
4 Harvard-Smithsonian Center for Astrophysics, 60 Garden Street, Cambridge, MA 02138, USA
Received: 30 January 2017
Accepted: 23 June 2017
Abstract
Isotopic ratios are keys to understanding the origin and early evolution of the solar system in the context of Galactic nucleosynthesis. The large range of measured 14N/15N isotopic ratios in the solar system reflects distinct reservoirs of nitrogen whose origins remain to be determined. We have directly measured a C14N/C15N abundance ratio of 323 ± 30 in the disk orbiting the nearby young star TW Hya. This value, which is in good agreement with nitrogen isotopic ratios measured for prestellar cores, likely reflects the primary present-day reservoir of nitrogen in the solar neighbourhood. These results support models invoking novae as primary 15N sources as well as outward migration of the Sun over its lifetime, and suggest that comets sampled a secondary, 15N-rich reservoir during solar system formation.
Key words: astrochemistry / ISM: abundances / galaxies: abundances / Galaxy: evolution / comets: general
© ESO, 2017
1. Introduction
Understanding the formation of the solar system is a prerequisite to a comprehensive theory of our origins, while providing essential clues for the birth of planetary systems in general. Early solar system bodies, such as comets and asteroids, provide a detailed view of the composition of the protosolar nebula (PSN) 4.6 billion years ago (Mumma & Charnley 2011; Bockelée-Morvan et al. 2015). The physical and chemical conditions prevailing in the PSN were set up in the collapsing proto-Sun, which were themselves products of the conversion, over a few million years, of diffuse and mostly atomic interstellar gas into a dense, gravitationally unstable, molecular prestellar core (Ceccarelli et al. 2014). A key question from both astrophysical and planetary science perspectives is to know to what extent the reservoirs of volatiles (namely, gas and ice) in planetary systems are of interstellar nature or if chemistry was reset in the PSN at the epoch of planet formation.
Isotopic ratios are a powerful tool to evince the chemical heritage preserved during this secular evolution. For example, the large D/H ratio in terrestrial water may indicate that it likely encoded the interstellar history of the solar system (Cleeves et al. 2014). In contrast, the origin of nitrogen, the most reactive and abundant heavy nuclei, together with carbon and oxygen, has not been elucidated for two main reasons: i) the elemental 14N/15N isotopic ratio of nitrogen in the present-day solar neighbourhood (which we denote ℛ0) is poorly constrained; and ii) the primary repository of nitrogen in star and planet forming regions is unknown, such that chemical model predictions are highly uncertain. Constraints on the origin of nitrogen in the PSN derive from laboratory and in situ analysis of primordial solar system materials (Rubin et al. 2015), and from observations of solar-type star-forming regions in the solar neighbourhood within a few 100 pc (Hily-Blant et al. 2013a). The primary reservoir of nitrogen in the PSN had a 14N/15N ratio ℛ⊙ = 441 as measured in Jupiter’s atmosphere and in the solar wind (Füri & Marty 2015) but values as low as 50 are observed today in some primitive cosmomaterials (Bonal et al. 2010). Comets, observed in CN, HCN, and NH2, show a strikingly uniform ratio of ≈ 140 regardless of their orbital parameters (Mumma & Charnley 2011; Shinnaka et al. 2016, and Fig. A.1), suggesting that they recorded a secondary nitrogen reservoir or that the main reservoir of nitrogen has not yet been seen in comets.
A central question is to establish whether the different reservoirs of nitrogen that are observed today in the solar system were inherited from the interstellar phase, or if they result from fractionation processes within the PSN or in parent bodies (Hily-Blant et al. 2013a; Füri & Marty 2015). A first step in addressing this issue would be to demonstrate the existence of multiple reservoirs in protoplanetary disks, which serve as analogues for the PSN. This is a primary objective of the present work.
The origin of nitrogen in the solar system is actually a problem in both space and time, as it involves the comparison of the composition of the PSN, formed at some location in the Galaxy 4.6 billion years ago, to that of present-day star-forming regions at a galactocentric radius rG ≈ 8.5 kpc. One key point is the chemical homogeneity of the local interstellar medium (LISM) within ~ 1 kpc (Sofia & Meyer 2001), which makes nearby protoplanetary disks representative of planetary formation at rG ≈ 8.5 kpc. Qualitatively, the elemental 14N/15N in the Galaxy is expected to decrease with time, and to increase with increasing galactocentric radius, as a result of stellar nucleosynthesis (Audouze et al. 1975; Matteucci 2012). Nevertheless, predictions of Galactic chemical evolution (GCE) models can vary significantly depending on the specific assumptions concerning the nuclear processes leading to 15N, the Galactic star formation history, and the initial mass function of newly born stars (Romano & Matteucci 2003; Minchev et al. 2013). Moreover, the birthplace of the Sun remains poorly known (Martínez-Barbosa et al. 2015). Measuring ℛ0 would provide the reference value needed to establish the heretofore missing link between the PSN and present-day planet-forming disks orbiting young stars. The value of ℛ0 is the other aim of the present study.
However, measuring ℛ0 is challenging because the primary reservoir of nitrogen in cores, protostars, and protoplanetary disks – presumably N or N2 (or perhaps icy ammonia in the densest parts) – cannot be observed directly. Therefore, ℛ0 must be inferred from trace species (e.g. HCN, NH3, etc.) usually with the aid of chemical models (Le Gal et al. 2014; Roueff et al. 2015). Moreover, radiation from 15N isotopologues is intrinsically weaker than from the main isotopologue by typically two orders of magnitude thus requiring excellent sensitivity.
It is well established that evolved protoplanetary disks are bright CN line sources (Guilloteau et al. 2013) and that, even for the strongest CN sources among disks, some hyperfine transitions of CN are optically thin (Kastner et al. 2015; Punzi et al. 2015). This species hence potentially affords a direct means to infer N isotope ratios in disks, without the need to resort to assumptions concerning secondary elemental isotopic ratios or line optical depths.
2. Observations
With this as motivation, we have undertaken ALMA observations of the C14N(3−2) and C15N (3−2) rotational emission at 340 and 330 GHz respectively (see Table A.1) from the molecule-rich disk orbiting TW Hya, a nearby (d = 59.5(9) pc1), nearly pole-on T Tauri star and disk system that displays exceptionally bright, narrow CN line emission (Kastner et al. 2015; Teague et al. 2016).
Observations of TW Hya were performed in December 2014 and April 2015, using the Atacama Large Millimeter/submillimeter Array (ALMA) interferometer (proposal 2013.1.00196.S). The Fourier plane was sampled by 47 antennas, covering baselines from 15 to 343 m. The CN and C15N rotational lines N = 3 − 2 were observed simultaneously with a channel spacing of 61 kHz (or 0.107 km s-1 effective velocity resolution at 340 GHz). The rest frequency for the C15N(3−2) hyperfine transitions were taken from the CDMS spectroscopic catalogue (Müller et al. 2005), with 1σ uncertainties of 90 kHz. The CDMS frequencies for the CN(3−2) set of hf lines have much reduced uncertainties of a few 10 kHz only. Flux calibration was performed using Callisto as an absolute reference, while bandpass and phase calibrations were obtained by observing the J1256-0547 and J1037-2934 QSOs respectively. After a first round of calibration using the CASA software (version 4.2.2), the phase calibration was improved using a self-calibration procedure based on the continuum, line-free, emission, from large bandwidth observations performed in parallel to the spectral line observations. The self-calibrated output was then applied to both CN and C15N. Cross-calibration uncertainties were mitigated by the simultaneous observation of the two isotopologues, while the small (3%) difference in lines frequency ensures nearly identical Fourier plane coverages, continuum emission, and absolute intensity calibration. The calibrated data were then exported to the Gildas2 package format for imaging and analysis.
The CN hyperfine (hf) transitions are well resolved and detected with a high signal-to-noise ratio (S/N) (see Figs. 1 and 2). Specifically, our CN detections include four hf lines with relative intensities 0.054 and 0.027 (see Table A.1). Of the four hf components of the C15N (N = 3 − 2) rotational transition included in our frequency setups, three were successfully detected and are optically thin, while the weakest was only tentatively detected (see panels b and c of Fig. 1).
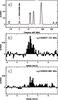 |
Fig. 1 Spectra, averaged within the dashed circle in Fig. 2, of the entire C14N a) and of the two sets of hyperfine lines of C15N b) and c). The hyperfine splitting and relative strengths of the hf components are indicated below the spectra. |
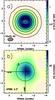 |
Fig. 2 Integrated intensity maps towards TW Hya with ALMA. a) C14N emission summed over the four weakest hyperfine components. b) C15N from 329835.5 to 329838.5 MHz, with spatial resolution degraded to 2.3′′. The phase center is at 11h01m51.875s, − 34°42′17.16′′ (J2000). |
To produce the images shown in Fig. 2, deconvolution was performed using the Högbom algorithm as implemented in the Gildas/Mapping software. The clean beam at 340 GHz was 0.90″ × 0.53″ and with a position angle of 86°, and the final sensitivity is between 1.8 and 3.6 mJy/beam/channel. The continuum peak and integrated flux at 340.0465 GHz are 378.0(3) mJy/beam and 1.426(2) Jy respectively, in agreement with observations at nearby frequencies (Qi et al. 2013; Nomura et al. 2016). To increase the S/N of the C15N, robust weighting was applied providing good compromise between beam size and secondary lobes level. The synthesized beamwidth is 2.3′′, and the sensitivity was between 5.3 to 6.4 mJy/beam/channel.
The CN map shows a ring structure of deconvolved inner and outer half-maximum radii of roughly 15 and 70 AU respectively, as derived from a very simple model (Figs. 2 and 3), consistent with previous studies based on molecular and continuum emissions (Qi et al. 2013; Teague et al. 2016; Nomura et al. 2016). The very high S/N channel maps of the optically thin CN hyperfine transitions at 340.020 and 340.265 GHz are shown in Fig. A.2, illustrating both the well-known kinematic pattern of Keplerian disks and the ring-like emission pattern.
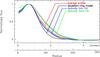 |
Fig. 3 Azimuthally averaged radial profiles of the integrated flux for the 7 hyperfine (hf) components of C14N, four of which are optically thin, the remaining three being optically thick (Fig. 2). The average of the 7 hf components is shown in red. The black line shows the result of a sharp inner-ring model plus Gaussian decrease outwards, convolved by the synthesized beam. The unconvolved ring has a radius of 0.7′′ or 42 AU, and a full-width at half-maximum of 54 AU (at a distance of 59.5 ± 0.9 pc). |
3. The CN/C15N abundance ratio in TW Hya
Results of the uv-plane analysis (see the text for details) using visibilities within a uv radius of 60 m.
The disk-averaged CN/C15N abundance ratio was derived from the integrated visibilities of optically thin hf components of each isotopologue. The chosen CN hf transition at 340.020 GHz is readily shown to be optically thin by considering the total opacity of the CN line, which is of order 4−5 (Kastner et al. 2014), and recognizing that this hf line carries 5.4% of the total intensity. The low optical depth is confirmed by hyperfine analysis of the ALMA spectra and by the identical lineshapes of the disk-averaged spectra of the 4 weakest hf transitions with relative intensities 2.7 and 5.4% (see Fig. C.1 and Appendix C for details). Because C15N is typically a hundred times (or more) less abundant than CN, its detected hf lines are also optically thin. The visibilities of the CN hf line and of the overlapping C15N hf transitions at 329.837 GHz were integrated over a 2 km s-1 velocity interval, to optimize S/N, and tapered before fitting in the uv plane by a two-dimensional Gaussian distribution. In doing so, the geometrical parameters were indeed obtained from the high S/N CN map, and then applied to the C15N visibilities letting the C15N integrated flux as the unique free parameter.
The derived integrated flux ratio was translated into a column density ratio by assuming a single excitation temperature for both isotopologues. This assumption is strongly supported by the common excitation temperature of ≈ 20 − 25 K for the CN(3−2) (see Appendix C) and CN(2−1) transitions (Teague et al. 2016). Thermalization is most likely ensured by the high density regions responsible for the CN emission, as inferred from the low kinetic temperatures traced by the narrow CN lines (see Appendix C).
After propagating the various sources of uncertainty, the disk-averaged CN/C15N abundance ratio is 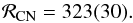 (1)
(1)
4. Two isotopic reservoirs of nitrogen in disks
This direct determination of the CN isotopic ratio in TW Hya can be compared to the indirectly measured ratio in HCN in the nearby (d = 140 pc) protoplanetary disk orbiting MWC 480. We have applied the same uv plane analysis described above to archival H13CN and HC15N data for MWC 480 (Guzmán et al. 2015), obtaining  (2)which improves on, but is consistent with, the 2.8(1.4) value formerly derived. The improvement over the previous analysis is most likely due to our fitting approach which involves fewer free parameters by assuming identical disk properties for both isotopologues. Indeed, our ratio for the MWC 480 disk also agrees well with recent re-analysis of the data (Guzmán et al. 2017).
Assuming that the abundance ratio HCN/H13CN is equal to the elemental 12C/13C isotopic ratio, and adopting 68(15) for the latter (Milam et al. 2005), we obtain an isotopic ratio of nitrogen in HCN in MWC 480 of  (3)The chemical composition of the solar neighbourhood being homogeneous (Sofia & Meyer 2001), it follows that the elemental, hence primary, reservoir of nitrogen in both TW Hya and MWC 480 should have the same isotopic ratio. Consequently, the distinct ratios in CN and HCN demonstrate that, in addition to the elemental reservoir, at least one of these two disks contains another reservoir of nitrogen, which is fractionated and 15N-rich. Although the HCN/H13CN in disks is not known, the foregoing conclusion would hold true unless this ratio was larger than 132. In the context of prestellar cores, such high ratios have been predicted by recent chemical models (Roueff et al. 2015), but are inconsistent with observations which lead to a ratio of 30 (Daniel et al. 2013). Combined with GCE models predicting that the enrichment in 15N through stellar nucleosynthesis over the last 4.6 billion years implies ℛ0> 232 (Romano & Matteucci 2003), our result demonstrates that HCN in MWC 480, and in the disks studied in Guzmán et al. (2017), traces a heavily fractionated, hence secondary, reservoir of nitrogen.
From our study, it appears that CN and HCN in disks are not tracing the same reservoirs and therefore that the detected CN is not a photodissociation product of HCN. This would imply that CN emission is not dominated by the upper, UV-exposed, disk layer, as is usually assumed (Teague et al. 2016). In contrast, CN emission from cold and UV-shielded regions seems to be favoured. This is further supported by the narrow CN linewidths which constrain the kinetic temperature to be lower than 20−25 K within the CN ring and beyond (see Appendix C). Observations of both CN and HCN at high spatial resolution in a sample of disks spanning a range of viewing geometries, coupled with comprehensive radiative transfer models, are required to fully address the question of the specific origin of the CN emission in disks.
5. The 14N/15N isotopic ratio in the present-day ISM
In the following, we provide arguments that the CN/C15N abundance ratio we have directly measured in the disk orbiting TW Hya is in fact also a measurement of the elemental 14N/15N isotopic ratio in the present-day LISM.
The CN abundance measured in the TW Hya disk ratio agrees very well with the average ratio in NH3 of 321(36) towards Barnard 1, and in N2H+ of 365(135) towards L1689E. Although ratios up to ~ 1000 have been obtained using N2H+ (Bizzocchi et al. 2013), the weighted average of direct measurements performed in prestellar cores is 336(16) (see Table D.1) and is in very good agreement with our CN ratio in TW Hya. If one adopts the predictions from selective photodissociation disk models (Heays et al. 2014), CN in TW Hya would be enriched in 15N by ≈ 80% with respect to the elemental reservoir. The elemental ratio in TW Hya, and hence in the LISM, would be ℛ0 ≈ 600, thus larger than in the PSN 4.6 Gyr ago, at odds with galactic evolution chemical model predictions. This would require ammonia and dyazelinium (N2H+) in dense cores to be similarly enriched by 80%, in sharp disagreement with predictions of chemical fractionation models (Hily-Blant et al. 2013b; Roueff et al. 2015; see Appendix D). This suggests that the efficiency of selective photodissociation may be much lower in TW Hya.
Given the concomitant ratios in TW Hya and in prestellar cores, a more likely interpretation is that CN, NH3, and N2H+, are tracing a single reservoir of nitrogen. Furthermore, this reservoir would be the primary one, therefore reflecting the elemental isotopic ratio in the present-day solar neighbourhood. This scenario is in good agreement with the HCN/HC15N and CN/C15N ratios in the diffuse LISM (see Fig. 4 and Table D.1). Ratios derived from CN lines in the ultraviolet (UV) show a large scatter, with ratios as high as 452(107), but yield an average ratio of 274(18) – although not compatible with one lower limit at 312. Absorption spectroscopy using the (1−0) rotational line of HCN in translucent clouds (AV = 1 − 4 mag, Glück et al. 2017) yield a similar average of 276(34) (Lucas & Liszt 1998). In these clouds, CN is efficiently produced by photodissociation of HCN, and both species most likely originate from a single reservoir of nitrogen, presumably in atomic form (Boger & Sternberg 2005). Chemical mass fractionation is inefficient in these clouds (Tk> 15 − 30 K), but selective photodissociation is predicted to enhance 15N by 10% in CN and HCN (Heays et al. 2014). The low ratios in diffuse clouds would thus correspond to an elemental ratio of 304(37), in agreement with, although at the lower end of, the CN ratio we have measured in TW Hya.
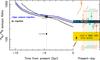 |
Fig. 4 Present-day nitrogen isotopic ratio in the solar neighbourhood compared to Galactic Chemical Evolution models predictions. Shaded areas: ALMA measurements of the CN/C15N and HCN/HC15N ratios in TW Hya and MWC 480 respectively. Symbols: directly measured ratios (i.e. not using double-isotopic ratios) in the present-day solar neighbourhood at rG = 8.5(10) kpc (references are provided in Table D.1). Black curves: GCE model predictions Romano & Matteucci (2003) scaled to a PSN ratio of ℛ⊙ = 441, with 15N as a primary (full line, their model 2) or secondary product (dashed lines, their models 3s an 3n). Blue curve: GCE model 2 including a 2 kpc outward Sun migration (see the text for details). The weighted average isotopic ratios in comets of 144(3) (see also Fig. A.1) and of 111(19), from H13CN/HC15N observations in 5 disks (Guzmán et al. 2017), are also indicated. |
The conclusion that CN in TW Hya traces the primary reservoir of nitrogen also is in accord with predictions from galactic models. According to purely dynamical models, the Sun most likely did not migrate from its birthplace (Martínez-Barbosa et al. 2015), and the proposed current ratio ℛ0 = 323(30) would indicate a 15N-enrichment by up to 38(13)% above ℛ⊙ over the last 4.6 Gyr. This agrees, although marginally, with GCE calculations including 15N synthesis through novae outbursts (Fig. 4), and especially with models treating 15N as a primary product (Romano & Matteucci 2003). The agreement is much better with dynamical GCE models which instead predict that the Sun migrated outward by 0.3 to 3.6 kpc (Minchev et al. 2013). Indeed, applying the present-day galactic gradient dℛ / dR = 22.1 kpc-1 (Adande & Ziurys 2012) to the Milky Way at 4.6 Gyr in the past, our CN/C15N ratio would correspond to an outward migration of the Sun by ~2 kpc from its birth location, within the range predicted by dynamical GCE models. It is worth noting that, in addition to provide an explanation for the anomalously high solar metallicity with respect to young, local, B-type stars (Nieva & Przybilla 2012), the outward migration hypothesis would also bring the 12C/13C elemental isotopic ratio from GCE models (Romano & Matteucci 2003; Milam et al. 2005) into a better agreement with the PSN value of ≈ 90.
6. The origin of nitrogen in the solar system
Our inference that a fractionated reservoir of nitrogen is present at the time of comet formation in PSN analogues sheds new light on the history of nitrogen in the solar system. The presence of such a fractionated nitrogen reservoir in the primitive solar system would indicate that parent body evolution is not required to explain the average cometary ratio of 144(3) (see Fig. A.1). A more likely explanation is that atomic nitrogen, from which HCN presumably derives (Hily-Blant et al. 2013a), is a secondary repository of nitrogen at the PSN stage, supporting the usual assumption that N2 constitutes the primary reservoir (Schwarz & Bergin 2014; Füri & Marty 2015). In this interpretation, the isotopic ratio of 140 in NH3 in comets (Shinnaka et al. 2016) could indicate that cometary ammonia was primarily formed by hydrogenation of atomic nitrogen in CO-rich interstellar ices (Fedoseev et al. 2015). In addition, the ring-like distribution of CN in TW Hya, which encompasses the giant planet and Kuiper-belt regions, suggests that the primary reservoir was present in the comet-forming zone. Yet, the uniform isotopic ratio of 144 in all comets and the low N2/CO abundance ratio in comets Halley and 67P/C-G (Rubin et al. 2015) strongly suggest that the primary reservoir was lost, or not captured, by comets, although the underlying mechanism remains an open question. An alternative would be that the bulk of nitrogen in comets has still escaped detection. It is also striking that the ratio of the CN- and HCN-derived nitrogen isotopic ratios in disks, 323:111 (≈2.9), are in the same proportion as the mean PSN ratio, 441:144 (≈3.1), as measured in the Sun and comets. This further suggests that the fractionation processes building the two isotopic reservoirs of nitrogen, evinced in present-day PSN analogues, were equally active in the PSN, or in the prestellar core where it formed, 4.6 Gyr ago.
A picture emerges in which dinitrogen was the primary reservoir of nitrogen in the PSN, with an isotopic ratio of 441, whereas atomic N formed a secondary reservoir characterized by ℛ≈ 140. Earth’s atmosphere appears intermediate (ℛ = 272), which could reflect a mixture of the two reservoirs of volatile nitrogen, or a third reservoir in its own right (Füri & Marty 2015). The remarkably uniform ratio in comets (see Fig. A.1) suggests that both reservoirs were homogeneously distributed in the PSN. Disentangling the origin of the fractionated reservoir, between processes in the PSN and an interstellar origin, as suggested by the HCN isotopic ratios in prestellar cores (Hily-Blant et al. 2013a), requires high-sensitivity maps of the isotopic ratio in cores and especially of disks spanning a broad range of physical conditions. However, the small scatter of the HCN/HC15N ratios indirectly measured towards a sample of disks (Guzmán et al. 2017) spanning a broad range of ages and masses – hence likely representing a range of dust size distributions and UV radiation fields – argues in favour of a prestellar origin. Moreover, HCN/HC15N isotopic ratios as low as 140 were indirectly obtained in prestellar cores (Hily-Blant et al. 2013a). Nevertheless, direct measurements of HCN/HC15N in prestellar cores remain the missing clue to put the interstellar origin of the fractionated reservoir on a firmer ground. If the scenario presented here holds, we would predict that the HCN/HC15N ratio in prestellar cores should indeed be lower than the cometary ratio of 144, and closer to the average ratio in disks of 111(19), as a result of galactic chemical evolution.
7. Conclusions
Measurements of nitrogen isotopic ratios are keys to understanding the origin and evolution of the solar system in the context of Galactic nucleosynthesis. The large range of measured 14N/15N isotopic ratios in solar system bodies, from ≈440 in the Sun and Jupiter to ≈140 in comets, may reflect the presence of distinct reservoirs of nitrogen that have recorded interstellar initial conditions, chemical fractionation processes in the PSN, and/or secular elemental abundance evolution over the past 4.6 billion years. In this paper, we have presented the first direct measurement of the volatile C14N/C15N isotopic ratio within a protoplanetary disk. The ratio of 323(30), obtained with the ALMA interferometer, is in good agreement with the ratio measured for prestellar cores. The CN/C15N abundance ratio in the TW Hya disk therefore likely reflects a non-fractionated reservoir of nitrogen that is representative of the present-day elemental ratio of nitrogen in the solar neighbourhood. The comparison with the indirectly derived HCN/HC15N ratio in other disks demonstrate that disks at the comet formation stage already contain a heavily fractionated reservoir. The measurement of the HCN/HC15N ratio in TW Hya would provide a striking confirmation of this finding. On a broader perspective, our results support galactic chemical evolution models invoking novae outbursts as primary 14N sources as well as significant outward migration of the Sun over its lifetime, and furthermore suggest that, whereas the Sun and Jupiter incorporated mass from the PSN’s main nitrogen reservoir, solar system comets recorded a secondary, fractionated reservoir of nitrogen.
Here and elsewhere, 1σ uncertainties are given within brackets in units of the last digit.
Acknowledgments
P.H.B. acknowledges the Institut Universitaire de France for financial support. P.H.B. also thanks L. Bonal, N. Prantzos, and E. Quirico for fruitful discussions. The authors wish to thank the referee for a careful reading and for useful comments which improved the clarity of the paper. This paper makes use of the CDMS catalogue, the CASA and IRAM/GILDAS softwares, and of ALMA data. ALMA is a partnership of ESO (representing its member states), NSF (USA) and NINS (Japan), together with NRC (Canada), NSC and ASIAA (Taiwan), and KASI (Republic of Korea), in cooperation with the Republic of Chile. The Joint ALMA Observatory is operated by ESO, AUI/NRAO and NAOJ. This work has made use of data from the European Space Agency (ESA) mission Gaia (https://www.cosmos.esa.int/gaia), processed by the Gaia Data Processing and Analysis Consortium (DPAC, https://www.cosmos.esa.int/web/gaia/dpac/consortium). Funding for the DPAC has been provided by national institutions, in particular the institutions participating in the Gaia Multilateral Agreement.
References
- Adande, G. R., & Ziurys, L. M. 2012, ApJ, 744, 194 [NASA ADS] [CrossRef] [Google Scholar]
- Audouze, J., Lequeux, J., & Vigroux, L. 1975, A&A, 43, 71 [NASA ADS] [Google Scholar]
- Bizzocchi, L., Caselli, P., Leonardo, E., & Dore, L. 2013, A&A, 555, A109 [NASA ADS] [CrossRef] [EDP Sciences] [Google Scholar]
- Bockelée-Morvan, D., Calmonte, U., Charnley, S., et al. 2015, Space Sci. Rev., 197, 47 [NASA ADS] [CrossRef] [Google Scholar]
- Boger, G. I., & Sternberg, A. 2005, ApJ, 632, 302 [NASA ADS] [CrossRef] [Google Scholar]
- Bonal, L., Huss, G. R., Krot, A. N., et al. 2010, Geochim. Cosmochim. Acta, 74, 6590 [NASA ADS] [CrossRef] [Google Scholar]
- Bottinelli, S., Boogert, A. C. A., Bouwman, J., et al. 2010, ApJ, 718, 1100 [NASA ADS] [CrossRef] [Google Scholar]
- Ceccarelli, C., Caselli, P., Bockelée-Morvan, D., et al. 2014, Protostars and Planets VI, 859 [Google Scholar]
- Charnley, S. B., & Rodgers, S. D. 2002, ApJ, 569, L133 [NASA ADS] [CrossRef] [Google Scholar]
- Cleeves, L. I., Bergin, E. A., Alexander, C. M. O., et al. 2014, Science, 345, 1590 [NASA ADS] [CrossRef] [Google Scholar]
- Daniel, F., Gérin, M., Roueff, E., et al. 2013, A&A, 560, A3 [NASA ADS] [CrossRef] [EDP Sciences] [Google Scholar]
- Daniel, F., Faure, A., Pagani, L., et al. 2016, A&A, 592, A45 [NASA ADS] [CrossRef] [EDP Sciences] [Google Scholar]
- Fedoseev, G., Ioppolo, S., Zhao, D., Lamberts, T., & Linnartz, H. 2015, MNRAS, 446, 439 [NASA ADS] [CrossRef] [Google Scholar]
- Füri, E., & Marty, B. 2015, Nature Geosc., 8, 515 [CrossRef] [Google Scholar]
- Glück, C. B., Stutzki, J., Röllig, M., Chambers, E., & Risacher, C. 2017, A&A, 600, A94 [NASA ADS] [CrossRef] [EDP Sciences] [Google Scholar]
- Guilloteau, S., Di Folco, E., Dutrey, A., et al. 2013, A&A, 549, A92 [NASA ADS] [CrossRef] [EDP Sciences] [Google Scholar]
- Guilloteau, S., Reboussin, L., Dutrey, A., et al. 2016, A&A, 592, A124 [NASA ADS] [CrossRef] [EDP Sciences] [Google Scholar]
- Guzmán, V. V., Öberg, K. I., Loomis, R., & Qi, C. 2015, ApJ, 814, 53 [NASA ADS] [CrossRef] [Google Scholar]
- Guzmán, V. V., Öberg, K. I., Huang, J., Loomis, R., & Qi, C. 2017, ApJ, 836, 30 [NASA ADS] [CrossRef] [Google Scholar]
- Heays, A. N., Visser, R., Gredel, R., et al. 2014, A&A, 562, A61 [NASA ADS] [CrossRef] [EDP Sciences] [Google Scholar]
- Henning, T., & Semenov, D. 2013, Chem. Rev., 113, 9016 [Google Scholar]
- Hily-Blant, P., Bonal, L., Faure, A., & Quirico, E. 2013a, Icarus, 223, 582 [Google Scholar]
- Hily-Blant, P., Pineau des Forêts, G., Faure, A., Le Gal, R., & Padovani, M. 2013b, A&A, 557, A65 [NASA ADS] [CrossRef] [EDP Sciences] [Google Scholar]
- Jehin, E., Manfroid, J., Hutsemékers, D., Arpigny, C., & Zucconi, J.-M. 2009, Earth Moon and Planets, 105, 167 [CrossRef] [Google Scholar]
- Kastner, J. H., Hily-Blant, P., Rodriguez, D. R., Punzi, K., & Forveille, T. 2014, ApJ, 793, 55 [NASA ADS] [CrossRef] [Google Scholar]
- Kastner, J. H., Qi, C., Gorti, U., et al. 2015, ApJ, 806, 75 [NASA ADS] [CrossRef] [Google Scholar]
- Le Gal, R., Hily-Blant, P., Faure, A., et al. 2014, A&A, 562, A83 [NASA ADS] [CrossRef] [EDP Sciences] [Google Scholar]
- Lis, D. C., Wootten, A., Gerin, M., & Roueff, E. 2010, ApJ, 710, L49 [NASA ADS] [CrossRef] [Google Scholar]
- Lucas, R., & Liszt, H. 1998, A&A, 337, 246 [NASA ADS] [Google Scholar]
- Martínez-Barbosa, C. A., Brown, A. G. A., & Portegies Zwart, S. 2015, MNRAS, 446, 823 [NASA ADS] [CrossRef] [Google Scholar]
- Matteucci, F. 2012, Chemical Evolution of Galaxies (Springer-Verlag) [Google Scholar]
- Milam, S. N., Savage, C., Brewster, M. A., Ziurys, L. M., & Wyckoff, S. 2005, ApJ, 634, 1126 [NASA ADS] [CrossRef] [Google Scholar]
- Minchev, I., Chiappini, C., & Martig, M. 2013, A&A, 558, A9 [NASA ADS] [CrossRef] [EDP Sciences] [Google Scholar]
- Müller, H. S. P., Thorwirth, S., Roth, D. A., & Winnewisser, G. 2001, A&A, 370, L49 [NASA ADS] [CrossRef] [EDP Sciences] [Google Scholar]
- Müller, H. S. P., Schlöder, F., Stutzki, J., & Winnewisser, G. 2005, J. Molec. Struct., 742, 215 [CrossRef] [Google Scholar]
- Mumma, M. J., & Charnley, S. B. 2011, ARA&A, 49, 471 [NASA ADS] [CrossRef] [Google Scholar]
- Nieva, M.-F., & Przybilla, N. 2012, A&A, 539, A143 [NASA ADS] [CrossRef] [EDP Sciences] [Google Scholar]
- Nomura, H., Tsukagoshi, T., Kawabe, R., et al. 2016, ApJ, 819, L7 [NASA ADS] [CrossRef] [Google Scholar]
- Punzi, K. M., Hily-Blant, P., Kastner, J. H., Sacco, G. G., & Forveille, T. 2015, ApJ, 805, 147 [NASA ADS] [CrossRef] [Google Scholar]
- Qi, C., Öberg, K. I., Wilner, D. J., et al. 2013, Science, 341, 630 [NASA ADS] [CrossRef] [PubMed] [Google Scholar]
- Ritchey, A. M., Federman, S. R., & Lambert, D. L. 2015, ApJ, 804, L3 [NASA ADS] [CrossRef] [Google Scholar]
- Romano, D., & Matteucci, F. 2003, MNRAS, 342, 185 [NASA ADS] [CrossRef] [Google Scholar]
- Roueff, E., Loison, J. C., & Hickson, K. M. 2015, A&A, 576, A99 [NASA ADS] [CrossRef] [EDP Sciences] [Google Scholar]
- Rubin, M., Altwegg, K., Balsiger, H., et al. 2015, Science, 348, 232 [NASA ADS] [CrossRef] [Google Scholar]
- Schwarz, K. R., & Bergin, E. A. 2014, ApJ, 797, 113 [NASA ADS] [CrossRef] [Google Scholar]
- Shinnaka, Y., Kawakita, H., Jehin, E., et al. 2016, MNRAS, 462, S195 [CrossRef] [Google Scholar]
- Sofia, U. J., & Meyer, D. M. 2001, ApJ, 554, L221 [NASA ADS] [CrossRef] [Google Scholar]
- Teague, R., Guilloteau, S., Semenov, D., et al. 2016, A&A, 592, A49 [NASA ADS] [CrossRef] [EDP Sciences] [Google Scholar]
- Terzieva, R., & Herbst, E. 2000, MNRAS, 317, 563 [NASA ADS] [CrossRef] [Google Scholar]
- van der Tak, F. F. S., Black, J. H., Schöier, F. L., Jansen, D. J., & van Dishoeck, E. F. 2007, A&A, 468, 627 [NASA ADS] [CrossRef] [EDP Sciences] [Google Scholar]
Appendix A: Supplementary materials
Spectroscopic properties and relative intensities (R.I.) of the hyperfine CN and C15N (NJF → N′J′F′) transitions.
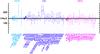 |
Fig. A.1 Compilation of all isotopic ratios in comets. The observed carrier is indicated above each measurement. Although it is clear that NH2 is a photodissociation product of ammonia in the coma, the origin of CN is less certain. Data were taken from Jehin et al. (2009) and Bockelée-Morvan et al. (2015). The weighted average ratio is 144(3). For each carrier, the average ratios for Jupiter Family Comets (JFC) and Oort Cloud Comets (OCC), are indicated, where the distinction between JFC and OCC was based only on the periodicity of the comets being respectively lower and higher than 200 yr (Shinnaka et al. 2016). |
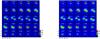 |
Fig. A.2 Channel maps (in Jy/beam) of the optically thin hyperfine lines of CN at 340.020 GHz (left) and 340.265 GHz (right). The LSR velocity is indicated (in km s-1) in each panel. Offsets are in arcsec, with respect to the phase center. The half-power beamwidth is 0.89″ × 0.53″. |
Appendix B: uv-plane analysis
The integrated visibilities of CN and C15N were fitted with two-dimensional Gaussian while applying a cutoff radius (equivalent to smoothing in the direct plane), from 60 to 120 m. In particular, with cutoffs smaller than 100 m, the central hole is smeared out and the Gaussian-disk model is mechanically appropriate. The fitting was performed using the UV_FIT task of the Gildas/Mapping software. The 6 free parameters of the CN fit are the center, major and minor axis, the position angle of the Gaussian disk, and the total flux. The geometrical parameters of the CN disk are applied to the C15N visibilities thus leaving the flux as the only one free parameter. The results depend very marginally on the cutoff radius, although the residuals of the CN fits obviously show an increasing contribution from the central hole as the spatial resolution improves. The results of the fitting procedure for a cutoff uv radius of 60 m are shown in Fig. C.2 and summarized in Table 1.
To validate the procedure, we also performed a Gaussian fit to the C15N visibilities while letting all parameters as free, leading to geometrical parameters which agree with the CN fit to within 1σ or less (see Table 1). To estimate the contribution of the geometrical assumptions to the final uncertainties of the fluxes and flux ratio, we performed a series of uv minimizations, in which the same (either elliptical or circular) Gaussian shape was imposed to both CN and C15N, with the center and size parameters randomly and independently chosen within 2σ around the previous CN fit result. The resulting fluxes and flux ratios vary by typically 0.1σ, showing that the uncertainty is dominated by the 10% statistical fluctuations of the C15N visibilities.
Of the above assumptions, the co-spatial distribution of CN and C15N is likely the most difficult to firmly assess, as it ideally rests on self-consistent physico-chemical models of disks, in a time-dependent fashion to properly take into account the complex interplay between physical and chemical processes acting on comparable timescales. Moreover, radiative transfer effects can lead to different distribution-to-emission relation even for co-spatial species. However, having optically thin lines in hand greatly alleviates such issues. Still, even if the main production and destructionpathways of isotopologues are the same, specific reactions may proceed at different rates, giving rise to fractionation. The co-spatial assumption is therefore species- and environment-dependent. In the case of CN in TW Hya, the potential fractionation processes are chemical reactions and selective photodissociation. Chemical fractionation is most likely negligible for CN, because of inefficient fractionation reactions (Roueff et al. 2015) and/or because freeze-out is damping out gas-phase processes (Heays et al. 2014). Selective photodissociation could be a radially variable process, since it is driven by UV photons while being expectedly sensitive to the dust size distribution, two properties which depend on the distance to the central protostar and height above the midplane. The outcome of both effects is far from straightforward, and could even cancel each other, with for example dust growth at large radii compensating for geometrical dilution of the UV photons from the central protostar (if dominating the UV flux). We note that the maps in Fig. 2 suggest that the C15N integrated intensity is shifted Nort-West with respect to the CN map. However, we stress that these maps require deconvolving the visibilities which always introduces artifacts, especially when the S/N is not high, as is the case for C15N, and no strong effort (apart from using robust weighting) was made to try and improve its deconvolution. Indeed, the C15N map was not used in this work.
Appendix C: Excitation of CN and C15N
One key feature of our derivation of the CN/C15N abundance ratio is the detection, with high S/N, of the two weakest hyperfine transitions of CN, at 340.262 and 340.265 GHz, thus providing direct access to its total column density with no requirement for radiative transfer calculations. Being able to measure the CN/C15N abundance ratio directly from the main isotopologue also improves significantly over previous observations in prestellar cores using the C13N/C15N double isotopic ratio (Hily-Blant et al. 2013b).
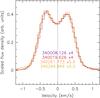 |
Fig. C.1 Disk-averaged four weakest hf transitions of CN(3-2) (see Table A.1) are superimposed after being scaled by their theoretical relative intensities. |
We estimated the optical depth of the hf components of the CN rotational transitions by extracting deconvolved CN spectra at different locations accross the disk (see Fig. C.3). In what follows, the hf lines of the fine structure group at rest frequencies around 340.3 GHz are labelled as a, while b refers to those around 340.0 GHz (see Table A.1). At each position, each group of hf lines was fitted simultaneously, using the HFS fitting procedure (Hily-Blant et al. 2013a) of the Gildas/Class software. In doing so, the fluxes were brought into the specific-intensity scale by applying a 44 mJy/K conversion factor. The fitting algorithm assumes that the excitation temperature is equal for all hf lines within each group (see below). The results are shown in Fig. C.3. Towards the central parts of the disk, where Keplerian smearing increases, the minimization becomes poorer than towards the external parts where the lines are very well fitted. Fitting each fine structure set of lines provides a consistency check of the results.
The derived total opacity is ≈ 3.4 − 5.4 for groups a and b lines, confirming previous studies (Kastner et al. 2014). The weakest hf CN lines, in group a, which carry 2.7% of the total intensity (see Table 1), is thus less than 0.15, well into the optically thin regime. Figure C.1 shows a comparison of the disk-averaged spectra of the four weakest hf transitions of CN scaled by their relative intensities. The very good match of the spectral profiles indicates that they are all optically thin, as no opacity broadening can be noticed although the relative intensities vary from 2.7 to 5.4%. The detected C15N hf lines can safely be assumed optically thin. This is further supported by the observed relative strengths of these two hf lines (see Fig. 1).
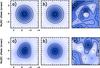 |
Fig. C.2 Results of the uv-plane analysis (see the text for details) for C14N (top) and C15N (bottom). On each row, panels a) an b) show the dirty image and the fitted Gaussian disk (Jy/beam), and panel c) shows the residuals (in mJy/beam). For C14N, contours in panels a) and b) are 0.1 to 0.7 by 0.1 Jy/beam, and for C15N from 0.02 to 0.07 by 0.01 Jy/beam. Values of local extrema are indicated in the residuals. The C15N fit assumes the Gaussian disk from C14N. The results are summarized in Table 1. |
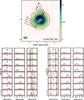 |
Fig. C.3 Spectra of the hf lines of CN (a group, left, b group right) at different locations in the disk (top panel; integrated emission, in Jy/beam). Fits and their residuals to hyperfine structure (see Appendix C for details) are shown for each hf transition (green and red, resp.). Only reduced velocity intervals centered on the hf lines are shown. |
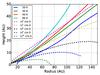 |
Fig. C.4 Locus of constant kinetic temperature (in K) and total number density (in cm-3) from the physical TW Hya model of (Qi et al. 2013). |
For optically thin lines, going from line intensity ratios to abundance ratios only requires the spectroscopic properties and excitation of each line to be taken into account, based on the usual relation between the total column density and the integrated opacity: 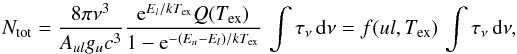 (C.1)where Tex is the excitation temperature of the u → l hyperfine transition characterized by its Einstein coefficient Aul and upper level degeneracy gu (see Table A.1). The partition function Q is also a function of the excitation temperature, and is calculated through a linear interpolation accross the tabulated values from the CDMS catalogue (Müller et al. 2001). Accordingly, the CN/C15N column density ratio is proportional to the ratio of the integrated opacity scaled by a species-dependent prefactor f(ul,Tex) which depends upon the excitation temperature of each transition. In the following, we demonstrate that a single excitation temperature can be adopted for both sets of optically thin hyperfine lines of CN and C15N. We also estimated the uncertainty associated to this assumption.
On general terms, the excitation state of each molecule results from the competition between radiative and collisional processes, which may vary significantly within the disk as the density and kinetic temperature depend on the radius R and height Z above the midplane (see Fig. C.4). However, it must be emphasized that our measurement of the isotopic ratio does not require absolute determinations of the column densities of each isotopologue. Instead, it is important to guarantee that the single excitation temperature assumption holds.
We examined in more details the assumption that all hf lines are characterized by a single excitation temperature. This is supported by the relatively small total opacity of each group of hf lines. Moreover, the excitation temperature of the CN rotational transition, as obtained from the HFS fits, are 17–27 K for both fine structure groups (see Table C.1). In our analysis, spectra labelled 4 and 5 in Fig. C.3, for which the fits are the poorest because the main hf transitions overlap, have the highest opacities (total τ of 6.1). At any given location, the opacity of each group are consistent to better than 15%. The excitation temperatures are also in very good agreement with the 25 K value of the CN(2-1) lines at 100 AU (Teague et al. 2016). This provides is a very strong indication that the CN(2−1) and (3−2) lines are thermalized, or very close to be so. The derived excitation temperatures are higher than in our single-dish study, confirming the suggestion that the beam dilution was not properly taken into account (Guilloteau et al. 2016). The corresponding total CN column density is ≈ 1014 cm-2, although we stress that a robust determination of the CN column density should await for a self-consistent modelling of the CN(2−1) and CN(3−2) lines observed with ALMA.
The single excitation temperature assumption is further substantiated by the FWHM of the CN lines which indicate that the emission originates from regions with high density. At any location, the FWHM measured through Gaussian fitting to each hf component, is due to the combined effects of Keplerian motion and non-thermal (e.g. turbulence) plus thermal broadenings, and therefore provides an upper limit on the kinetic temperature through σv = FWHM/ 2.35 ≥ (2kTk/μ)1 / 2, with μ = 26 amu for the CN molecule. The maps of the FWHM of the group a hf transitions (see Table A.1) are shown in Fig. C.5. The associated upper limit on the kinetic temperature assuming purely thermal broadening are also indicated. The quoted FWHMs have not been deconvolved from the autocorrelator transfer function. The Keplerian smearing associated to the 7° disk inclination was also not subtracted, so that the upper limits on Tk are conservative ones. The FWHMs of the optically thin hf lines at 340.008 and 340.020 GHz correspond to kinetic temperature lower than 20–25 K within the CN-ring (i.e. with convolved radii ≲ 90 AU, see Fig. 3). These upper limits further decrease at larger radii, reaching Tk ≤ 15 K beyond 120 AU.
Based on a model of the physical structure of the TW Hya disk (Qi et al. 2013), the 20–25 K upper limit corresponds to a lower limit on the density of a few 107 cm-3 for radii comprised in the range 60 to 120 AU. The non-equilibrium statistical populations of the CN and C15N hyperfine levels were calculated under the escape probability formalism using the RADEX code (van der Tak et al. 2007) and collision rates coefficients, for CN and C15N, at the hyperfine level (Hily-Blant et al. 2013b). At several radii from 60 to 120 AU, level populations were computed as a function of height above the disk midplane for physical conditions appropriate to the TW Hya disk. Figure C.6 shows the results at R = 60 and 85 AU, which correspond to upper limits on Tk of ≈25 and 20 K respectively. At each density and kinetic temperature, a range of CN column densities from 1012 to 1015 cm-2 was explored while that of C15N was a factor 300 or 441 lower. The value of the isotopic ratio was not found to change the following results. At heights such that Tk< 20 − 25 K, the excitation temperature of the 340.020 CN line and the 329.837 C15N line are equal to better than 3%. At higher kinetic temperatures, the density decreases and both transitions start to deviate from thermalization, although very moderately. The present excitation study includes locations well within the CN ring (Fig. 3), and is thus representative of the excitation of the bulk of the CN emission. In addition to provide strong support to the single excitation temperature assumption, our analysis suggests that the CN emission does not originate in the upper, warm, layer. Yet, 2D radiative transfer calculations are required to demonstrate this claim.
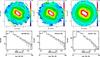 |
Fig. C.5 Maps (top) and histograms (bottom) of the raw FWHM (in km s-1) of three CN hf lines obtained from Gaussian fits to each spectrum. Only spectra with an area S/N larger than seven were kept. The contours (top panels) show the locus of constant kinetic temperature (15, 20, 25 K) adopting FWHM/2.35 = (2kTk/μ)1 / 2. The distance to the source is 59.5 pc and the effective velocity resolution is 107 m/s. |
At each radius and height with Tk< 20 K, the prefactors in Eq. (C.1) were finally computed, leading to a prefactor ratio of  (C.2)The uncertainty in Eq. (1), including all aforementioned contributions, is finally dominated by the statistical uncertainties on the C15N visibilities:
 ![Mathematical equation: \appendix \setcounter{section}{3} \begin{equation} \frac{\delta R}{R} = \left[ \left(\frac{\delta (f_{14}/f_{15})}{f_{14}/f{_{15}}}\right)^2 + \left(\frac{\delta S_{14}}{S_{14}}\right)^2 + \left(\frac{\delta S_{15}}{S_{15}}\right)^2 \right]^{1/2} = 10\%. \end{equation}](/articles/aa/full_html/2017/07/aa30524-17/aa30524-17-eq96.png) (C.3)
(C.3)
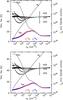 |
Fig. C.6 Physical structure and excitation temperatures of CN(ν = 340.265 GHz) and C15N, within the CN-ring, at radii of R = 60 (top) and 85 AU (bottom). The total proton number density and kinetic temperature profiles are taken from (Qi et al. 2013). The corresponding cumulative column density, increasing towards the midplane, is also shown (right scale). The excitation temperatures Tex of the CN and C15N hyperfine components (star triangles and open circles, resp.) considered in our uv-plane analysis (see Sects. A.2 and A.3) were obtained in the escape probability formalism using the RADEX code (van der Tak et al. 2007), and adopting a FWHM of 0.25 km s-1. For each density and temperature, a range of CN total column densities were adopted, from 1012 to 1015 cm-2, with C15N being 300 times less abundant. Also shown is the CN/C15N isotopic ratio (open triangles, inset scale) obtained by use of Eq. (C.1) when adopting the CN and C15N excitation temperatures from the non-LTE calculations. |
Appendix D: Fractionation in cores and disks
Here, we examine further the possibility that the consistency between the isotopic ratio in CN in TW Hya on the one hand, and in ammonia and dyazenilium in prestellar cores on the other hand, represent the elemental ratio rather than the result of fractionation processes. Since the elemental ratio is the same in these objects, the potential fractionation processes would have to be equally efficient although under significantly different disk- and core-like physical conditions. Indeed, disks have much larger density and are exposed to higher UV fields compared to prestellar cores, which are exposed to a higher flux of ionizing cosmic-rays than disks (Henning & Semenov 2013; Cleeves et al. 2014). Hence, fractionation processes in disks and cores, if efficient, are likely of a different nature, respectively selective photodissociation or chemical mass fractionation.
Chemical fractionation through gas-phase reactions is a temperature-driven process, and for nitrogen, it is expected to become efficient at temperatures significantly lower than 30 K (Terzieva & Herbst 2000). At large density (> 107 cm-3), for example, close to the disk midplane where considerable freeze-out of gas-phase species takes place, species-dependent depletion may strongly enhance fractionation (Charnley & Rodgers 2002), although the resulting amount of ammonia in ices is outrageously large with respect to observations of interstellar ices (Bottinelli et al. 2010) and even comets (Mumma & Charnley 2011). At the lower densities typical of prestellar cores (~ 104 cm-3), the fractionation level may reach 25% on short timescales, and ~ 10% at steady-state (Terzieva & Herbst 2000; Hily-Blant et al. 2013b; Roueff et al. 2015). Regardless the discrepancies between chemical model predictions in prestellar cores, ammonia and dyazenilium are consistently found to be marginally affected by fractionation. Selective photodissociation is also negligible in such environments where the amount of internally-generated UV photons is not sufficient to promote N2 over N15N (Heays et al. 2014). Altogether, this strongly suggests that NH3 and N2H+ species are tracing the elemental ratio. Nevertheless, measuring their isotopic ratios is not as direct as for CN in TW Hya, because radiative transfer effects can not be neglected and spatial information, which is critical to disentangle between line excitation and abundance gradients, is usually
lacking due to the intrinsic weakness of the 15N isotopologues (Bizzocchi et al. 2013). On the other hand, the total column density of ammonia often relies on assumptions regarding its ortho-to-para ratio (Lis et al. 2010).
In contrast, models of UV-irradiated disks predict significant enrichment of CN and HCN in 15N, at heights of 20 to 40 AU above the midplane at R = 105 AU, with CN/C15N column density ratio reaching 250 relative to an elemental ratio of 441 (Heays et al. 2014). A simple scaling indicates that the ℛCN = 323 in TW Hya would require an elemental ratio of ℛ0 = 575. However, such a high elemental ratio would disagree with GCE models which predict an enrichment in 15N with time, hence a present-day elemental ratio lower than ℛ⊙ = 441 (or lower than ≈ 500 in the outward Sun migration hypothesis). This high value of ℛ0 would also require gas-phase NH3 and N2H+ to be significantly (~ 65 − 95%) fractionated in prestellar cores envelopes, at odds with model predictions (Terzieva & Herbst 2000; Hily-Blant et al. 2013b; Roueff et al. 2015). Last, such a high elemental ratio would also imply that CN and HCN are also strongly enriched in 15N in diffuse molecular clouds, in which the ratios in these species are as low as 250 (see Table D.1), while the same model predicts instead a depletion of ≈ 10% at most at visual exctinction below 2 mag.
It appears more likely that the efficiency of N2 selective photodissociation has been overestimated in disk models. Indeed, we note that these models predict CN and HCN column density ratios of 250 and 90 respectively, which are a factor of 1.3–1.4 smaller than the ratios observed in TW Hya and MWC 480. Yet, selective photodissociation is primarily sensitive to UV propagation and hence to the radial and vertical profiles of density and dust size distribution and, probably to a lesser extent, to the kinetic temperature and the ionization fraction of the gas. To explain the observed CN and HCN ratios with these models and ℛ0 = 441 would thus require to reduce the efficiency of selective photodissocation by ≈ 30%. However, this would, in turn, imply that ammonia (ℛ = 321) is significantly enriched in 15N in prestellar cores (40%), a possibility that models of fractionation in prestellar cores consistently rule out. It appears that contradicting consequences are obtained when assuming that the isotopic ratio observed in disks and cores derive from a present-day elemental ratio of 441, even when allowing for uncertainties on disk and prestellar core fractionation models. Nevertheless, a definitive proof that selective photodissociation has been overestimated in published disk models requires thorough exploration of the wide parameter-space of models selective photodissociation in disks is timeley, with particular attention drawn on the impact of the dust size distribution and mass of the central protostar.
Direct measurements of the 14N/15N isotopic ratio in the local ISM (at a distance d to the Sun), derived from direct X14N/X15N abundance ratios using various molecular carriers and techniques.
All Tables
Results of the uv-plane analysis (see the text for details) using visibilities within a uv radius of 60 m.
Spectroscopic properties and relative intensities (R.I.) of the hyperfine CN and C15N (NJF → N′J′F′) transitions.
Direct measurements of the 14N/15N isotopic ratio in the local ISM (at a distance d to the Sun), derived from direct X14N/X15N abundance ratios using various molecular carriers and techniques.
All Figures
|
Fig. 1 Spectra, averaged within the dashed circle in Fig. 2, of the entire C14N a) and of the two sets of hyperfine lines of C15N b) and c). The hyperfine splitting and relative strengths of the hf components are indicated below the spectra. |
| In the text | |
|
Fig. 2 Integrated intensity maps towards TW Hya with ALMA. a) C14N emission summed over the four weakest hyperfine components. b) C15N from 329835.5 to 329838.5 MHz, with spatial resolution degraded to 2.3′′. The phase center is at 11h01m51.875s, − 34°42′17.16′′ (J2000). |
| In the text | |
|
Fig. 3 Azimuthally averaged radial profiles of the integrated flux for the 7 hyperfine (hf) components of C14N, four of which are optically thin, the remaining three being optically thick (Fig. 2). The average of the 7 hf components is shown in red. The black line shows the result of a sharp inner-ring model plus Gaussian decrease outwards, convolved by the synthesized beam. The unconvolved ring has a radius of 0.7′′ or 42 AU, and a full-width at half-maximum of 54 AU (at a distance of 59.5 ± 0.9 pc). |
| In the text | |
|
Fig. 4 Present-day nitrogen isotopic ratio in the solar neighbourhood compared to Galactic Chemical Evolution models predictions. Shaded areas: ALMA measurements of the CN/C15N and HCN/HC15N ratios in TW Hya and MWC 480 respectively. Symbols: directly measured ratios (i.e. not using double-isotopic ratios) in the present-day solar neighbourhood at rG = 8.5(10) kpc (references are provided in Table D.1). Black curves: GCE model predictions Romano & Matteucci (2003) scaled to a PSN ratio of ℛ⊙ = 441, with 15N as a primary (full line, their model 2) or secondary product (dashed lines, their models 3s an 3n). Blue curve: GCE model 2 including a 2 kpc outward Sun migration (see the text for details). The weighted average isotopic ratios in comets of 144(3) (see also Fig. A.1) and of 111(19), from H13CN/HC15N observations in 5 disks (Guzmán et al. 2017), are also indicated. |
| In the text | |
|
Fig. A.1 Compilation of all isotopic ratios in comets. The observed carrier is indicated above each measurement. Although it is clear that NH2 is a photodissociation product of ammonia in the coma, the origin of CN is less certain. Data were taken from Jehin et al. (2009) and Bockelée-Morvan et al. (2015). The weighted average ratio is 144(3). For each carrier, the average ratios for Jupiter Family Comets (JFC) and Oort Cloud Comets (OCC), are indicated, where the distinction between JFC and OCC was based only on the periodicity of the comets being respectively lower and higher than 200 yr (Shinnaka et al. 2016). |
| In the text | |
|
Fig. A.2 Channel maps (in Jy/beam) of the optically thin hyperfine lines of CN at 340.020 GHz (left) and 340.265 GHz (right). The LSR velocity is indicated (in km s-1) in each panel. Offsets are in arcsec, with respect to the phase center. The half-power beamwidth is 0.89″ × 0.53″. |
| In the text | |
|
Fig. C.1 Disk-averaged four weakest hf transitions of CN(3-2) (see Table A.1) are superimposed after being scaled by their theoretical relative intensities. |
| In the text | |
|
Fig. C.2 Results of the uv-plane analysis (see the text for details) for C14N (top) and C15N (bottom). On each row, panels a) an b) show the dirty image and the fitted Gaussian disk (Jy/beam), and panel c) shows the residuals (in mJy/beam). For C14N, contours in panels a) and b) are 0.1 to 0.7 by 0.1 Jy/beam, and for C15N from 0.02 to 0.07 by 0.01 Jy/beam. Values of local extrema are indicated in the residuals. The C15N fit assumes the Gaussian disk from C14N. The results are summarized in Table 1. |
| In the text | |
|
Fig. C.3 Spectra of the hf lines of CN (a group, left, b group right) at different locations in the disk (top panel; integrated emission, in Jy/beam). Fits and their residuals to hyperfine structure (see Appendix C for details) are shown for each hf transition (green and red, resp.). Only reduced velocity intervals centered on the hf lines are shown. |
| In the text | |
|
Fig. C.4 Locus of constant kinetic temperature (in K) and total number density (in cm-3) from the physical TW Hya model of (Qi et al. 2013). |
| In the text | |
|
Fig. C.5 Maps (top) and histograms (bottom) of the raw FWHM (in km s-1) of three CN hf lines obtained from Gaussian fits to each spectrum. Only spectra with an area S/N larger than seven were kept. The contours (top panels) show the locus of constant kinetic temperature (15, 20, 25 K) adopting FWHM/2.35 = (2kTk/μ)1 / 2. The distance to the source is 59.5 pc and the effective velocity resolution is 107 m/s. |
| In the text | |
|
Fig. C.6 Physical structure and excitation temperatures of CN(ν = 340.265 GHz) and C15N, within the CN-ring, at radii of R = 60 (top) and 85 AU (bottom). The total proton number density and kinetic temperature profiles are taken from (Qi et al. 2013). The corresponding cumulative column density, increasing towards the midplane, is also shown (right scale). The excitation temperatures Tex of the CN and C15N hyperfine components (star triangles and open circles, resp.) considered in our uv-plane analysis (see Sects. A.2 and A.3) were obtained in the escape probability formalism using the RADEX code (van der Tak et al. 2007), and adopting a FWHM of 0.25 km s-1. For each density and temperature, a range of CN total column densities were adopted, from 1012 to 1015 cm-2, with C15N being 300 times less abundant. Also shown is the CN/C15N isotopic ratio (open triangles, inset scale) obtained by use of Eq. (C.1) when adopting the CN and C15N excitation temperatures from the non-LTE calculations. |
| In the text | |
Current usage metrics show cumulative count of Article Views (full-text article views including HTML views, PDF and ePub downloads, according to the available data) and Abstracts Views on Vision4Press platform.
Data correspond to usage on the plateform after 2015. The current usage metrics is available 48-96 hours after online publication and is updated daily on week days.
Initial download of the metrics may take a while.