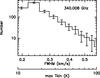
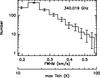
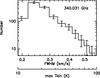
Fig. C.5
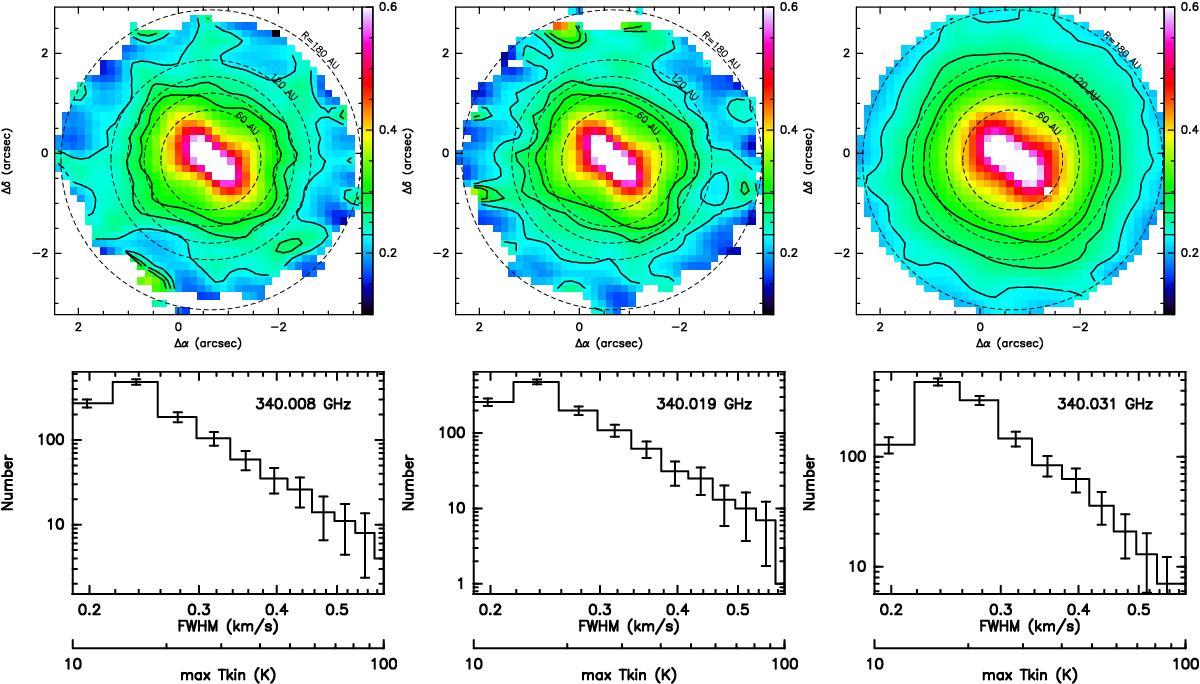
Maps (top) and histograms (bottom) of the raw FWHM (in km s-1) of three CN hf lines obtained from Gaussian fits to each spectrum. Only spectra with an area S/N larger than seven were kept. The contours (top panels) show the locus of constant kinetic temperature (15, 20, 25 K) adopting FWHM/2.35 = (2kTk/μ)1 / 2. The distance to the source is 59.5 pc and the effective velocity resolution is 107 m/s.
Current usage metrics show cumulative count of Article Views (full-text article views including HTML views, PDF and ePub downloads, according to the available data) and Abstracts Views on Vision4Press platform.
Data correspond to usage on the plateform after 2015. The current usage metrics is available 48-96 hours after online publication and is updated daily on week days.
Initial download of the metrics may take a while.