Fig. C.2
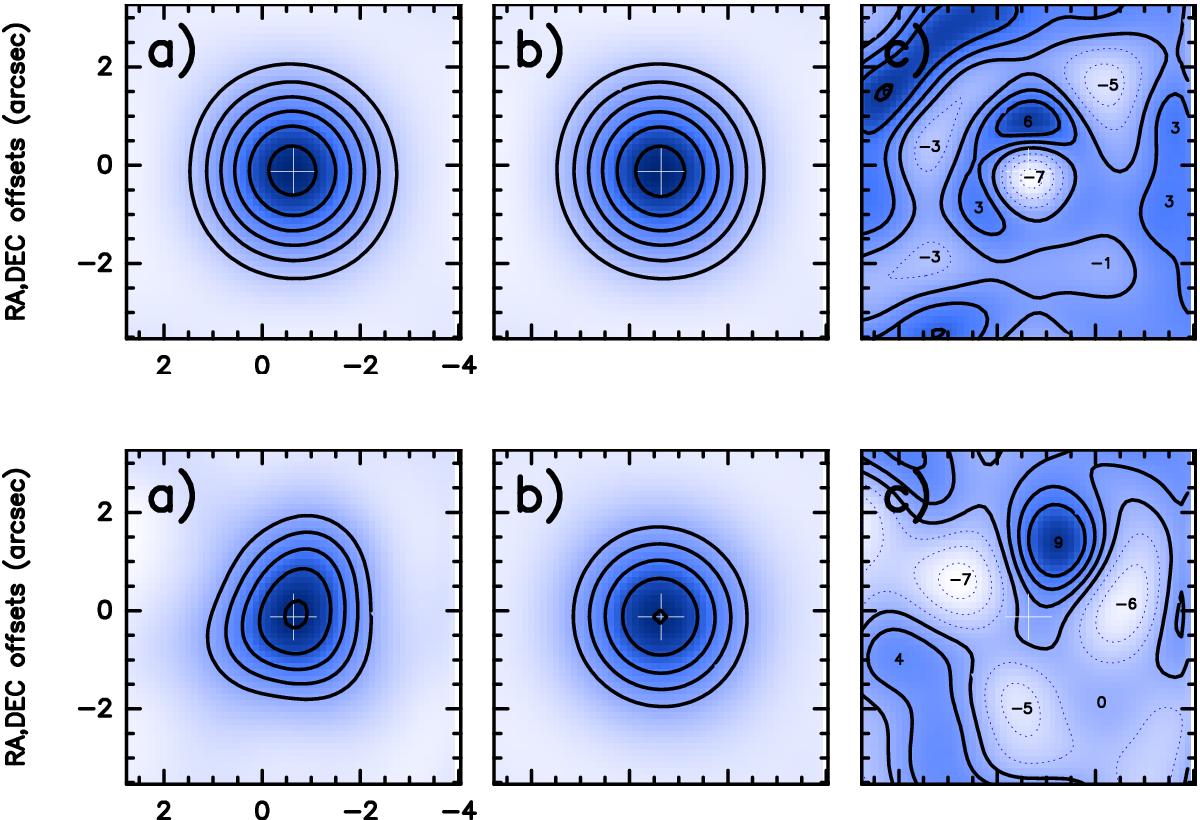
Results of the uv-plane analysis (see the text for details) for C14N (top) and C15N (bottom). On each row, panels a) an b) show the dirty image and the fitted Gaussian disk (Jy/beam), and panel c) shows the residuals (in mJy/beam). For C14N, contours in panels a) and b) are 0.1 to 0.7 by 0.1 Jy/beam, and for C15N from 0.02 to 0.07 by 0.01 Jy/beam. Values of local extrema are indicated in the residuals. The C15N fit assumes the Gaussian disk from C14N. The results are summarized in Table 1.
Current usage metrics show cumulative count of Article Views (full-text article views including HTML views, PDF and ePub downloads, according to the available data) and Abstracts Views on Vision4Press platform.
Data correspond to usage on the plateform after 2015. The current usage metrics is available 48-96 hours after online publication and is updated daily on week days.
Initial download of the metrics may take a while.