Fig. C.3
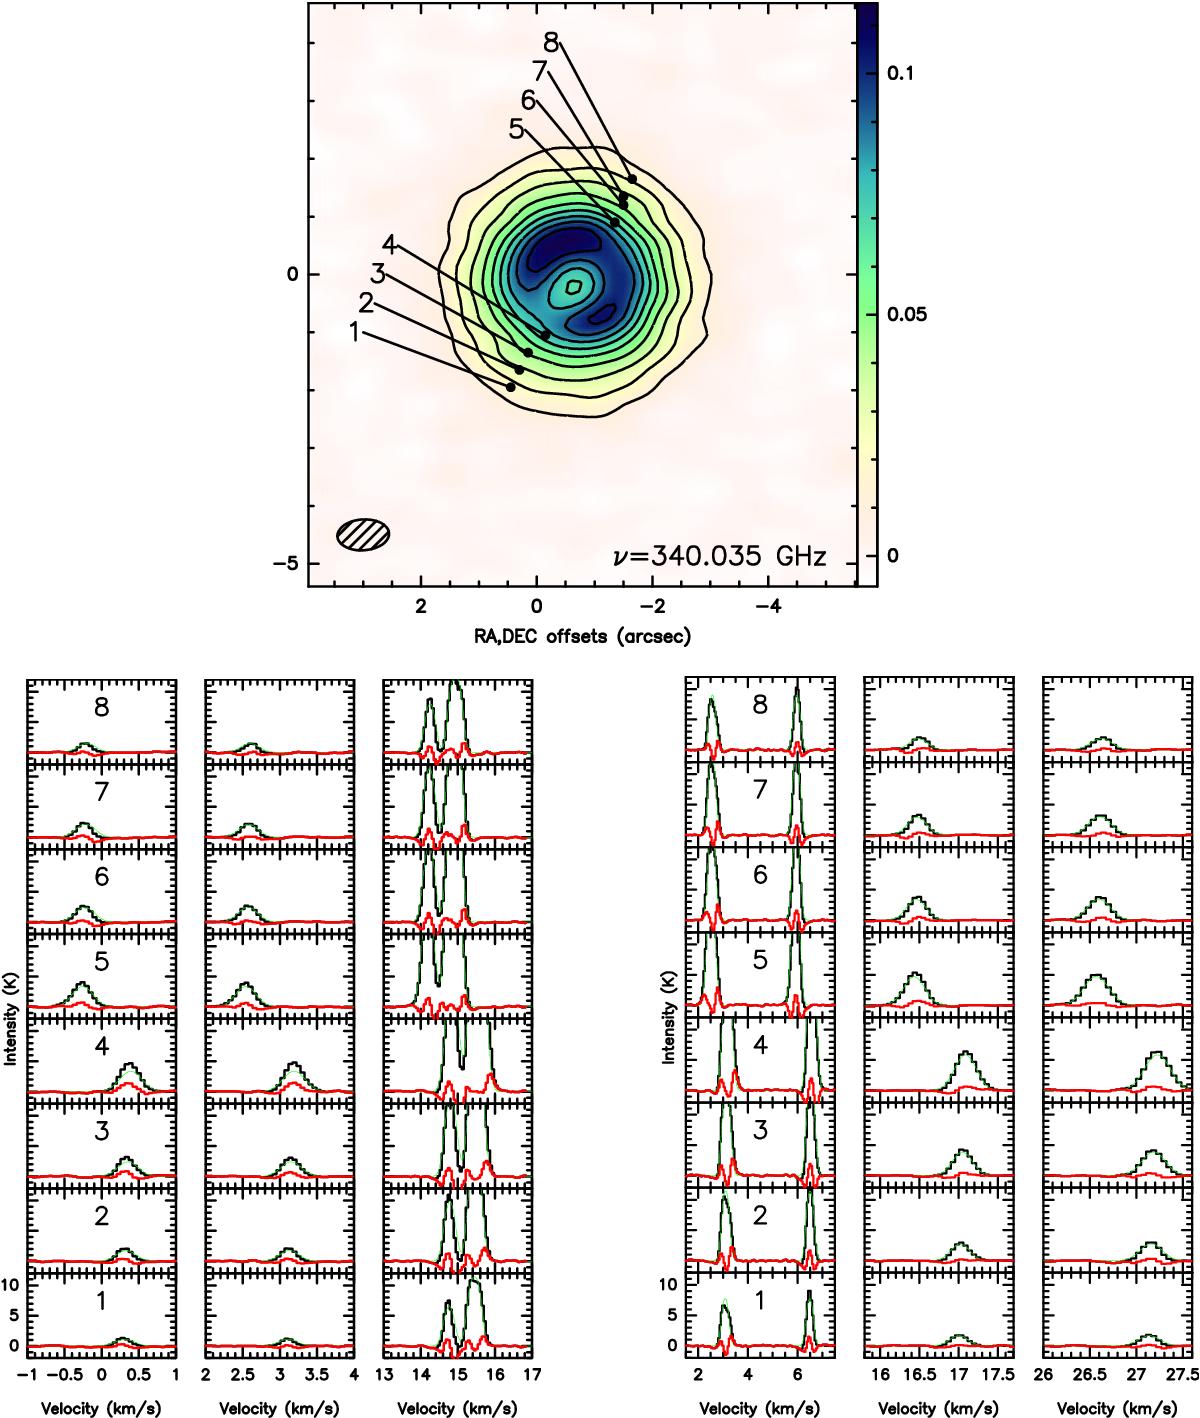
Spectra of the hf lines of CN (a group, left, b group right) at different locations in the disk (top panel; integrated emission, in Jy/beam). Fits and their residuals to hyperfine structure (see Appendix C for details) are shown for each hf transition (green and red, resp.). Only reduced velocity intervals centered on the hf lines are shown.
Current usage metrics show cumulative count of Article Views (full-text article views including HTML views, PDF and ePub downloads, according to the available data) and Abstracts Views on Vision4Press platform.
Data correspond to usage on the plateform after 2015. The current usage metrics is available 48-96 hours after online publication and is updated daily on week days.
Initial download of the metrics may take a while.