| Issue |
A&A
Volume 599, March 2017
|
|
|---|---|---|
| Article Number | A89 | |
| Number of page(s) | 7 | |
| Section | Astrophysical processes | |
| DOI | https://doi.org/10.1051/0004-6361/201629542 | |
| Published online | 06 March 2017 | |
X-ray burst-induced spectral variability in 4U 1728–34
1 Tuorla Observatory, Department of Physics and Astronomy, University of Turku, Väisäläntie 20, 21500 Piikkiö, Finland
e-mail: This email address is being protected from spambots. You need JavaScript enabled to view it.
2 European Space Astronomy Centre (ESA/ESAC), Science Operations Department, 28691 Villanueva de la Cañada, Madrid, Spain
3 European Space Research and Technology Centre (ESA/ESTEC), Keplerlaan 1, 2201 AZ Noordwijk, The Netherlands
4 Nordita, KTH Royal Institute of Technology and Stockholm University, Roslagstullsbacken 23, 10691 Stockholm, Sweden
Received: 17 August 2016
Accepted: 11 November 2016
Abstract
Aims. INTEGRAL has been monitoring the Galactic center region for more than a decade. Over this time it has detected hundreds of type-I X-ray bursts from the neutron star low-mass X-ray binary 4U 1728–34, also known as the slow burster. Our aim is to study the connection between the persistent X-ray spectra and the X-ray burst spectra in a broad spectral range.
Methods. We performed spectral modeling of the persistent emission and the X-ray burst emission of 4U 1728–34 using data from the INTEGRAL JEM-X and IBIS/ISGRI instruments.
Results. We constructed a hardness intensity diagram to track spectral state variations. In the soft state, the energy spectra are characterized by two thermal components likely coming from the accretion disc and the boundary/spreading layer, together with a weak hard X-ray tail that we detect in 4U 1728–34 for the first time in the ~40 to 80 keV range. In the hard state, the source is detected up to ~200 keV and the spectrum can be described by a thermal Comptonization model plus an additional component: either a powerlaw tail or reflection. By stacking 123 X-ray bursts in the hard state, we detect emission up to 80 keV during the X-ray bursts. We find that during the bursts the emission above 40 keV decreases by a factor of approximately three with respect to the persistent emission level.
Conclusions. Our results suggest that the enhanced X-ray burst emission changes the spectral properties of the accretion disc in the hard state. The likely cause is an X-ray burst induced cooling of the electrons in the inner hot flow near the neutron star.
Key words: X-rays: binaries / X-rays: bursts / accretion, accretion disks
© ESO, 2017
1. Introduction
Thermonuclear type-I X-ray bursts can be observed from low-mass X-ray binaries (LMXB) where a neutron star (NS) accretes gas from a low-mass companion star (see Lewin et al. 1993, for review). The X-ray bursts are triggered in the NS envelope by unstable nuclear burning of the accreted hydrogen and helium (e.g., Woosley & Taam 1976; Schatz et al. 1998). The NS is embedded in the center of the accretion disc, and it is therefore possible that the disc will be disturbed during an X-ray burst by the sudden increase of soft X-ray radiation, and perhaps also by radiatively driven winds (see below).
NS-LMXBs have two different spectral states that likely arise from two distinct geometries of the inner accretion disc near the NS (the hot flow paradigm; for review see e.g., Done et al. 2007). When the NS-LMXB is in the hard state (sometimes referred as the island state; see Hasinger & van der Klis 1989), the inner part of the accretion disc is believed to consist of a geometrically thick and optically thin hot plasma. This hot inner flow radiates by Compton up-scattering of low-energy photons emitted by the truncated, geometrically thin disc and also by the NS, producing a hard X-ray spectrum. In contrast, in the soft (“banana”) state, the hot inner flow is believed to collapse into a thin cool disc that can extend all the way down to the NS surface (e.g., Liu et al. 2007). In this case an optically thick boundary layer forms in the disc-star interface, which radiates black body-like emission almost as efficiently as the accretion disc (Sunyaev & Shakura 1986). The likely geometry of this boundary is that of a spreading layer (Inogamov & Sunyaev 1999, 2010; Suleimanov & Poutanen 2006), that explains well the spectro-temporal properties of the persistent emission in NS-LMXBs (Gilfanov et al. 2003; Revnivtsev & Gilfanov 2006; Revnivtsev et al. 2013).
The effect of X-ray bursts on the accretion disc seems to be different depending on the spectral state. In the soft state there is evidence that either the entire persistent emission level becomes enhanced by a factor of approximately ten during the bursts (Worpel et al. 2013, 2015) or, alternatively, the disc component remains unaltered and only the spreading layer component brightens (Koljonen et al. 2016; Kajava et al., in prep.). In the hard state, the burst-disc interactions can manifested themselves in different ways. The persistent spectrum can brighten in the soft X-ray band, while at the same time the emitted flux drops significantly in hard X-rays in Aql X-1 (Maccarone & Coppi 2003) and in IGR J17473–2721 (Chen et al. 2012). In the accreting millisecond pulsars SAX J1748.9–2021 and SAX J1808.4–3658, the persistent spectrum instead seems to become more intense both below 2 keV and above 30 keV (in ’t Zand et al. 1999b, 2013). Further, some sources seem to show conflicting behavior. While in ’t Zand et al. (1999a) observed an increase of hard X-ray flux above 30 keV in GS 1826-238 using BeppoSAX data during an X-ray burst, more recently, Ji et al. (2015) reported a clear hard X-ray deficit with Rossi X-ray Timing Explorer (RXTE)/PCA data. Similarly, Ji et al. (2014b) did not find evidence for a change in the hard X-rays during RXTE/PCA bursts of 4U 1608–52, while Degenaar et al. (2016) observed a hard X-ray deficit during a NuSTAR observation of an X-ray burst in the hard state.
In this paper we study the burst-disc interaction in the LMXB 4U 1728–34 using 12 yr of data collected with the INTErnational Gamma-Ray Astrophysics Laboratory (INTEGRAL; Winkler et al. 2003). In Sect. 2 we present the properties of 4U 1728–34 and the methods we used to analyze the persistent emission and the X-ray bursts. In Sect. 3 we present a detection of an X-ray deficit above 40 keV during X-ray bursts of 4U 1728–34 in the hard state, in contrast to the findings of Ji et al. (2014b) who found no evidence of a deficit using RXTE/PCA. We discuss the results in Sect. 4.
2. Observations and data analysis
2.1. 4U 1728–34
4U 1728–34, often referred to as the slow burster, is a persistent “atoll” source towards the direction of the Galactic center, at a distance of approximately 5.2 kpc (Galloway et al. 2008). The first X-ray bursts from 4U 1728–34 were detected by the SAS-3 satellite (Hoffman et al. 1976). Since then practically all X-ray observatories have observed X-ray bursts from this source.
The Galactic hydrogen column density towards 4U 1728–34 is high, NH = 2.6 × 1022 cm-2 (Worpel et al. 2013), and the source has a faint 15th Ks magnitude near-infrared counterpart (Marti et al. 1998). There are hints of an approximately 11-min periodicity that is likely due to binary orbital modulations, making 4U 1728–34 a candidate ultra-compact X-ray binary (Galloway et al. 2010). The neutron star spin frequency is measured to be approximately 363 Hz from X-ray burst oscillations (Strohmayer et al. 1996).
RXTE/PCA observations have shown that 4U 1728–34 undergoes the typical hysteresis pattern between hard and soft spectral states (e.g., Muñoz-Darias et al. 2014). In the hard state, the X-ray bursts are almost exclusively Eddington-limited photospheric radius expansion bursts (Galloway et al. 2008; Zhang et al. 2016), although the peak fluxes show a weak dependency with the properties of the persistent emission (Galloway et al. 2003).
2.2. Data selection and analysis
We have analyzed all the available archival X-ray data of 4U 1728–34 spanning from the INTEGRAL launch in 2002, until the end of 2014, thus covering 12 yr. We used data from the JEM-X instruments that are sensitive in the 3–35 keV range with an angular resolution of 3′ (Lund et al. 2003) as well as IBIS/ISGRI (sensitive in 15 keV to 10 MeV range, with 12′ angular resolution; Ubertini et al. 2003). As JEM-X1 was operational for almost 10 out of the 12 yr analyzed, we extracted spectral data from JEM-X1 and used JEM-X2 only to fill the gaps in the long-term light curve. We limited our analysis to observations where the off-axis angle between the source location and spacecraft pointing was less than 4 degrees. The selection criteria guaranteed that (1) the measured fluxes and hardness ratios were not affected by “ghosts” towards the edges of the fully coded field-of-view (FoV) of JEM-X that may contaminate the light curves and images; and (2) 4U 1728–34 was always within the fully coded FoV in IBIS/ISGRI. This allowed us to accumulate approximately 2.7 Ms of dead time corrected exposure on 4U 1728–34. The data were reduced using standard procedures with the INTEGRAL Offline Science Analysis (OSA) version 10.2, provided by the ISDC1.
The X-ray bursts were identified using 1 s binned JEM-X light curves in the 3–25 keV band. We first computed the mean and standard deviation of the source count rate within one “science window” (typically 30 min to one hour duration). When the rate exceeded 6σ of the persistent level we identified the potential onset of an X-ray burst. The burst detection was confirmed by fitting the burst decay using an exponential function, and extracting the image of the field within a time interval restricted to the burst duration so as to discard contamination to the source light curve from other sources in the FoV. The burst search resulted in a sample of 409 X-ray bursts2. 4U 1728–34 produces predominantly bright He-rich bursts that typically reach the Eddington limit (Galloway et al. 2008), and thus we have likely not missed any bursts that occurred during the analyzed science windows. The burst detection was therefore relatively straightforward given that the peak count rate during bursts was always approximately 350 cps, more than an order of magnitude above the persistent emission level. We identified the burst onset time as the first time bin that exceeded 10 per cent of the burst peak flux of the 1 s JEM-X light curves. In the subsequent analysis we also use this onset value to extract the averaged X-ray burst spectra from the JEM-X1 and IBIS/ISGRI instruments.
Because the X-ray burst peak fluxes are similar and the bursts display similar cooling time scales (particularly in the hard state, see Galloway et al. 2003; Zhang et al. 2016), we can stack the bursts together to extract a spectrum of increased signal to noise ratio (S/N) at energies above ~40 keV. An averaged burst spectrum was accumulated from the individual burst spectra, each integrated over a 9 s time interval (1–10 s from the burst onset). This integration time was selected to ensure that we exclude the burst rise and cover the burst peak, allowing enough counts to be collected to perform JEM-X and ISGRI spectral extraction. The stacked JEM-X1 and IBIS/ISGRI X-ray burst light curves and the spectral extraction interval are shown in Fig. 1 for the bursts that occurred in the hard state.
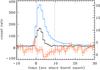 |
Fig. 1 Average X-ray burst light curve of 4U 1728–34 in the hard state observed by JEM-X1 (blue) in the 3–25 keV band and IBIS/ISGRI (20–40 keV in black and 40–50 keV in orange; right axis). The band between two vertical gray lines indicates the time range where the average X-ray burst spectrum was extracted. |
To characterize the persistent emission, we extracted the source light curve in the 3–8 and 8–25 keV bands, using time units of one science window. To determine the source spectral state classification, we computed the hardness ratios between these two bands. To avoid burst contribution to the light curve, we always excluded a 300 s interval around the X-ray burst in those science windows where a burst was detected. In addition, we discarded five observations where the persistent 3–25 keV flux was below 5 mCrab. This was done to ensure that 4U 1728–34 was significantly detected in both 3–8 and 8–25 keV bands.
3. 12 yr of INTEGRAL observations of 4U 1728–34
3.1. Long-term behavior of the persistent emission
During the 12 yr of INTEGRAL observations, the persistent (accretion) emission level of 4U 1728–34 clearly changed (see Fig. 2). In the first 6 yr, from 2003 through 2008, the 3–25 keV persistent emission varied from a few mCrab up to 40 mCrab on time-scales of weeks. In contrast, from 2009 up until 2013, the persistent level was consistently approximately 10 mCrab, with only modest fluctuations in spectral hardness. Only during the visibility season of autumn 2014, did 4U 1728–34 start to exhibit significantly higher persistent fluxes again.
To characterize the persistent emission, we computed a hardness-intensity diagram (HID) that is shown in Fig. 3. The hardness is defined as the ratio between 8–25 keV and 3–8 keV fluxes, such that hardness of unity corresponds to a Crab-like spectrum. The total flux is computed in the 3–25 keV band. The HID is somewhat similar to Falanga et al. (2006, Fig. 3), who analyzed the X-ray bursts and persistent emission during 2003 and 2004. With 12 yr of data, we have now accumulated an order of magnitude more data to study the spectral properties of 4U 1728–34 up to higher energies.
We divided the observations into four groups based on the HID. Groups 1, 2 and 3 represent the high-, intermediate- and low-flux soft states (SS1, SS2, and SS3 hereafter); and group 4 corresponds to the hard state HS (“island state”). The SS1 group has 3–25 keV fluxes above 25 mCrab, in the SS2 group the flux is in the 15–25 mCrab range and the SS3 group has fluxes below 15 mCrab. The HS and SS3 are easily distinguished using the simultaneous 25–40 keV band ISGRI flux measurement. The ISGRI count rate histogram has a peak centered around zero (where the SS1 and SS2 observations are located), and another one around 10 cps. We therefore define the HS bursts as those where the ISGRI persistent count rate is higher than 5 cps, and SS3 where the rate is less than 3 cps. The bursts where the ISGRI count rate was 3–5 cps are considered ambiguous, and are not included in either group (they are shown with gray symbols in Figs. 2 and 3).
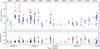 |
Fig. 2 Top panel: light curve of 4U 1728–34 during the 12 yr of INTEGRAL data considered in this paper. Circles/triangles denote JEM-X1/JEM-X2 persistent emission levels in mCrab over the 3–25 keV in the science windows where X-ray bursts are detected. The color coding denotes the spectral grouping used in the paper (see Fig. 3). Note that the lack of X-ray bursts in autumn 2009 and spring 2014 was caused by less frequent Galactic center observations because INTEGRAL was observing a nearby supernova. Bottom panel: hardness ratio between fluxes in the 8–25 keV and 3–8 keV JEM-X spectral bands. A dashed vertical line is overlaid for January 1st of each year. |
The energy spectra of the persistent emission for the four separate groups are shown in Fig. 4, and the best fitting parameters are given in Table 1. The HS spectrum, shown in Fig. 4a, stands out with significantly detected emission up to ~200 keV. It can be described by a combination of several two-component xspec models (see, e.g., Tarana et al. 2011) that are multiplied by the tbabs absorption model (Wilms et al. 2000), with the hydrogen column density fixed to the interstellar value of NH = 2.6 × 1022 cm-2 (Worpel et al. 2013). One possible model is thermal Comptonization (e.g., nthcomp; Zdziarski et al. 1996; Życki et al. 1999) plus a powerlaw tail or, alternatively, the powerlaw tail can be replaced by a reflection component (e.g., reflect; Magdziarz & Zdziarski 1995). Statistically, neither of these models can be rejected, although in the better fitting reflection model we find both the reflection fraction Refl ~ 1 and the electron temperature Te > 255 keV unusually high for a NS in the hard state.
In the soft state, the soft X-ray spectra (and timing properties) of most NS-LMXB can be described by a two-component dual-thermal model, where the cooler component is emitted by the accretion disc and the hotter one by the spreading layer (Gilfanov et al. 2003; Revnivtsev & Gilfanov 2006; Revnivtsev et al. 2013). A hard X-ray tail can also be detected in the soft state, (see e.g., Asai et al. 1994, and discussion below). For this reason, we fitted the soft state spectrum with a model tbabs × (bb + diskbb + powerlaw). The soft state spectra in the three groups shown in Fig. 4b have similar shapes, while they are clearly different from the HS spectrum. The only significant difference between the SS groups is the intensity of the thermal components, likely set by a factor of 3 variation in the mass accretion rate between SS1 and SS3. The accumulation of 12 yr of data allowed us to detect, for the first time, a significant hard X-ray tail up to ~80 keV in SS spectra of 4U 1728–34 (the powerlaw component). While tail dominates the X-ray emission above ~40 keV, the powerlaw index can not be constrained and it was fixed to the best-fitting value found for the hard state spectrum. Interestingly, we see that the tail does not seem to be variable while the soft X-ray flux changes between the groups.
3.2. JEM-X1 and ISGRI spectrum of the hard state bursts
We detected 123 X-ray bursts in the hard state with JEMX-1 and ISGRI, simultaneously. By stacking the X-ray burst spectra in the 1–10 s intervals from the bursts onset time (see Fig. 1), we could accumulate enough exposure time to detect the Comptonized emission from 4U 1728–34 up to ~80 keV and measure if there are any significant burst-induced changes in the hard X-ray tail. The average X-ray burst and persistent emission spectra during the hard state are shown in Fig. 5. In the observed spectra, shown in count space in Fig. 5a, we see a factor of three drop of the burst emission in the 40–80 keV band with respect to the persistent emission; the significance of the flux drop is approximately 3.4σ in the 40–50 keV band and 1.8σ in the 50–80 keV band.
We modeled the burst-averaged spectrum using an absorbed black body plus the nthcomp and powerlaw components responsible for the persistent emission. First, we held the persistent emission parameters fixed at the values found excluding the burst intervals. We find a mean blackbody temperature of Tbb = 2.59 ± 0.03 keV and an average flux of Fbb = [3.63 ± 0.10] × 10-8 erg cm-2 s-1 (3–20 keV band). The burst temperature is lower and the flux is approximately 50 per cent of the average peak flux measured by the RXTE/PCA instrument (Galloway et al. 2008), which is reasonable as our burst spectrum covers both the Eddington limited phase and the beginning of the cooling phase (see Fig. 1) during which the black body temperature and radius change significantly. From Fig. 5b it is evident that the burst spectrum drops below the persistent emission level above ~35 keV. The detection in the 40–50 keV band is significant (but marginal in the 50–80 keV range) even if the blackbody spectrum drops off exponentially, indicating that the persistent spectrum still produces the hard X-ray tail, only its intensity diminishes during the burst. The spectral fit is, however, extremely poor ( , partly because of the flux drop above 40 keV, but also due to the residuals below 30 keV. An important factor is also the fact that we needed to extract the spectrum combining 123 spectra, each of a 9 s interval, during which the black body temperature is bound to be slightly variable, which may partly be causing the poor fit.
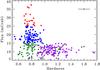 |
Fig. 3 Hardness-intensity diagram of 4U 1728–34 from JEM-X1 data. The flux is given in the 3–25 keV band in mCrab, and the hardness ratio is computed between the 8–25 keV and 3–8 keV fluxes. Red, blue and green points denote the soft state SS1, SS2 and SS3 groups, respectively, while the purple points denote the hard state HS group. The gray points are observations where the ISGRI count rate was between 3–5 cps, and are not attributed to the soft- nor the hard state (see text). The average error bar is shown in the top right corner. |
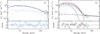 |
Fig. 4 Energy spectra of the persistent emission in 4U 1728–34. Panel a) shows the hard state spectrum with for the nthcomp + powerlaw model (magenta lines) and the reflect × nthcomp model (cyan lines). The dotted lines show the nthcomp component, the dot-dashed line shows the powerlaw component and the long-dashed line shows the reflection component. Panel b) shows the soft state spectra SS1 (red), SS2 (blue) and SS3 (green). The dotted line shows the bb component, the dashed line shows the diskbb component and the dot-dashed line shows the powerlaw component. The bottom panels show the residuals, [(data − model)/error]. |
We obviously can not add several new model parameters, but we note that the data above 40 keV are consistent with the powerlaw component. By assuming that the powerlaw component remains constant, and that the nthcomp component disappears during the burst above the 40 keV range, the fit improves slightly and we can estimate the high energy flux loss during the burst. The estimated flux loss is approximately Floss ~ 3.6 × 10⁻¹⁰ erg cm-2 s-1 in the 40−200 keV band, which is one per cent of the measured mean burst flux. On the other hand, rather than removing the nthcomp component, we also allowed the electron temperature and powerlaw index to vary during the burst (compare the light red and purple dotted lines in Fig. 5). We find that the fit is improved significantly, to  (for 6 degrees of freedom), if, during the X-ray burst, the nthcomp electron temperature cools down to Te = 3.5 ± 0.2 keV and the photon index decreases to
  (powerlaw component was left unchanged). In this case, the burst black body temperature and flux are significantly lower,
  and Fbb = [2.3 ± 0.3] × 10-8 erg cm-2 s-1 (3–20 keV band) compared to the standard black body fit with non-variable persistent emission components.
Best fitting parameters from modeling INTEGRAL JEM-X1 and ISGRI persistent spectra.
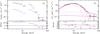 |
Fig. 5 Average JEM-X and ISGRI spectrum of the X-ray bursts in the hard state (black crosses) compared to the persistent emission spectrum (purple crosses). Panel a) shows the spectrum in count space, and the bottom panel shows the ratio between the count rates of the burst over persistent emission. Note the ~70 per cent decrease of the persistent emission above 40 keV during the X-ray burst. Panel b) shows the EFE burst spectrum together with two persistent emission models. The purple lines are for the case where the persistent emission model is not allowed to vary (the dotted line shows the nthcomp model and the dot-dashed line shows the powerlaw component; see Fig. 4). The red 3-dot-dashed line shows the X-ray burst black body component. The light red lines show the case where the nthcomp model component electron temperature and photon index are allowed to vary. The latter model fits the data significantly better. |
4. Discussion
The measured persistent spectrum of 4U 1728–34 is in broad agreement with previous studies by Falanga et al. (2006), who used data accumulated in 2003 and 2004, and by Tarana et al. (2011), who analyzed the data from a joint RXTE and INTEGRAL campaign in 2006 and 2007. By accumulating spectral data over 12 yr, we improved upon these analyses by detecting significant emission up to higher energies. In particular, one of the new findings here is the detection of a high-energy X-ray tail in the persistent emission during the soft state up to ~80 keV. This tail dominates the X-ray emission of 4U 1728–34 above ~40 keV. Furthermore, we confirm the detection of a significant high energy tail in the hard state as well, first reported by Tarana et al. (2011). However, there are severe (and well known) spectral modeling degeneracies with such spectra. For example, the powerlaw tail can be replaced by a reflection component to obtain an equally satisfactory fit.
Hard tails in the soft state have been detected in GX 5–1 (Asai et al. 1994), GX 17+2 (Di Salvo et al. 2000), Sco X-1 (Revnivtsev et al. 2014), and several other NS-LMXBs (Paizis et al. 2006). Similar high-energy tails in the hard state have been seen in other bursters as well, including the “clocked burster” (Rodi et al. 2016). The intensity of the tail in 4U 1728–34 is qualitatively similar to these NS-LMXBs, and therefore the physical origin is likely the same. The two favored models are linked either to jet emission, given the relation between the powerlaw component flux and radio flux (Migliari et al. 2007), or, alternatively, the tail could be produced by Comptonization of non-thermal electrons on top of the accretion disc (e.g., Zdziarski et al. 2001). The models where the tail is produced by bulk-motion Comptonization (e.g., Titarchuk et al. 1997) are dis-favored by the non-detection of the predicted turn-over at high energies in Sco X-1 (Revnivtsev et al. 2014). Furthermore, as jet emission is typically not seen in the soft states even in the radio bands, we find it likely that the tails are produced by Comptonization of non-thermal electrons in the hot flow or corona.
The observed spectral softening above ~35 keV, and the related coronal cooling from Te ≈ 21 to 3.5 keV during the bursts, is a clear sign that the inner accretion flow is perturbed during the hard state bursts of 4U 1728–34. Thus, 4U 1728–34 is yet another system where burst-disc interactions seem to be important together with Aql X-1 (Maccarone & Coppi 2003; Chen et al. 2013), IGR J17473–2721 (Chen et al. 2012), 4U 1636–536 (Ji et al. 2013), GS 1826–238 (Ji et al. 2014a, 2015), 4U 1608–52 (Degenaar et al. 2016), and possibly also KS 1731–260 and 4U 1705–44 (Ji et al. 2014b). Importantly, we now have the first X-ray burst spectrum measured up to ~80 keV. Similarly to these previous works, we find that the electron cooling (and the resulting spectral variation above 40 keV) is likely caused by the additional low-energy burst photons that enter the corona or hot inner flow. Essentially, the increased number of soft seed photons for Comptonization causes the equilibrium electron temperature to become lower, leading to the observed softening of the X-ray spectrum. In many respects the situation resembles hard-to-soft spectral state transitions in black hole binaries, where the truncated disc approaches the innermost stable orbit (see, e.g., Poutanen & Vurm 2009; Malzac & Belmont 2009; Veledina et al. 2011).
Curiously Ji et al. (2014b) did not find a hard X-ray deficit for 4U 1728–34 using RXTE/PCA data. There can be various reasons behind our discrepant results. First, the peak temperatures of 4U 1728–34 are high, ~3 keV (Galloway et al. 2008), and therefore during the burst peak (i.e., near photospheric touchdown) this hot burst emission may contribute slightly at 40 keV (Ji et al. 2014b). As the ISGRI response is much more flat in the 40–50 keV band than the RXTE/PCA response that drops off almost exponentially, burst photons in that energy range have more influence in the RXTE/PCA than in the ISGRI spectra. Furthermore, IBIS/ISGRI resolves 4U 1728–34 from the nearby “rapid burster” that is within the 1 degree FoV of the collimated, non-imaging PCA instrument. In addition, 4U 1728–34 is located at low Galactic latitude and thus the 40–50 keV PCA count rate could be contaminated by the Galactic ridge emission (Krivonos et al. 2007).
The electron cooling during X-ray bursts provides an interesting tool to probe the coronal structure, who’s geometry is currently unknown. While the limited sensitivity prohibits detailed quantitative conclusions, it is clear that the hot electrons must cover a large fraction of the sky (from the NS point of view) for the burst to significantly affect the coronal temperature. In the hot flow paradigm, the electron cooling can thus be seen as a natural consequence of a geometrically thick inner accretion flow. In other coronal geometries where the hard X-ray region covers only a small volume in the NS equatorial region, such as the “disc gap model” (Kluzniak & Wilson 1991), it is more difficult to explain the observed spectral variations, since most of the burst flux would not be intercepted by the corona.
Another consequence of the coronal cooling is that it may impact the neutron star mass and radius measurements through X-ray burst modeling of hard state bursts (e.g., Poutanen et al. 2014; Nättilä et al. 2016). We have observed that the emission level above 40 keV drops by a factor of three during the X-ray burst, causing an integrated flux loss of Floss ~ 3.6 × 10⁻¹⁰ erg cm-2 s-1 in the 40−200 keV band. This is approximately one per cent of the total X-ray burst flux. If the coronal heating mechanism is not altered during the burst, then this missing hard X-ray flux may instead be emitted by the cooler electrons in the soft X-ray band. This suggests that, in the hard state of 4U 1728–34, the burst induced increase of the persistent emission level in the 3–20 keV band may lead to approximately one per cent overestimation of the X-ray burst fluxes using the standard black body spectral analysis. In other bursters a similar mechanism may operate in the hard state as well, and for these systems the burst induced coronal cooling can be more important if the mass accretion rate is higher than in 4U 1728–34.
The ~3.5 keV electron temperature we find during the bursts is, however, rather low. In fact, similar temperatures are observed in the persistent spreading layer emission in the soft state (see Table 1). This raises the question as to whether during the X-ray bursts the hot inner flow (or corona) can cool down so significantly that it collapses into a thin disc (Liu et al. 2007), and then momentarily forms an optically thick spreading layer near the NS equator. With current data it is hard to test this speculation, but it would be interesting to see if such X-ray burst-induced coronal condensation happens in radiation-hydrodynamical simulations.
In order to correct for the electron cooling effect in the hard state burst analysis in general, it appears that the simplest method of multiplying the persistent emission spectrum by a constant factor (Worpel et al. 2013, 2015) is not sufficient, but a more complex correction method will need to be devised. This is non-trivial, however, as past instruments, such as the RXTE/PCA, were typically well calibrated only up to approximately 25 keV (above which the sensitivity is low), severely complicating the spectral measurements of the high-energy tail. Therefore, future monitoring of the Galactic center with INTEGRAL, and also dedicated observations of bursters with sensitive instruments in the 40–80 keV range, such as NuSTAR (Harrison et al. 2013) or Astrosat (Singh et al. 2014), are needed to determine the high-energy spectral changes during X-ray bursts, which are necessary to better constrain the mechanisms behind the coronal cooling.
ISDC Data Centre for Astrophysics, http://www.isdc.unige.ch/
We note that part of this work is also fed into a larger type-I X-ray burst database, MINBAR, see http://burst.sci.monash.edu/minbar
Acknowledgments
We thank the referee for a thorough review that helped to significantly improve the manuscript, and we also thank Jérôme Chenevez, Tony Bird, Jean in ’t Zand and Long Ji for interesting discussions. J.J.E.K. acknowledges support from the Academy of Finland grant 268740 and the ESA research fellowship programme. J.P. was supported by the Foundations’ Professor Pool and the Finnish Cultural Foundation. We also acknowledge ISSI/Bern for hosting the international team “Thermonuclear Bursts: Probing Neutron Stars and their Accretion Environments”, where the early results of this project were discussed. This research is based on observations with INTEGRAL, an ESA project with instruments and science data centre funded by ESA member states (especially the PI countries: Denmark, France, Germany, Italy, Switzerland and Spain) and with the participation of Russia and the USA.
References
- Asai, K., Dotani, T., Mitsuda, K., et al. 1994, PASJ, 46, 479 [NASA ADS] [Google Scholar]
- Chen, Y.-P., Zhang, S., Zhang, S.-N., Li, J., & Wang, J.-M. 2012, ApJ, 752, L34 [NASA ADS] [CrossRef] [Google Scholar]
- Chen, Y.-P., Zhang, S., Zhang, S.-N., et al. 2013, ApJ, 777, L9 [NASA ADS] [CrossRef] [Google Scholar]
- Degenaar, N., Koljonen, K. I. I., Chakrabarty, D., et al. 2016, MNRAS, 456, 4256 [NASA ADS] [CrossRef] [Google Scholar]
- Di Salvo, T., Stella, L., Robba, N. R., et al. 2000, ApJ, 544, L119 [NASA ADS] [CrossRef] [Google Scholar]
- Done, C., Gierliński, M., & Kubota, A. 2007, A&ARv, 15, 1 [NASA ADS] [CrossRef] [EDP Sciences] [Google Scholar]
- Falanga, M., Götz, D., Goldoni, P., et al. 2006, A&A, 458, 21 [NASA ADS] [CrossRef] [EDP Sciences] [Google Scholar]
- Galloway, D. K., Psaltis, D., Chakrabarty, D., & Muno, M. P. 2003, ApJ, 590, 999 [NASA ADS] [CrossRef] [Google Scholar]
- Galloway, D. K., Muno, M. P., Hartman, J. M., Psaltis, D., & Chakrabarty, D. 2008, ApJS, 179, 360 [NASA ADS] [CrossRef] [Google Scholar]
- Galloway, D. K., Yao, Y., Marshall, H., Misanovic, Z., & Weinberg, N. 2010, ApJ, 724, 417 [NASA ADS] [CrossRef] [Google Scholar]
- Gilfanov, M., Revnivtsev, M., & Molkov, S. 2003, A&A, 410, 217 [NASA ADS] [CrossRef] [EDP Sciences] [Google Scholar]
- Harrison, F. A., Craig, W. W., Christensen, F. E., et al. 2013, ApJ, 770, 103 [NASA ADS] [CrossRef] [Google Scholar]
- Hasinger, G., & van der Klis, M. 1989, A&A, 225, 79 [NASA ADS] [Google Scholar]
- Hoffman, J. A., Lewin, W. H. G., Doty, J., et al. 1976, ApJ, 210, L13 [NASA ADS] [CrossRef] [Google Scholar]
- Inogamov, N. A., & Sunyaev, R. A. 1999, Astron. Lett., 25, 269 [NASA ADS] [Google Scholar]
- Inogamov, N. A., & Sunyaev, R. A. 2010, Astron. Lett., 36, 848 [NASA ADS] [CrossRef] [Google Scholar]
- in ’t Zand, J. J. M., Heise, J., Kuulkers, E., et al. 1999a, A&A, 347, 891 [NASA ADS] [Google Scholar]
- in ’t Zand, J. J. M., Verbunt, F., Strohmayer, T. E., et al. 1999b, A&A, 345, 100 [NASA ADS] [Google Scholar]
- in ’t Zand, J. J. M., Galloway, D. K., Marshall, H. L., et al. 2013, A&A, 553, A83 [NASA ADS] [CrossRef] [EDP Sciences] [Google Scholar]
- Ji, L., Zhang, S., Chen, Y., et al. 2013, MNRAS, 432, 2773 [NASA ADS] [CrossRef] [Google Scholar]
- Ji, L., Zhang, S., Chen, Y., et al. 2014a, ApJ, 782, 40 [NASA ADS] [CrossRef] [Google Scholar]
- Ji, L., Zhang, S., Chen, Y.-P., et al. 2014b, A&A, 564, A20 [NASA ADS] [CrossRef] [EDP Sciences] [Google Scholar]
- Ji, L., Zhang, S., Chen, Y., et al. 2015, ApJ, 806, 89 [NASA ADS] [CrossRef] [Google Scholar]
- Kluzniak, W., & Wilson, J. R. 1991, ApJ, 372, L87 [NASA ADS] [CrossRef] [Google Scholar]
- Koljonen, K. I. I., Kajava, J. J. E., & Kuulkers, E. 2016, ApJ, 829, 91 [NASA ADS] [CrossRef] [Google Scholar]
- Krivonos, R., Revnivtsev, M., Churazov, E., et al. 2007, A&A, 463, 957 [NASA ADS] [CrossRef] [EDP Sciences] [Google Scholar]
- Lewin, W. H. G., van Paradijs, J., & Taam, R. E. 1993, Space Sci. Rev., 62, 223 [NASA ADS] [CrossRef] [Google Scholar]
- Liu, B. F., Taam, R. E., Meyer-Hofmeister, E., & Meyer, F. 2007, ApJ, 671, 695 [NASA ADS] [CrossRef] [Google Scholar]
- Lund, N., Budtz-Jørgensen, C., Westergaard, N. J., et al. 2003, A&A, 411, L231 [NASA ADS] [CrossRef] [EDP Sciences] [Google Scholar]
- Maccarone, T. J., & Coppi, P. S. 2003, A&A, 399, 1151 [NASA ADS] [CrossRef] [EDP Sciences] [Google Scholar]
- Magdziarz, P., & Zdziarski, A. A. 1995, MNRAS, 273, 837 [NASA ADS] [CrossRef] [Google Scholar]
- Malzac, J., & Belmont, R. 2009, MNRAS, 392, 570 [NASA ADS] [CrossRef] [Google Scholar]
- Marti, J., Mirabel, I. F., Rodriguez, L. F., & Chaty, S. 1998, A&A, 332, L45 [NASA ADS] [Google Scholar]
- Migliari, S., Miller-Jones, J. C. A., Fender, R. P., et al. 2007, ApJ, 671, 706 [NASA ADS] [CrossRef] [Google Scholar]
- Muñoz-Darias, T., Fender, R. P., Motta, S. E., & Belloni, T. M. 2014, MNRAS, 443, 3270 [NASA ADS] [CrossRef] [Google Scholar]
- Nättilä, J., Steiner, A. W., Kajava, J. J. E., Suleimanov, V. F., & Poutanen, J. 2016, A&A, 591, A25 [NASA ADS] [CrossRef] [EDP Sciences] [Google Scholar]
- Paizis, A., Farinelli, R., Titarchuk, L., et al. 2006, A&A, 459, 187 [NASA ADS] [CrossRef] [EDP Sciences] [Google Scholar]
- Poutanen, J., & Vurm, I. 2009, ApJ, 690, L97 [NASA ADS] [CrossRef] [Google Scholar]
- Poutanen, J., Nättilä, J., Kajava, J. J. E., et al. 2014, MNRAS, 442, 3777 [NASA ADS] [CrossRef] [Google Scholar]
- Revnivtsev, M. G., & Gilfanov, M. R. 2006, A&A, 453, 253 [NASA ADS] [CrossRef] [EDP Sciences] [Google Scholar]
- Revnivtsev, M. G., Suleimanov, V. F., & Poutanen, J. 2013, MNRAS, 434, 2355 [NASA ADS] [CrossRef] [Google Scholar]
- Revnivtsev, M. G., Tsygankov, S. S., Churazov, E. M., & Krivonos, R. A. 2014, MNRAS, 445, 1205 [NASA ADS] [CrossRef] [Google Scholar]
- Rodi, J., Jourdain, E., & Roques, J. P. 2016, ApJ, 817, 101 [NASA ADS] [CrossRef] [Google Scholar]
- Schatz, H., Aprahamian, A., Goerres, J., et al. 1998, Phys. Rep., 294, 167 [NASA ADS] [CrossRef] [Google Scholar]
- Singh, K. P., Tandon, S. N., Agrawal, P. C., et al. 2014, in Space Telescopes and Instrumentation 2014: Ultraviolet to Gamma Ray, Proc. SPIE, 9144, 91441 [Google Scholar]
- Strohmayer, T. E., Zhang, W., Swank, J. H., et al. 1996, ApJ, 469, L9 [NASA ADS] [CrossRef] [Google Scholar]
- Suleimanov, V., & Poutanen, J. 2006, MNRAS, 369, 2036 [NASA ADS] [CrossRef] [Google Scholar]
- Sunyaev, R. A., & Shakura, N. I. 1986, Sov. Astron. Lett., 12, 117 [Google Scholar]
- Tarana, A., Belloni, T., Bazzano, A., Méndez, M., & Ubertini, P. 2011, MNRAS, 416, 873 [NASA ADS] [CrossRef] [Google Scholar]
- Titarchuk, L., Mastichiadis, A., & Kylafis, N. D. 1997, ApJ, 487, 834 [NASA ADS] [CrossRef] [Google Scholar]
- Ubertini, P., Lebrun, F., Di Cocco, G., et al. 2003, A&A, 411, L131 [NASA ADS] [CrossRef] [EDP Sciences] [Google Scholar]
- Veledina, A., Poutanen, J., & Vurm, I. 2011, ApJ, 737, L17 [NASA ADS] [CrossRef] [Google Scholar]
- Wilms, J., Allen, A., & McCray, R. 2000, ApJ, 542, 914 [NASA ADS] [CrossRef] [Google Scholar]
- Winkler, C., Courvoisier, T. J.-L., Di Cocco, G., et al. 2003, A&A, 411, L1 [NASA ADS] [CrossRef] [EDP Sciences] [Google Scholar]
- Woosley, S. E., & Taam, R. E. 1976, Nature, 263, 101 [NASA ADS] [CrossRef] [Google Scholar]
- Worpel, H., Galloway, D. K., & Price, D. J. 2013, ApJ, 772, 94 [NASA ADS] [CrossRef] [Google Scholar]
- Worpel, H., Galloway, D. K., & Price, D. J. 2015, ApJ, 801, 60 [NASA ADS] [CrossRef] [Google Scholar]
- Zdziarski, A. A., Johnson, W. N., & Magdziarz, P. 1996, MNRAS, 283, 193 [NASA ADS] [CrossRef] [Google Scholar]
- Zdziarski, A. A., Grove, J. E., Poutanen, J., Rao, A. R., & Vadawale, S. V. 2001, ApJ, 554, L45 [NASA ADS] [CrossRef] [Google Scholar]
- Zhang, G., Méndez, M., Zamfir, M., & Cumming, A. 2016, MNRAS, 455, 2004 [NASA ADS] [CrossRef] [Google Scholar]
- Życki, P. T., Done, C., & Smith, D. A. 1999, MNRAS, 309, 561 [NASA ADS] [CrossRef] [Google Scholar]
All Tables
Best fitting parameters from modeling INTEGRAL JEM-X1 and ISGRI persistent spectra.
All Figures
|
Fig. 1 Average X-ray burst light curve of 4U 1728–34 in the hard state observed by JEM-X1 (blue) in the 3–25 keV band and IBIS/ISGRI (20–40 keV in black and 40–50 keV in orange; right axis). The band between two vertical gray lines indicates the time range where the average X-ray burst spectrum was extracted. |
| In the text | |
|
Fig. 2 Top panel: light curve of 4U 1728–34 during the 12 yr of INTEGRAL data considered in this paper. Circles/triangles denote JEM-X1/JEM-X2 persistent emission levels in mCrab over the 3–25 keV in the science windows where X-ray bursts are detected. The color coding denotes the spectral grouping used in the paper (see Fig. 3). Note that the lack of X-ray bursts in autumn 2009 and spring 2014 was caused by less frequent Galactic center observations because INTEGRAL was observing a nearby supernova. Bottom panel: hardness ratio between fluxes in the 8–25 keV and 3–8 keV JEM-X spectral bands. A dashed vertical line is overlaid for January 1st of each year. |
| In the text | |
|
Fig. 3 Hardness-intensity diagram of 4U 1728–34 from JEM-X1 data. The flux is given in the 3–25 keV band in mCrab, and the hardness ratio is computed between the 8–25 keV and 3–8 keV fluxes. Red, blue and green points denote the soft state SS1, SS2 and SS3 groups, respectively, while the purple points denote the hard state HS group. The gray points are observations where the ISGRI count rate was between 3–5 cps, and are not attributed to the soft- nor the hard state (see text). The average error bar is shown in the top right corner. |
| In the text | |
|
Fig. 4 Energy spectra of the persistent emission in 4U 1728–34. Panel a) shows the hard state spectrum with for the nthcomp + powerlaw model (magenta lines) and the reflect × nthcomp model (cyan lines). The dotted lines show the nthcomp component, the dot-dashed line shows the powerlaw component and the long-dashed line shows the reflection component. Panel b) shows the soft state spectra SS1 (red), SS2 (blue) and SS3 (green). The dotted line shows the bb component, the dashed line shows the diskbb component and the dot-dashed line shows the powerlaw component. The bottom panels show the residuals, [(data − model)/error]. |
| In the text | |
|
Fig. 5 Average JEM-X and ISGRI spectrum of the X-ray bursts in the hard state (black crosses) compared to the persistent emission spectrum (purple crosses). Panel a) shows the spectrum in count space, and the bottom panel shows the ratio between the count rates of the burst over persistent emission. Note the ~70 per cent decrease of the persistent emission above 40 keV during the X-ray burst. Panel b) shows the EFE burst spectrum together with two persistent emission models. The purple lines are for the case where the persistent emission model is not allowed to vary (the dotted line shows the nthcomp model and the dot-dashed line shows the powerlaw component; see Fig. 4). The red 3-dot-dashed line shows the X-ray burst black body component. The light red lines show the case where the nthcomp model component electron temperature and photon index are allowed to vary. The latter model fits the data significantly better. |
| In the text | |
Current usage metrics show cumulative count of Article Views (full-text article views including HTML views, PDF and ePub downloads, according to the available data) and Abstracts Views on Vision4Press platform.
Data correspond to usage on the plateform after 2015. The current usage metrics is available 48-96 hours after online publication and is updated daily on week days.
Initial download of the metrics may take a while.