Fig. 5
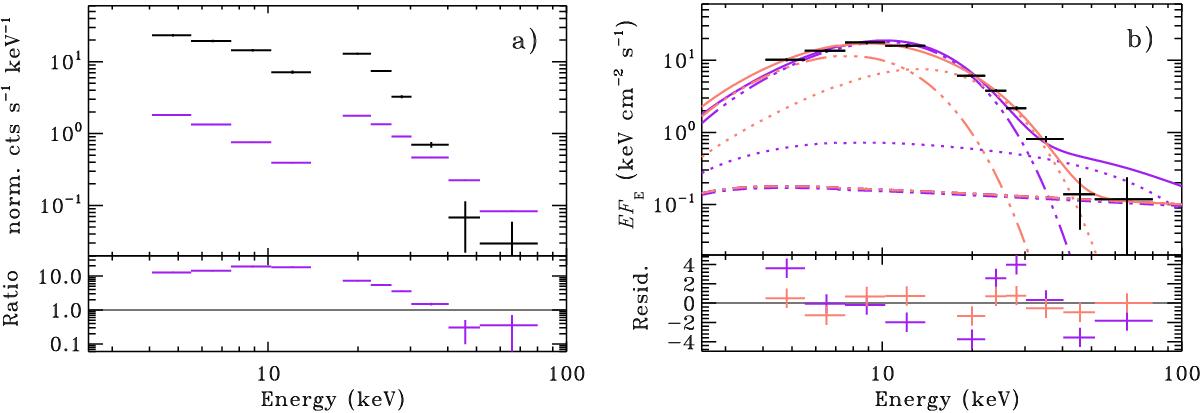
Average JEM-X and ISGRI spectrum of the X-ray bursts in the hard state (black crosses) compared to the persistent emission spectrum (purple crosses). Panel a) shows the spectrum in count space, and the bottom panel shows the ratio between the count rates of the burst over persistent emission. Note the ~70 per cent decrease of the persistent emission above 40 keV during the X-ray burst. Panel b) shows the EFE burst spectrum together with two persistent emission models. The purple lines are for the case where the persistent emission model is not allowed to vary (the dotted line shows the nthcomp model and the dot-dashed line shows the powerlaw component; see Fig. 4). The red 3-dot-dashed line shows the X-ray burst black body component. The light red lines show the case where the nthcomp model component electron temperature and photon index are allowed to vary. The latter model fits the data significantly better.
Current usage metrics show cumulative count of Article Views (full-text article views including HTML views, PDF and ePub downloads, according to the available data) and Abstracts Views on Vision4Press platform.
Data correspond to usage on the plateform after 2015. The current usage metrics is available 48-96 hours after online publication and is updated daily on week days.
Initial download of the metrics may take a while.