Fig. 3
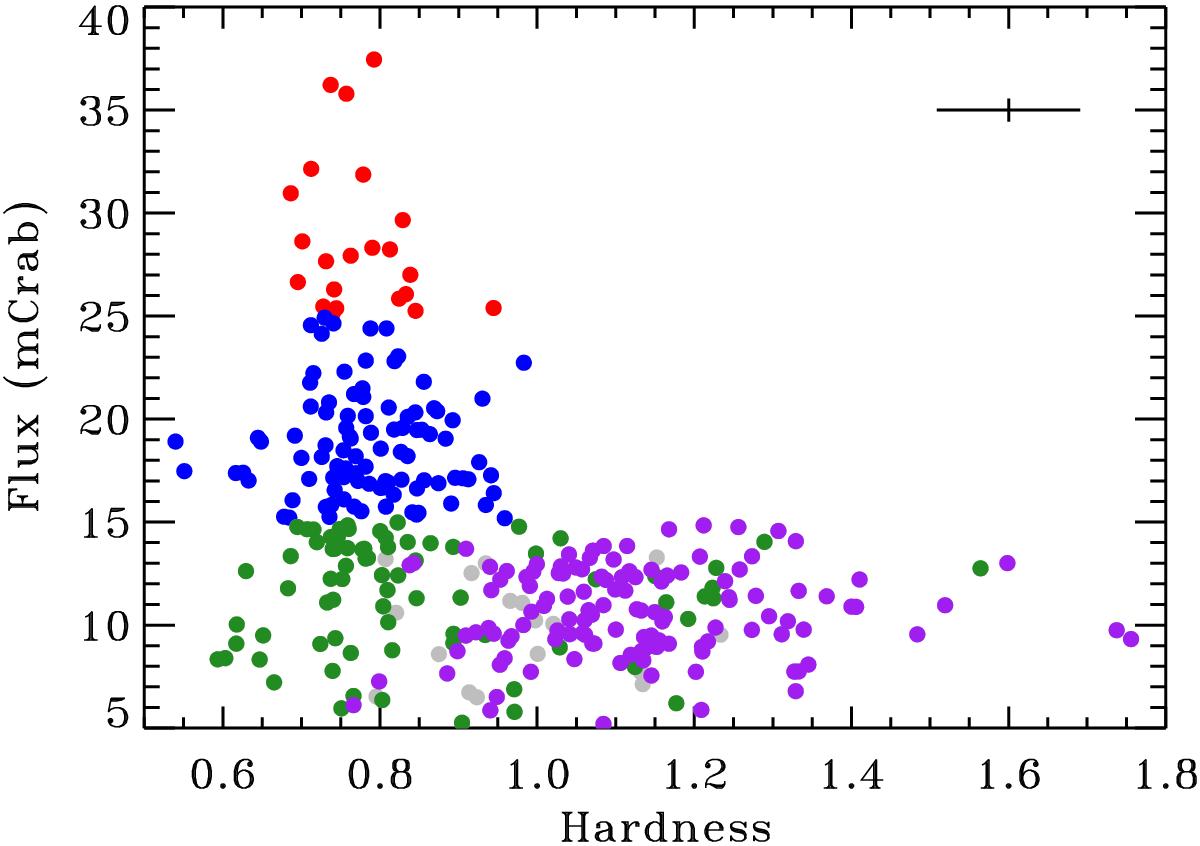
Hardness-intensity diagram of 4U 1728–34 from JEM-X1 data. The flux is given in the 3–25 keV band in mCrab, and the hardness ratio is computed between the 8–25 keV and 3–8 keV fluxes. Red, blue and green points denote the soft state SS1, SS2 and SS3 groups, respectively, while the purple points denote the hard state HS group. The gray points are observations where the ISGRI count rate was between 3–5 cps, and are not attributed to the soft- nor the hard state (see text). The average error bar is shown in the top right corner.
Current usage metrics show cumulative count of Article Views (full-text article views including HTML views, PDF and ePub downloads, according to the available data) and Abstracts Views on Vision4Press platform.
Data correspond to usage on the plateform after 2015. The current usage metrics is available 48-96 hours after online publication and is updated daily on week days.
Initial download of the metrics may take a while.