Fig. 2
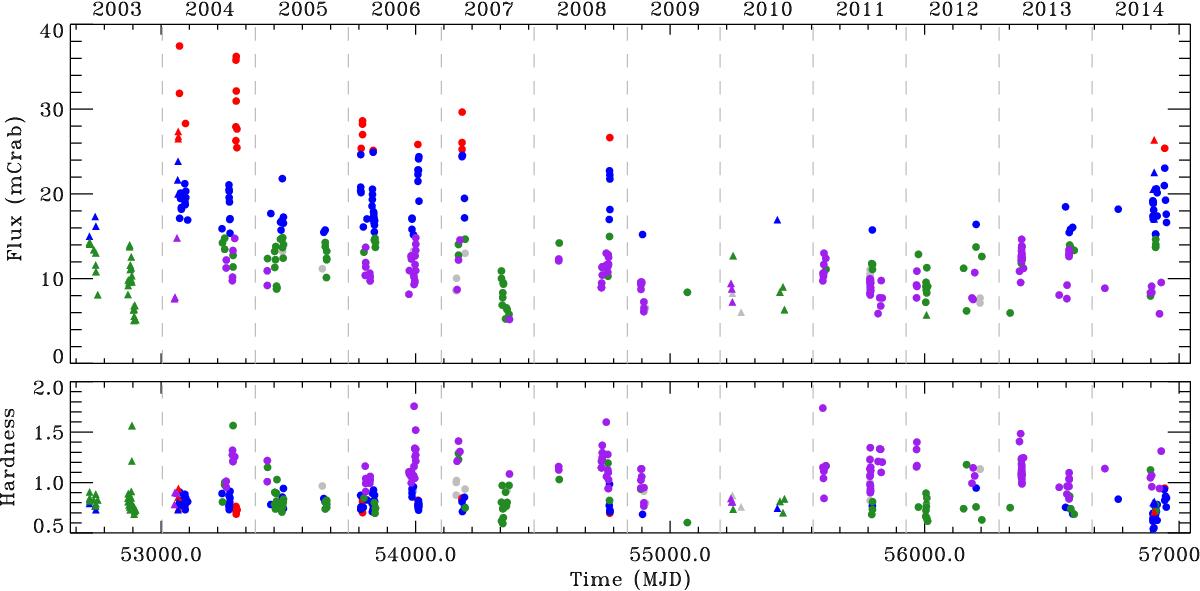
Top panel: light curve of 4U 1728–34 during the 12 yr of INTEGRAL data considered in this paper. Circles/triangles denote JEM-X1/JEM-X2 persistent emission levels in mCrab over the 3–25 keV in the science windows where X-ray bursts are detected. The color coding denotes the spectral grouping used in the paper (see Fig. 3). Note that the lack of X-ray bursts in autumn 2009 and spring 2014 was caused by less frequent Galactic center observations because INTEGRAL was observing a nearby supernova. Bottom panel: hardness ratio between fluxes in the 8–25 keV and 3–8 keV JEM-X spectral bands. A dashed vertical line is overlaid for January 1st of each year.
Current usage metrics show cumulative count of Article Views (full-text article views including HTML views, PDF and ePub downloads, according to the available data) and Abstracts Views on Vision4Press platform.
Data correspond to usage on the plateform after 2015. The current usage metrics is available 48-96 hours after online publication and is updated daily on week days.
Initial download of the metrics may take a while.