Free Access
Fig. 1
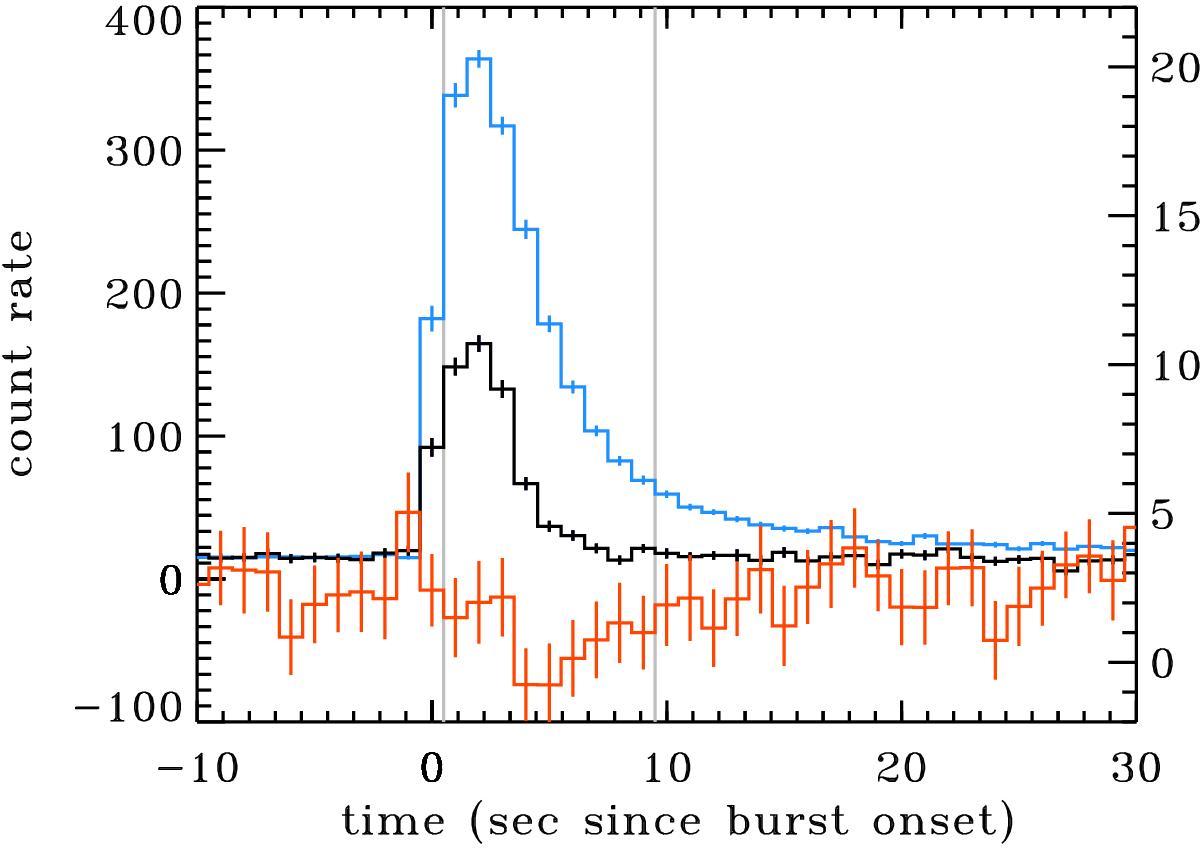
Average X-ray burst light curve of 4U 1728–34 in the hard state observed by JEM-X1 (blue) in the 3–25 keV band and IBIS/ISGRI (20–40 keV in black and 40–50 keV in orange; right axis). The band between two vertical gray lines indicates the time range where the average X-ray burst spectrum was extracted.
Current usage metrics show cumulative count of Article Views (full-text article views including HTML views, PDF and ePub downloads, according to the available data) and Abstracts Views on Vision4Press platform.
Data correspond to usage on the plateform after 2015. The current usage metrics is available 48-96 hours after online publication and is updated daily on week days.
Initial download of the metrics may take a while.