Fig. 4
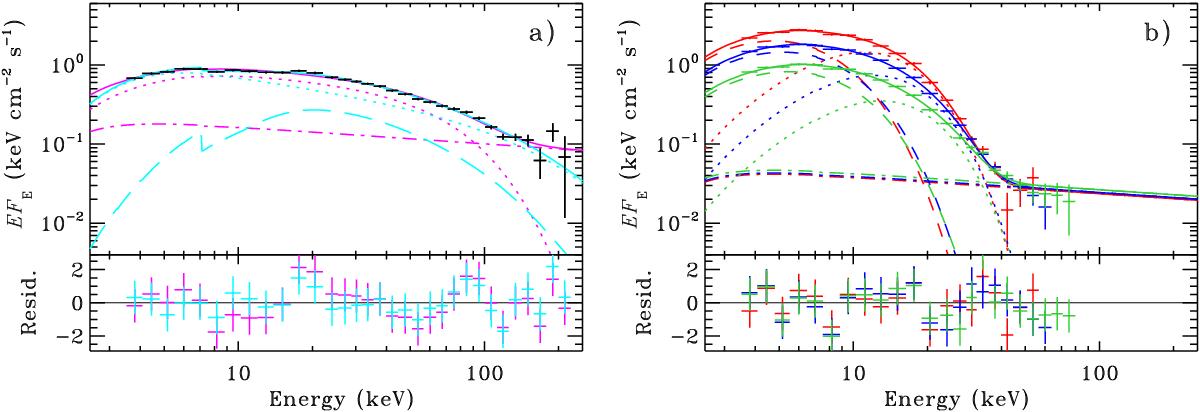
Energy spectra of the persistent emission in 4U 1728–34. Panel a) shows the hard state spectrum with for the nthcomp + powerlaw model (magenta lines) and the reflect × nthcomp model (cyan lines). The dotted lines show the nthcomp component, the dot-dashed line shows the powerlaw component and the long-dashed line shows the reflection component. Panel b) shows the soft state spectra SS1 (red), SS2 (blue) and SS3 (green). The dotted line shows the bb component, the dashed line shows the diskbb component and the dot-dashed line shows the powerlaw component. The bottom panels show the residuals, [(data − model)/error].
Current usage metrics show cumulative count of Article Views (full-text article views including HTML views, PDF and ePub downloads, according to the available data) and Abstracts Views on Vision4Press platform.
Data correspond to usage on the plateform after 2015. The current usage metrics is available 48-96 hours after online publication and is updated daily on week days.
Initial download of the metrics may take a while.