| Issue |
A&A
Volume 599, March 2017
|
|
|---|---|---|
| Article Number | A38 | |
| Number of page(s) | 16 | |
| Section | Interstellar and circumstellar matter | |
| DOI | https://doi.org/10.1051/0004-6361/201629455 | |
| Published online | 24 February 2017 | |
Dust and gas environment of the young embedded cluster IRAS 18511+0146
1 Indian Institute of Space science and Technology, 695 547 Thiruvananthapuram, India
e-mail: This email address is being protected from spambots. You need JavaScript enabled to view it.
2 INAF–Osservatorio Astrofisico di Arcetri, Largo E. Fermi 5, 50125 Firenze, Italy
3 European Southern Observatory, 85748 Garching, Germany
4 Dublin Institute of Advanced Studies, 31 Fitzwilliam Place, Dublin 2, Ireland
5 INAF–Instituto di Fisica dello Spazio Interplanetario, via G. Galilei, CP-27, 00044 Frascati, Italy
Received: 2 August 2016
Accepted: 7 November 2016
Abstract
Context. Since massive and intermediate mass stars form in clusters, a comparative investigation of the environments of the young embedded cluster members can reveal significant information about the conditions under which stars form and evolve.
Aims. IRAS 18511+0146 is a young embedded (proto)cluster located at 3.5 kpc surrounding what appears to be an intermediate mass protostar. Here, we investigate the nature of cluster members (two of which are believed to be the most massive and luminous) using imaging and spectroscopy in the near and mid-infrared. In particular, we examine the three brightest mid-infrared objects, two of which are believed to be the most massive ones driving the luminosity of this region.
Methods. Near-infrared spectroscopy of nine objects (bright in K-bands) towards IRAS 18511+0146 has been carried out. Several cluster members have also been investigated in the mid-infrared using spectroscopic and imaging with VISIR on the VLT. Far-infrared images from the Herschel Hi-GAL survey have been used to construct the column density and temperature maps of the region.
Results. The brightest point-like object associated with IRAS 18511+0146 is referred to as S7 in the present work (designated UGPS J185337.88+015030.5 in the UKIRT Galactic Plane survey). S7 is likely the most luminous object in the cluster as it is bright at all wavelengths ranging from the near-infrared to millimetre. Seven of the nine objects show rising spectral energy distributions in the near-infrared, with four objects showing Br-γ emission. Three members: S7, S10 (also UGPS J185338.37+015015.3) and S11 (also UGPS J185338.72+015013.5) are bright in mid-infrared with diffuse emission being detected in the vicinity of S11 in PAH bands. Silicate absorption is detected towards these three objects, with an absorption maximum between 9.6 and 9.7 μm, large optical depths (1.8–3.2), and profile widths of 1.6−2.1μm. The silicate profiles of S7 and S10 are similar, in contrast to S11 (which has the largest width and optical depth). The cold dust emission peaks at S7, with temperature at 26 K and column density N(H2) ~ 7 × 1022 cm-2. The bolometric luminosity of IRAS 18511 region is L ~ 1.8 × 10⁴L⊙. S7 is the main contributor to the bolometric luminosity, with L (S7) ≳104L⊙.
Conclusions. S7 is a high-mass protostellar object with ionised stellar winds, evident from the correlation between radio and bolometric luminosity, as well as the asymmetric Br-γ profile. The differences in silicate profiles of S7 and S11 could be due to different radiation environments as we believe the former to be more massive and in an earlier phase than the latter.
Key words: stars: formation / stars: pre-main sequence / stars: massive / infrared: ISM / infrared: stars / stars: individual: IRAS 18511+0146
Part of this work has been carried out at INAF Osservatorio Astrofisico di Arcetri.
© ESO, 2017
1. Introduction
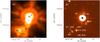 |
Fig. 1 a) Spitzer-GLIMPSE 8 μm and b) UKDISS – GPS K-band image of IRAS 18511 region. a) The mid-infrared sources 18511-A (S7) as well as young stellar objects G3–G5 are marked. The sources for which near-infrared spectroscopy have been carried out are shown in b). |
It is now widely accepted that massive stars form in clustered environments, deeply embedded in molecular clouds (McKee & Ostriker 2007). In addition, it is found that the distribution of stars in a young cluster is related to the distribution of dense gas in the parent molecular cloud (Lada & Lada 2003). Therefore, studies of young embedded (proto)clusters are useful in understanding the process of clustered star formation (Zinnecker & Yorke 2007). In particular, the formation of small stellar groups around Herbig Ae/Be stars represents a transition between rich clusters harbouring massive stars and loose groups/associations of lower-mass stars (Testi et al. 1998). There are numerous works investigating star formation using a wide variety of probes that encompass the examination of a single or multiple protostar(s), the embedded cluster, the gas and dust distribution, the dynamics in various stages of evolution, as well as the probable star formation history. However, studies probing clusters of protostars are relatively few, for example Cyganowski et al. (2007), Wang et al. (2012), Wolf-Chase et al. (2003). These mostly investigate the massive and rarer end of the initial mass function as other intermediate- to low-mass cluster members are usually difficult to isolate. This difficulty is not only due to high extinction, but also due to the fact that these infant objects are not radio or mid-infrared loud. With growing interest in trying to understand the conditions of protocluster formation (André et al. 2007; Peretto & Fuller 2009), surveys are being carried out to locate protoclusters across different regions of the Galaxy (Klein et al. 2005). In this paper, we investigate IRAS 18511+0146 that is a likely forerunner to a Herbig type small star cluster (VTW07 Vig et al. 2007). The earlier distance to IRAS 18511 was estimated at 3.9 kpc but a more recent distance estimate from RMS survey puts the distance to this object as 3.5 kpc whilst solving the distance ambiguity (Lumsden et al. 2013; Mottram et al. 2011). In the present work, we proceed with the recent distance estimate of 3.5 kpc. The luminosity of this region based on the far-infrared spectral energy distribution (SED) is ~ 8.5 × 10³L⊙ (Lumsden et al. 2013). An infrared, submillimetre and radio investigation of this region has revealed the presence of a young protocluster in the midst of high extinction filamentary features and clumpy structures (VTW07). The advent of Herschel has shown that filamentary structures are ubiquitous towards star forming regions in the Galactic plane, and this is significant as they could themselves undergo collapse to form stars (Molinari et al. 2010a; André et al. 2010). In fact, Peretto & Fuller (2009) have listed a filamentary structure towards IRAS 18511 in their catalog of Spitzer dark clouds.
Details of the sources from UKIRT-GPS, 2MASS and Spitzer-IRAC.
Using near and mid-infrared colours, we identified 16 young stellar objects in this region in our earlier study (VTW07). We have also previously carried out cluster simulations of a young embedded cluster whose results are consistent with a cluster comprising Class I and Class II sources. The presence of high-extinction knots and filamentary structures towards this region has been explained as arising due to compression by stellar winds from cluster members based on simulations by Rodríguez-González et al. (2008). That the cluster members are highly embedded is evident from the high extinction values obtained from the submillimetre maps (VTW07) with the peak visual extinction towards IRAS 18511 being approximately 86 mag. The extinction towards this region has also been explored by Godard et al. (2012) using the 3.4 μm absorption feature (characteristic of diffuse interstellar medium – ISM) and they cite association with a remnant diffuse cloud as one of the reasons for explaining the exceptionally high values of optical depth of this feature.
Our main objective in the present study is to examine the nature of the cluster members in IRAS 18511. The near and mid-infrared emission towards the cluster is shown in Fig. 1. More than two-thirds of the luminosity of this region is driven by the brightest object here, 2MASS18533788+0150305 or IRAS 18511-A (designated S7 following VTW07). Some of the cluster members identified by VTW07 are also shown in the figure. The selection of cluster members in VTW07 was based on colour-colour diagrams (using near and mid-infrared wavebands). In order to confirm the nature of the objects and whether or not they are a part of the young embedded cluster, we have carried out near-infrared spectroscopic observations of objects bright in the K-band. In addition, K-band spectroscopy can be used to probe the presence of ionised and shocked gas in the immediate vicinity of the young stellar objects through the Br-γ and H2 lines. We also carried out ground-based high-resolution imaging of this region in the mid-infrared for the following reasons: (i) to probe the nature of extended morphology of S7 observed in the IRAC 8 μm image which is saturated, shown in Fig. 1a; and (ii) to resolve other bright mid-infrared sources that might be present in this region. Further, we examine the extinction due to silicates towards the cluster members bright in mid-infrared. In addition, we have explored the far-infrared emission of this region using images from the Hi-GAL survey of the Herschel Space Observatory. In this paper, we present the results of these observations and examine a few individual cluster members in detail. In Sect. 2, we outline the observations whilst the results are presented in Sect. 3. These are discussed in detail in Sects. 4 and 5. Finally, a summary of our results is presented in Sect. 6.
2. Observations and data reduction
The near and mid-infrared observations of IRAS 18511 were carried out using the ESO Telescopes at the La Silla and Paranal Observatories under the programme ID 079.C-0166.
2.1. Near-infrared spectroscopy using NTT-SOFI
The objects in the region associated with IRAS 18511+0146 for which near-infrared spectroscopic observations were carried out using the Son OF Isaac (SOFI) instrument (Moorwood et al. 1998) are shown in the K-band image of the UKDISS Galactic Plane Survey (UGPS; Lawrence et al. 2007; Lucas et al. 2008) in Fig. 1b. The details of these sources are given in Table 1. Whilst seven sources are selected from the list of young stellar objects compiled in VTW07 (Table 1), the spectra of two additional sources in the vicinity were also taken. These sources are denoted by AS1 and AS2. The H and K magnitudes of the targets listed in the table are taken from the UGPS archive (Hambly et al. 2008).
SOFI is an infrared spectrometer located at the Nasmyth A focus of the ESO 3.6 m New Technology Telescope (NTT) located at La Silla, Chile. The observations were carried out during the nights of 23rd and 25th July, 2007. The red grism with a slit of width 1′′ and pixel scale 0.̋292 per pixel was used. This achieves a slit length of 4.́8. We used the low spectral resolution mode, with a resolving power of R ~ 600, covering a wavelength range 1.53−2.52μm. Taking advantage of the long slit, the spectra of nine objects were taken using six slit positions. The exposure times ranged from 200 to 480 s depending on the magnitude of the source. The typical seeing was less than 1′′ except for the case of S7 where the seeing was closer to 2′′. In order to remove the effects of the telluric absorption features from the spectra, a star with a similar airmass was observed as the telluric standard. We observed Hip089677 (spectral type B5V) and Hip101505 (spectral type B3IV) during 23rd and 25th July, 2007, respectively.
The data reduction was carried out using the IRAF package. In brief, the bad pixels were corrected followed by flat-fielding of all the images (source as well as standard star) to correct for any artifacts or distortions caused by pixel-to-pixel variation in sensitivity. The remaining sky background was removed by subtracting one of the (paired) dithered frames from the other. The wavelength solution from the arc image (xenon lamp), which was also corrected for pixel-to-pixel variations, was applied to the images. The source as well as standard star spectra were then extracted using the task “apextract” in IRAF. Features intrinsic to the standard star were identified using Meyer et al. (1998) and Wallace & Hinkle (1997) and removed from the source spectra by linearly interpolating over them. The telluric features from the standard star spectrum were aligned with the source spectra by cross-correlating them. The source spectra were then divided by the standard star spectrum followed by multiplication of a black-body curve with the Teff corresponding to the standard star. Finally, the flux levels were scaled to achieve the best possible agreement between the spectral data and the H and Ks photometric fluxes of the object after correcting for the response functions of the latter in the two bands.
2.2. Mid-infrared imaging and spectroscopy using VLT-VISIR
We carried out mid-infrared imaging and spectroscopic observations of the IRAS 18511+0146 region using the ESO-VLT imager and spectrograph VISIR (Lagage et al. 2004), mounted on the Cassegrain focus of the VLT Unit Telescope 3 (Melipal). The observations were carried out on the nights of 26th and 27th July, 2007.
2.2.1. Imaging
The imaging was carried out with a scale of 0.̋127 per pixel leading to a field-of-view of 32.̋3 × 32.̋3. Two adjacent fields covering S7 and S11 respectively, were imaged in various bands. The imaging of these fields was carried out using various N-band filters such as ArIII (8.99 μm), SiV_1 (9.82 μm) and SiV (10.49 μm), as well as the Q1-band (17.65 μm). In addition, the field covering S11 was also imaged using the PAH1 (8.59 μm), PAH2 (11.25 μm), PAH2_2 (11.88 μm) and Q3 (19.5 μm) filters. The optical seeing was better than 0.̋8 throughout the observations. The airmass at the time of observations varied in the range 1.1−2.0. A number of standard stars were observed for calibration in order to maintain conditions of similar airmass through filters for both the fields. These include HD 198048, HD 78788, HD 22663, HD 16815, HD 187150, HD 18695, and HD 199642. Chopping as well as nodding were carried out in order to minimise the background. The integration time ranged between 15 and 40 min depending on the source and filters used.
The VISIR data reduction pipeline provided by ESO was used to reduce the data. This involves coadding the elementary images to obtain chopping-corrected data to remove the high mid-infrared background. The residual background was finally removed by combining the nodding positions to create the final image. The full-width at half maxima (FWHM) in the different wavelength bands are ~0.̋32–0.̋35 in the N-band and ~0.̋5 in the Q-band.
2.2.2. Spectroscopy
The spectroscopy of S7, S10 and S11 were carried out in N-band during the night of 27th July, 2007, using a slit of size 0.̋75 × 32.̋3. All but one spectroscopic observation were carried out in the low resolution mode (R ~ 350) within the spectral range 7.7 to 13.5 μm. Several standard stars were observed through the gratings under conditions of similar airmass as the science targets. These include HD 188154, HD 199642 and HD 4815. The integration time ranged between 10 and 35 min depending on the source being observed. The brightest object, S7, was also observed using the high-resolution (R ~ 25 000) grating centered on the [Ne ii] line at 12.81 μm. Here the integration time was 60 min. For the high-resolution observations, calibration was carried out by observing the asteroid Hygieas. In all the observations, chopping and nodding were carried out to minimise the background.
The VISIR spectroscopic pipeline provided by ESO was used for data reduction, where the images are first corrected for chopping and nodding followed by correction using a reference frame of the infrared background. The next step involves the extraction of the spectrum. This is carried out by summing over the pixels within the line profile along the spatial axis for the positive as well as the negative beams that are present. The values corresponding to the negative beams are subtracted from the positive beams. The spectrum thus obtained is then calibrated in wavelength using the atmospheric lines from the background frame and any wavelength shift, if present, is corrected for. The spectrum is divided by the corresponding spectrum of the standard star observed under similar conditions of air-mass to remove the effect of the telluric features. The flux calibration is carried out by multiplying this resultant spectrum with the modelled spectrum of the standard star.
2.3. Far-infrared images using the Herschel Hi-GAL survey
We also used far-infrared images from the Herschel Infrared Galactic Plane survey (Hi-GAL; Molinari et al. 2010b) carried out by the Herschel Space Observatory. The Herschel Space Observatory carrying a 3.5-m passively cooled telescope was launched in May 2009 by ESA (Pilbratt et al. 2010). It consists of three instruments: Photodetector Array Camera and Spectrometer (PACS), Spectral and Photometric Imaging REceiver (SPIRE) and Heterodyne Instrument for the Far Infrared (HIFI).
The Hi-GAL survey used the two instruments: PACS (Poglitsch et al. 2010) and SPIRE (Griffin et al. 2010) in parallel mode, to carry out a survey of the inner Galaxy (| l | ≤ 60°, | b | ≤ 1°) in five bands: 70, 160, 250, 350 and 500 μm. The reduced and calibrated images provided by the Hi-GAL team have been used here. A flux calibration uncertainity of 15% is considered (Ward-Thompson et al. 2010). The resolutions of the SPIRE images are 18.̋5, 25.̋3 and 36.̋9, at 250, 350 and 500 μm bands, respectively. The point spread functions of the PACS images at 70 and 160 μm are 5.̋8 × 12.̋1 and 11.̋4 × 13.̋4, respectively. The scan speed and direction decide the elongation in the images (Molinari et al. 2016). The pixel sizes are 3.̋2, 4.̋5, 6.̋0, 8.̋0 and 11.̋5, at 70, 160, 250, 350 and 500 μm, respectively. These Hi-GAL images have been used to investigate the flux density distribution and to construct the temperature and column density maps of the region associated with the protocluster.
3. Results
3.1. Near-infrared identification of cluster members
The near-infrared HK spectra of the sources in the IRAS 18511 region are shown in Fig. 2. The gap in the spectra between 1.8 and ~ 2.05μm is due to the presence of strong telluric water absorption. The sources S4 and S5 show decreasing continua, while all the other sources have fluxes increasing with wavelength. The Br-γ line is seen in emission towards S7, S9 and S11 and there is a marginal detection towards AS1. A magnified view of the wavelength range around the Br-γ emission towards these sources can be seen in Fig. 3. S9 appears to have broad red and blue wings in the Br-γ emission profile whilst S7 shows hints of broadening towards the red edge. The ro-vibrational H2 S(1–0) line at 2.12 μm, associated with shocked gas from outflows, is not detected in any spectrum. A number of absorption lines are seen in the spectrum of S9 (discussed below).
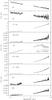 |
Fig. 2 Near infrared HK spectra of objects in the region associated with IRAS 18511. The gap in the spectra between 1.8 and 2.1μm is due to atmospheric absorption. |
S7, the brightest member of the cluster, is believed to be a very young intermediate mass/massive pre-main sequence star (VTW07). The spectrum of S7 is featureless with the exception of the Br-γ line emission. The flux in the Br-γ line is ~ 3.6 × 10⁻¹³ erg cm-2 s-1. The 3σ upper limits to the H2 emission corresponds to 1.1 × 10⁻¹³ erg cm-2 s-1. S8, S10 and S11 are classified as Class I sources based on mid-infrared colours and show positive slopes of the SED between near and mid-infrared wavebands (VTW07). Apart from Br-γ emission towards S11, all the spectra are relatively featureless. The absence of any absorption lines in the spectra of these sources is strikingly similar to that of low mass Class I young stellar objects, whose featureless spectra are explained by Greene & Lada (2000) on the basis of high continuum veiling due to the surrounding circumstellar emission.
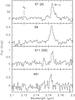 |
Fig. 3 Continuum subtracted spectra of S7, S9, S11 and AS1 showing Br-γ line emission. The location of H2 (1–0) S(1) line is also shown. |
The sources S4 and S5 are located close to one another, with a separation of 2.̋5. They have low near-infrared excesses (J−H ~ 0.3−0.5; H−K ~ 0.5−0.8) and are not detected in mid-infrared (Spitzer-IRAC) images. We searched the optical images to locate their optical counterpart(s) and found an optical source in the Digital Sky Survey (DSS) red and blue images. However, the resolution of DSS images is relatively poor (~ 5′′) and it is not possible to distinguish if either or both emit in optical. However, both are relatively similar and their spectra do not show any features either in emission or absorption. Although these sources are located close to S7 in projection (within 8′′), the extinction towards the latter is high as it is invisible in optical images. S4 and S5, on the other hand, suffer low extinction as they are visible in optical and therefore, they are likely to be late type foreground objects. The absence of absorption lines can be explained by the veiling due to circumstellar dust that gives rise to the infrared excess.
AS1 and AS2 are sources that were not considered for the classification of young stellar objects in VTW07 as they were not detected in the Palomar J-band image but were detected in H and K-bands. Their locations as well as infrared colours (H−K ~ 2.6 and 2.1, respectively) suggest that they are likely to be young stellar objects. They are, however, not detected in the mid-infrared images (Spitzer-IRAC and VISIR), implying lower flux densities and consequently, low-mass young stellar objects. Furthermore, their spectra do not show indications of any absorption or emission lines, other than the marginal detection of Br-γ emission from AS1 at the 2σ level (Fig. 3).
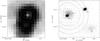 |
Fig. 4 Left: IRAC image of S7 at 8.0 μm with the 17.7 μm emission shown as solid line contours. Right: S10 and S11 through 8.6 μm (PAH1) filter. An ellipse is drawn to show the location of S11′, diffuse emission associated with S11. The dashed contours in both panels represent the radio emission at 8.5 GHz at levels 0.04, 0.08, 0.1 and 0.12 mJy/beam (left) and 0.2, 0.3, 0.4 and 0.55 mJy/beam (right) where beam size is 9.̋2 × 7.̋5 (Sánchez-Monge et al. 2011). |
S9 is unique among our sample as it displays a number of absorption lines other than the Br-γ emission line. These include the atomic blended lines of [Na i] doublet (2.206 and 2.209 μm), [Ca i] triplet (2.261, 2.263 and 2.266 μm) and molecular CO absorption bandheads. The CO bandheads at 2.239 (ν = 2−0), 2.323 (3–1), 2.353 (4–2), 2.383 (5–3), 2.414 (6−4) and 2.446 μm (7–5) corresponding to δν = 2 are detected. However, the [Fe ii] line at 1.643 μm characteristic of shocked gas is not detected. The stronger red continuum would seem to imply that this is a young stellar object as the atomic lines and molecular bandheads in absorption, as well as Br–γ emission are also seen in spectra of low-mass Class II and flat spectrum objects (Greene & Lada 1996). However, a closer inspection of the spectrum shows that the 13CO absorption bandheads are also resolved, and other blended lines such as [Fe i] lines at 2.227 and 2.239 μm (Förster Schreiber 2000) are also detected. These two features (13CO bandheads and Fe lines in absorption) are seen towards late-type evolved stars such as KM giants and dwarfs (Wallace & Hinkle 1997). These objects, however, usually do not show Br-γ in emission. If Br-γ is present, it is in weak absorption. The equivalent widths of the absorption lines are relatively large: [Na i]–5.6 Å, [Ca i]–4.3 Å, CO(ν = 0−2)–14.2 Å and Br-γ in emission: 8.4 Å. If we do not consider the Br-γ emission, the spectrum can be said to convincingly belong to a late spectral type evolved object for the following reasons: (i) The clear detection of 13CO counterparts along with 12CO bandheads also favours evolved later-type objects (Kraus 2009). (ii) The presence of atomic Fe I absorption lines is seen only towards evolved late-type objects. (iii) The atomic and molecular absorption features are very strong with relatively large equivalent widths that are seen towards objects with lower surface gravity (Comerón et al. 2004). Nevertheless, it is important to note that a few Class III young stellar objects with large equivalent widths in the absorption lines of [Na i], [Ca i] and CO have been observed such as Hubble 4, and HBC 360 among the sample of Greene & Lada (1996). Although all of this strongly suggests that S9 is an evolved late-type spectral object, we cannot ignore (i) the presence of Br-γ emission whose equivalent width is 8.4 Å; and (ii) a rising red continuum. The latter can be explained by the presence of large extinction towards S9. We also compared S9 with the spectra of FU Orionis-type objects that show features in their post-eruption phase similar to late-type objects (Reipurth et al. 2002). Further, FU Orionis-like stars have not been observed to clearly show Br-γ emission. In this regard, Connelley & Greene (2010) speculate that the relationship between Br-γ emission line flux and mass accretion collapses at very high mass accretion rates. Hence, there is a possibility that S9 could be a post-outburst object with the spectrum showing features of transition to that of a later spectral type. Since Br-γ emission has been detected from nearly 50% of low-mass young stellar objects (Greene & Lada 1996) and 75% of massive young stellar objects (Cooper et al. 2013), its presence in S9 compels us to consider other possibilities that can explain all the features. It is possible that S9 is an evolved late-type star that shows variability in Br-γ emission similar to HR7564 χCyg (Wallace & Hinkle 1997), although it is weak in the latter object. Alternately, there is a remote possibility of two objects (young stellar object and evolved object) being projected towards the same line-of-sight. Finally, one cannot rule out both objects being part of a binary system.
It is interesting to note that if we assume that all objects other than S4, S5 and S9 are young, embedded and belong to the cluster, then we have been able to detect Br-γ from three out of six sources. Our sample is obviously too small to derive reliable statistics. Nonetheless, our finding that approximately half of the sample shows detectable Br-γ emission, is consistent with other studies of young stellar objects in groups (Greene & Lada 1996; Cooper et al. 2013).
3.2. Cluster members in mid-infrared
Mid-infrared emission from a young stellar object arises when small dust grains in its vicinity (e.g. from disk or envelope) are heated by far-UV photons and the spatial extent of the emission is determined by the optical depth of these dust grains. Our ground-based mid-infrared images show compact (unresolved) emission from S7, S10 and S11. The emission from the brightest infrared object in this region, S7 at 17.7 μm is shown as solid line contours in Fig. 4 (left) while the emission through the PAH1 filter at 8.6 μm from the field covering S8, S10 and S11 is shown in Fig. 4 (right). A comparison with IRAC images from Spitzer-GLIMPSE in VTW07 indicates that the source S8 which lies in the field of S10 and S11, is barely detected at 8.6 μm in Fig. 4 (right).
Figure 4 (left) shows the emission from S7 through the 17.7 μm filter band overlaid on the IRAC 8 μm image. We perceive that the high-resolution VLT-VISIR image of S7 is unresolved unlike the IRAC 8.0 μm image that shows extended emission and is saturated. This suggests that the extension seen in the Spitzer-IRAC 5.8 and 8.0 μm images is probably an artifact. The emission from S10 and S11 at mid-infrared wavelengths in Fig. 4 (right) shows the presence of diffuse emission in the vicinity (~0.̋8) of S11 towards the north as well as west of S11, with stronger emission towards the north-west. We call this emission knot S11′. This emission (size ~ 2′′ × 1′′) is particularly strong in the PAH filters: 8.6 μm (PAH1) and 11.3 μm (PAH2). Further, this emission from S11′ is stronger at the longer wavelength Q-bands at 17.7 and 19.3 μm, implying a rising SED.
Photometric mid-infrared fluxes of sources associated with IRAS 18511 observed using VLT-VISIR.
The flux densities of the sources S7 and S10 have been extracted by using aperture photometry with an aperture radius of 1′′ and a background annulus of thickness 1′′ located at a distance of 4′′ from the centre of the aperture. This method cannot be used to extract the flux of S11 due to the presence of S11′ in the vicinity. For S11, we fitted a Gaussian distribution along with a constant function (corresponding to the background) and extracted the flux by integrating the emission under this distribution after subtracting the background emission. To estimate the flux densities from S11′, we used a smaller aperture of diameter ~ 0.̋8 and the background has been estimated using an aperture of similar size in the vicinity where there is no detectable emission. The calibration of fluxes has been carried out using the standard stars. The error in photometry is ~ 15%, which is mainly due to the uncertainity in the fluxes of standard stars as well as due to airmass corrections. The flux densities of S7, S10, S11 and S11′ are listed in Table 2.
S11′ is not detected at near-infrared wavelengths, and has been detected solely in the PAH bands as well as the longer wavelength 17.7 and 19.3 μm bands (see Table 2). This is evident from its mid-infrared spectrum shown in Fig. 5. S11′ could either be a faint embedded object (that has bright PAH features) enveloped in diffuse emission, or a diffuse emission knot associated with S11. It is difficult to deduce the nature of S11′ from the present mid-infrared images alone and necessitates higher sensitivity images.
The mid-infrared spectra of S7, S10, S11 and S11′ are shown in Fig. 5. The spectrum for S11′ has discontinuities near ~ 9.8 and ~ 13μm as the emission is weak and noise dominates. The spectra of all the sources show silicate absorbtion features. Closer inspection reveals that the silicate profile features appear different for S7, S10 and S11 (discussed later in Sect. 4). The Polycyclic Aromatic Hydrocarbons (PAHs) emission at 8.6 μm and 11.2 μm is only seen towards S11′. The flux in the PAH1 band is larger than that in PAH2 band as the measured fluxes are 5.6 × 10⁻¹³ and 3.4 × 10⁻¹³ erg s-1 cm-2 in the 8.6 and 11.2 μm bands, respectively.
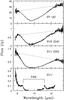 |
Fig. 5 Mid-infrared spectra of bright cluster members in the IRAS 18511 region along with the spectrum of S11′. The dotted line in each panel represents the fitted continuum. |
In order to obtain the optical depth profiles of these sources, we fitted and subtracted a linear function to the continua represented by flux densities below 8 μm and longer than 12.7 μm. The differences are negligible (<5%) when the continuum is considered as a second-order polynomial. The continua of S7 and S10 show an increase with wavelength while the continuum of S11 shows a negative power law slope. The optical depth profiles are estimated using the expression corresponding to the solution of the radiative transfer equation in the absence of emission.  (1)
(1) (2)Here Iobs is the observed flux at a given wavelength within the absorption profile and Io(λ) = Icont(λ) represents the fitted continuum. The properties of the silicate profiles including the peak optical depth are listed in Table 3. The optical depths peak at wavelength ~ 9.6−9.7μm and the maximum optical depth values range between 1.8 and 3.2. We have normalised the optical depth profiles at the longward end of the absorption, at 11 μm (van Breemen et al. 2011). The normalised optical depth profiles are shown in Fig. 6 and discussed in detail in the following section. The FWHM of the profiles are ~ 1.6 and 2.0μm for S7 and S11, respectively.
Details of silicate absorption features and extinction towards cluster members.
The mid-infrared spectra do not show evidence of the [Ne ii] line at 12.81 μm from any of the studied objects. Although radio continuum emission and Br-γ line emission have been detected towards S7 and S11, we have not detected [Ne ii] towards them. Our aim in carrying out the high-resolution spectroscopy of S7 at 12.8 μm was to search for the presence of the [Ne ii] line. This high-resolution spectrum is shown in Fig. 7. It allows us to put an upper limit of 3 × 10-14 erg s-1 cm-2 on the [Ne ii] line from S7. The upper limits obtained for S10 and S11 are 7 × 10-14 and 4 × 10-14 erg s-1 cm-2, respectively.
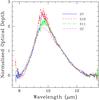 |
Fig. 6 Opacity profiles of the silicate feature of the cluster members (solid line, short-dashed line and long-dashed line) normalised at 11 μm. Also shown is the silicate profile of the Galactic centre (dot-dashed line) from Chiar & Tielens (2006). |
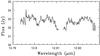 |
Fig. 7 High-resolution mid-infrared spectrum of S7 near the [Ne ii] line. |
3.3. Far-infrared emission
All the Hi-GAL emission maps show the brightest emission towards S7. At 70 and 160 μm, we see two emission peaks. The brighter one corresponds to S7 while the secondary peak corresponds to S10 and S11. At longer wavelengths, we see only one peak as the latter are not resolved. The Hi-GAL images are shown in Appendix A.
Since the cluster is embedded in the molecular cloud, it is instructive to obtain the temperature and column density distribution of this region. It is possible to construct these maps on the scale of one pixel using the five far-infrared Hi-GAL wavelengths, JCMT SCUBA maps at 450 and 850 μm (VTW07), ATLASGAL (Schuller et al. 2010; Csengeri et al. 2014), and SEST-SIMBA (Beltrán et al. 2006). This would involve regridding and convolving all the images to the lowest resolution of 36.̋9 corresponding to the Hi-GAL 500 μm image. As the long wavelength regime (>100 μm) is well sampled, we prefer to construct higher angular resolution images (18.̋5) of column density and dust temperature using fewer far-infrared images. For this, we use the Hi-GAL images at 70, 160 and 250 μm as well as the JCMT-SCUBA images at 450 and 850 μm. As the pixel sizes and resolutions are different for these images, we first regridded and convolved the images to the largest pixel size (6′′ × 6′′) and lowest resolution (18.̋5) corresponding to the 250 μm image using the Herschel interactive processing environment (HIPE). The kernels used for convolution of the PACS and SPIRE images are those given by Aniano et al. (2011). For the SCUBA images, we used Gaussian kernels of size 10′′ and 15.̋5 at 450 and 850 μm, respectively. In this way, we obtained images at five wavelengths between 70 and 850 μm with identical resolution, pixel size and pixel orientation. For every pixel, a SED was constructed (Ward-Thompson et al. 2010; Faimali et al. 2012) using the flux density values (Fν) and fitted with a modified blackbody spectrum of the form:  Here, Ω corresponds to the solid angle of the pixel, TD is the dust temperature, τν is the optical depth, mH is the mass of hydrogen atom, μ is the mean molecular weight in units of mH, kν is the dust opacity and N(H2) is the molecular hydrogen column density. For a gas-to-dust mass ratio of 100, the dust opacity was assumed to vary with frequency as follows (Hildebrand 1983; Beckwith et al. 1990; André et al. 2010).
  (5)where β is the dust emissivity index. Recently, there has been a lot of work on trying to understand factors that contribute to β and its variation towards star forming regions, molecular clouds, and the diffuse ISM (Dupac et al. 2003; Paradis et al. 2010). Considering that our region of interest is relatively small (~ 2 arcmin2), we neglect any change in the value of β and assume a constant value of 2 found towards many star-forming regions (Ward-Thompson et al. 2002; Sadavoy et al. 2013). The best fits were obtained using nonlinear least squares Marquardt-Levenberg algorithm, considering N(H2) and TD as free parameters. Based on other studies, we assumed flux uncertainties of the order ~ 15% in all the bands (Launhardt et al. 2013).
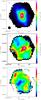 |
Fig. 8 a) Column density map of N(H2); b) Dust temperature map; and c) |
The column density, dust temperature and reduced chi-square ( ) maps are shown in Fig. 8. Both the column density and temperature peak near S7. For further analysis, we consider a region within the 35% contour level of the peak emission at 500 μm towards IRAS 18511. This excludes the contribution of a neighbouring source C (VTW07). An additional reason is that the emission from filamentary structures in the vicinity makes it difficult to disentangle the effect of filamentary and background emission from the cloud. This region (encircled within the dashed line over the column density image shown in Fig. 8) is also used to estimate the bolometric flux described later, in Sect. 5. For all pixels within this region, the modified blackbody fits are quite good as
  . The blackbody fit corresponding to the pixel with the maximum column density is shown in Fig. 9. The temperature values range between 18.6 and 26.2 K with errors between 0.5 and 1.9 K. The column density values in this region (1.6 × 1.2 pc2) range from N(H2) ~ 0.3 to 7.3 × 1022 cm-2 with errors ranging between 13 and 23%. By integrating the column densities within this region, the total mass for this region is estimated to be 920 ± 17M⊙ . Assuming this mass to be distributed in a spherical volume of radius 0.7 pc, we obtain a mean density of nH = 2.8 × 104 cm-3. The mass estimate determined is consistent with the estimates of 750−1310M⊙ obtained by VTW07 based on SCUBA 850 μm emission for the same dust emissivity coefficient, but larger than 559 M⊙ estimated by Beltrán et al. (2006) who use an opacity of κ = 1 cm2 g-1 at 1.2 mm wavelength. Using C18O emission, Watt & Mundy (1999) estimated the mass to be 826 M⊙. The low N(H2) column density structures tracing cold dust filamentary emission extending north-east and south-west are visible in blue in the column density and temperature maps. The column density closely follows the longer wavelength fluxes.
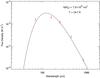 |
Fig. 9 Modified blackbody fit to the flux densities corresponding to the pixel with maximum column density (J2000 coordinates 18h53m38.08s +01°50′30.5′′). |
In the dust temperature distribution, apart from the hottest region near S7, we observe a high temperature shoulder extending south-east towards S10 and S11. The high temperature regions indicate active star formation. In addition, we see low temperature region (15−18 K) towards the north-east and south-west. These correspond to the filamentary emission seen in the column density map.
4. Silicate absorption
In this section, we discuss results obtained using the mid-infrared spectra towards S7, S10 and S11. Silicate absorption as a measure of extinction and the nature of dust along the lines-of-sight of these three objects are discussed.
4.1. Measure of extinction
For dust in diffuse ISM, the optical depth at 9.7 μm obtained from the silicate absorption feature is known to correlate with extinction (Mathis 1998) as 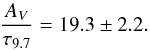 (6)The extinction values obtained using this relation are listed in Table 3. The visual extinction values of the cluster members lie between 35 and 62 mag implying that these are deeply embedded objects. However, it is important to realise that the above AV relation does not hold for all diffuse lines-of-sight and that an extrapolation of this relation from diffuse lines-of-sight to molecular clouds is not reasonable as the types of silicates encountered there are likely to be different. Chiar et al. (2007) have investigated the silicate features in dense clouds and they show that the optical depth does not increase monotonically with extinction. These authors find that with a few exceptions, τ9.7 falls well below the diffuse ISM correlation line. This would imply that the extinction values are actually larger than the values obtained here. Thus, according to the relations obtained by Chiar et al. (2007), the estimates of visual extinction listed in Table 3 can be considered as lower limits.
Irrespective of the magnitude of extinction, what is reliable is the relative extinction between objects within the same molecular cloud. Our results indicate that among the luminous young stellar objects/protostars, the most deeply embedded object appears to be S11, followed by S10 and then S7. This is consistent with the optical depth values obtained for the 3.1 μm water ice feature detected towards these three objects (Godard et al. 2012). The contribution of diffuse ISM towards these three lines-of-sight, investigated by the same authors using the 3.4 μm aliphatic hydrocarbon feature, is found to be almost constant. If we assume a ratio of AV−ISM/τ3.4 = 250, this corresponds to an interstellar extinction of AV−ISM ~ 16−18 mag. This can be used to estimate lower limits to extinction due to the molecular cloud and circumstellar extinction, that is, AV−mc. In our case, AV−mc would be in the range 20−45 mag. The values of AV−ISM and AV−mc are tabulated in Table 3.
4.2. Nature of dust
The dust along the line-of-sight to an embedded young stellar object comprises contributions from the diffuse ISM, the dense molecular cloud as well as the circumstellar environment, that could also include high extinction regions such as an accretion disk. In this section, we investigate the silicate features towards the cluster members S7, S10 and S11 and compare them relative to one another as well as with the silicate profiles observed towards other regions.
The optical depth profiles of the cluster members are shown in Fig. 6 with the profiles peaking near the wavelength 9.6−9.7μm. A relative comparison shows that the profiles towards S7 and S10 (Table 3) are similar whereas there are a few differences towards S11. This is also evident from Fig. 5. This would seem to imply either a change in the circumstellar environment or an effect of disk inclination towards these objects. S10 is closer to S11 in projected distance (separation of 5′′ ~ 0.1 pc), while the luminous object S7 is located at a projected distance nearly three times further away (projected separation 17′′ ~ 0.3 pc). Thus, the circumstellar conditions can play a vital role in the appearance of the silicate feature even within the same molecular cloud. A closer inspection would necessitate knowledge of the nature of dust along the lines-of-sight.
The shape and peak of the silicate absorption feature is decided by the size, composition, shape and type (amorphous/crystalline) of dust grains. The peak absorption at 9.6 μm is consistent with that seen around massive protostars (Demyk et al. 1999). The models used for describing the dust towards such massive embedded objects invoke the presence of amorphous pyroxenes to explain the shift in peak towards shorter wavelengths from 9.7 μm found towards diffuse ISM. For example, Kemper et al. (2004) modelled the dust towards the Galactic centre as having almost 15% amorphous pyroxenes and 85% amorphous olivines by mass for spherical sub-micron-sized grains. The width of the silicate profiles is narrower towards S7 and S10, Δλ ~ 1.6μm, while it is broader towards S11, Δλ ~ 2.0μm. These widths are relatively narrow when compared to the diffuse ISM as well as massive protostars. The widths of features towards massive protostars are broad (~ 2.3−3.5μm ), an indication of coagulated grains. The broad features have been perceived as porosity of grains in modeling (Demyk et al. 1999) or chaotic effects of processing in laboratory experiments on silicates (Jaeger et al. 1994). In fact, Bowey et al. (2003) found a bimodal distribution when they plotted the peak absorption wavelength versus the width (FWHM). For sources with absorption peaking at 9.6 μm, they found the widths are relatively broad 3.4μm, while the narrower profiles (~ 2.6μm) peak at 9.8 μm. Kessler-Silacci et al. (2005) investigated the shape and peaks of the silicate absorption feature for a number of embedded young stellar objects. They find the features peak at the constant wavelength of 9.6 ± 0.2μm while the FWHM varies between 1.8 and 3.2 μm.
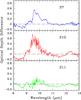 |
Fig. 10 Difference spectra of the silicate optical depth profiles between the observed and Galactic centre (GC) of the sources S7, S10 and S11. |
We compare our silicate profiles to that of dense ISM in the line-of-sight towards Galactic centre from Chiar & Tielens (2006). This comparison is shown in Fig. 6. Our normalisation at 11 μm shows that the profiles match well for wavelengths longer than 10.4 μm and shorter than 8.7 μm. To visualise this better, we have plotted the difference spectra with respect to the Galactic centre in Fig. 10 following van Breemen et al. (2011). The differences are relatively large for S7 and S10. S11 shows smaller differences indicating that the dust composition is similar to that of Galactic centre. For S7, the signal-to-noise ratio is larger and the difference spectrum clearly shows substructure in the silicate profiles. There are two peaks, one at 9.6 μm and the other at 9.8 μm. This could be either due to the combination of silicates of different composition along the line-of-sight, that is, interstellar and circumstellar silicates or due to ice features. Bottinelli et al. (2010) find substructures within the silicates feature (8–13 μm) that they attribute to ices such as NH3 at 9 μm and CH3OH at 9.7 μm. In fact, a prominent water ice absorption feature at 3.4 μm has been detected towards this region by Ishii et al. (2002). We also see two plateaus at 40% level around 10.4 μm and 9.3 μm in the difference spectrum of S7. The plateau near 9.3 μm is also seen for S10 and S11. This implies that there is more absorption towards S7 and S10 between 9.3 and 10.4 μm when compared to ISM. On the other hand, this difference is not so marked in the case of S11. The profile of S11 matches remarkably well with the Galactic centre profile. For S10, there is absorption at wavelengths shorter than 8 μm that is not seen towards S7 and S11 (Fig. 5). A search for prominent ice features detected at wavelengths close to but shorter than 7.5 μm shows that there is a feature at 6.0 μm (mostly due to amorphous water ice), an unidentified feature at 6.9 μm (Knez et al. 2005) usually attributed to NH (Schutte & Khanna 2003) and a 7.7 μm CH4 ice feature. The shorter wavelength absorption (i.e. λ ~ 7.7μm) in S10 is at least 20% that of the silicate feature while the 7.7 μm CH4 ice feature is usually very weak (Boogert et al. 2008), indicating that this absorption in S11 is likely to be the red edge of the 6.9 μm absorption feature seen in the spectra of several protostars, including massive ones (Keane et al. 2001). Thus, the silicate features imply that the cluster members are deeply embedded objects, and ices are important constituents here.
We also note that the mid-infrared SED of S11 shows a decrease at wavelengths longer than 12.5 μm (see Fig. 5). This could be due to one of the two scenarios: either we are seeing the blue edge of the silicate 18 μm broad absorption feature, or a decrease in continuum fluxes. We are inclined to think it is the former because photometry shows that the flux is lowest at 17.7 μm as compared to 12 μm and 19 μm (Table 2), with lower likelihood of a decreasing SED in mid-infrared. For S10, the photometric fluxes are increasing in wavelength and silicate absorption if present at 18 μm is likely to be weak. For S7, we do not have photometric fluxes close to 18 μm to be able to comment on the nature of the 18 μm silicate absorption. The consequence of the above is that, the dust composition and distribution is different along the lines-of-sight of S11, as compared to S10 and S7 (as both of these show similar difference spectra for silicate profiles at 10 μm discussed earlier). An interesting implication (if we assume similar silicate composition) would be that the radiation environment modifies the shape of the silicate features in embedded early evolutionary stages. This is discussed in the following section where we discuss the evolutionary stages of cluster members on the basis of other tracers. As the composition of silicates is unlikely to change over scales of 0.1 pc, we speculate that the nature of silicates (fraction of amorphous/crystalline content), presence of ices along the line-of-sight and coagulation leading to porosity could be a few reasons for the differing silicate profiles. It is possible that these objects are associated with disks and the differing silicate profiles could be due to variations in the disk inclination along the line-of-sight, since it is known that the grain properties in disks undergo modifications (Meeus 2009).
5. Evolutionary stage of cluster members
IRAS 18511 has been investigated spectroscopically in near and mid-infrared in order to understand the nature of the cluster members. Of the nine sources examined in near-infrared, the six objects that have high probability of belonging to the cluster are S7, S8, S10, S11, AS1 and AS2 (as discussed in Sect. 3.2). Among these, the three brightest at mid-infrared (S7, S10 and S11) have been examined further using mid-infrared imaging and spectroscopy. The remaining cluster members (S8, AS1 and AS2) with rising near-infrared SEDs are faint in mid-infrared and are likely to be lower-mass young stellar objects. The luminosity of this region is driven by S7, S10, and S11. These three belong to the same cloud/clump as the long wavelength (sub)millimetre images (such as JCMT) and show a single clump with emission peaking at the location of S7 and a shoulder of emission towards S10 and S11.
We have constructed the SED of the cloud associated with IRAS 18511 within a region of size 1.6 × 1.2 pc2 around the peak emission. The aperture used for estimating the SED is shown in Fig. 8. As mentioned earlier, this region is selected such that the effect of filamentary structures and clumps in neighbouring regions are excluded. The SED is constructed using a number of wavelength bands: Wide-field Infrared Survey Explorer (WISE, Wright et al. 2010), Herschel Hi-GAL, MSX, JCMT-SCUBA, ATLASGAL, and SEST-SIMBA. The flux values from the IRAS-Point Source Catalog are also shown for reference. The SED is shown in Fig. 11 and the bolometric luminosity obtained by integrating under the SED is 1.8 × 10⁴L⊙.
We have estimated a limit to the bolometric luminosity of S7 by integrating the flux density within a circular region of radius 10′′ centred on S7. While the 2MASS and VLT-VISIR observations give fairly accurate flux densities of S7, the circular region is considered specifically for estimating flux densities in the images with low resolution. We have considered the flux densities as lower limits at those wavelengths where the beam size is larger than the region used for integrating the flux densities (20′′). The SED of S7 is shown in Fig. 11 in grey. By integrating under the dashed line shown in the figure, we obtain Lbol(S7) ≳ 104L⊙.
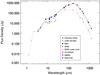 |
Fig. 11 SED of the IRAS 18 511 region using flux densities in the aperture shown in Fig. 8. The flux densities from MSX, WISE, Herschel Hi-GAL, JCMT-SCUBA, ATLASGAL and SEST-SIMBA are shown using solid circles. The triangles represent lower limits and diamonds represent IRAS-Point Source Catalog fluxes. The crosses and grey triangles represent flux densities and lower limits to flux densities of S7, respectively. In addition to the fluxes from the above mentioned images used for estimating the bolometric luminosity of S7, 2MASS and Spitzer-IRAC flux densities and lower limits have been used. The grey dashed line represents the SED under which the area is integrated to obtain a limit to the bolometric luminosity of S7. |
The young cluster associated with IRAS 18511 lies along an unusual line-of-sight. The dust and ice absorption features towards the bright cluster members show relatively large optical depths. This is evident not only from the silicate absorption feature presented here but also from the investigation of 3.4 μm absorption feature characteristic of hydrocarbons present in the diffuse ISM (Godard et al. 2012). The total luminosity of this region is 1.8 × 10⁴L⊙, the total mass of the cloud is 1140 ± 20M⊙, and dust temperature is within the range 19−26 K. The bolometric luminosity of the entire region is consistent with a single B0.5–B0 type zero age main sequence (ZAMS) star (Thompson 1984). Below, we discuss the properties of few cluster members in detail.
5.1. S7
S7 is the brightest member of the cluster across the entire wavelength regime investigated (i.e near-infrared to millimetre). Unlike the Spitzer-IRAC images (VTW07), high resolution mid-infrared images show the presence of a single object whose ZAMS spectral type is likely to be earlier than ~B0.5 based on the bolometric luminosity estimate. Weak radio emission with a flux density of 0.18 ± 0.03 mJy has been detected towards S7 at 8 GHz using sensitive EVLA measurements by Sánchez-Monge et al. (2011). This is the sole radio detection of S7 as it has not been detected at other frequencies by Sánchez-Monge et al. (2011) and VTW07. At 23 GHz, the radio emission upper limit is 0.35 mJy, implying a radio spectral index α< 0.87 between 8 and 23 GHz (Sánchez-Monge et al. 2011). In the absence of a specific spectral index value, we can only speculate on the possibilities giving rise to large spectral indices. Apart from optically thick emission from spherical and homogeneous H ii regions where α ~ 2 (Mezger & Henderson 1967), hypercompact H ii regions are believed to have steep spectral indices, α ~ + 1 (Sewilo et al. 2004). In addition, the spectral index of a spherical envelope around a hot star with an electron density distribution of the form ne ∝ r-2 (due to stellar winds, for example) is found to be 0.6 (Panagia & Felli 1975). More recently, Tanaka et al. (2016) have estimated the radio spectral index to be between 0.4 and 0.7 for outflow confined H ii regions based on the core accretion model. An approach to distinguish between the jet/wind sources and H ii regions would be to use the correlation between the radio and bolometric luminosity (Anglada et al. 2015). Tanaka et al. (2016) have used the 8 GHz radio luminosity to show that the ultracompact and hypercompact H ii regions lie in the vicinity of the Lyman continuum limit, segregated from sources classifed as massive young stellar objects with winds (their Fig. 18). We have plotted S7 in a similar figure shown in Fig. 12 where S7 is shown as a triangle with the direction of arrow-head indicating that the bolometric luminosity estimate is likely a lower limit. An implicit assumption here is that the flux density at 8 GHz is optically thin. The radio luminosity for various ZAMS spectral types at 8 GHz is shown as a solid line with the Lyman continuum flux values taken from Thompson (1984). The dashed line in Fig. 12 represents the best fit corresponding to observed radio jet sources by Anglada et al. (2015) as 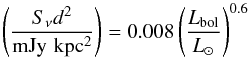 (7)where Sν is the radio flux density at 8 GHz, d is the distance to the source and Lbol is the bolometric luminosity. S7, with a luminosity larger than 104L⊙, lies in the region occupied by wind sources that are described as massive young stellar objects with ionised stellar winds. The ionised material in these radio-weak massive objects is believed to originate from winds in the star-disk system itself and these are likely precursors to hypercompact H ii regions (Hoare et al. 2007). That S7 is a likely wind source finds corroboration in the asymmetric profile of the Br-γ line in Fig. 3 with a larger red wing compared to the blue edge (vred ~ 800 km s-1).
The luminosity in the Br-γ line is 5.2 L⊙ if we consider de-reddening of the flux density by AK ~ 3.9 mag (Rieke & Lebofsky 1985) for AV ~ 35 mag derived from the silicate absorption feature. The Br-γ emission could arise from the ionisation in a star-disk interaction region (magnetospheric accretion or outflows) seen in low-mass young stellar objects such as T-Tauri stars (Najita et al. 1996; Natta & Giovanardi 1990) as well as intermediate-mass young stellar objects (Kraus et al. 2008), or from the ionisation of the surrounding molecular cloud. We are of the view that S7 is in the former phase based on considerations discussed earlier. We can get an order of magnitude estimate of the accretion luminosity if we assume mass accretion to be responsible for the Br-γ emission. The relation obtained by Calvet et al. (2004) is: ![Mathematical equation: \begin{equation} \log_{10} \left(\frac{{L_{\rm acc}}}{{L_\odot}}\right) = 0.9\times\left[\log_{10}\left(\frac{{L_{\rm Br\gamma}}}{{L_\odot}}\right) + 4\right] - 0.7 \end{equation}](/articles/aa/full_html/2017/03/aa29455-16/aa29455-16-eq196.png) (8)where Lacc and LBr−γ represent the accretion and Br-γ luminosities, respectively. This relation although proposed for low-mass young stellar objects, has been extended to intermediate-mass Herbig Ae/Be objects (Garcia Lopez et al. 2006) and applied to massive young stellar objects as well (Cooper et al. 2013). Applying Eq. (8) to LBr−γ estimated earlier, we obtain the accretion luminosity as Lacc ~ 3500L⊙ for S7. This is close to one third of the bolometric luminosity derived by other considerations above and is consistent with high accretion luminosities seen towards massive objects in the RMS survey (Cooper et al. 2013).
(8)where Lacc and LBr−γ represent the accretion and Br-γ luminosities, respectively. This relation although proposed for low-mass young stellar objects, has been extended to intermediate-mass Herbig Ae/Be objects (Garcia Lopez et al. 2006) and applied to massive young stellar objects as well (Cooper et al. 2013). Applying Eq. (8) to LBr−γ estimated earlier, we obtain the accretion luminosity as Lacc ~ 3500L⊙ for S7. This is close to one third of the bolometric luminosity derived by other considerations above and is consistent with high accretion luminosities seen towards massive objects in the RMS survey (Cooper et al. 2013).
 |
Fig. 12 Radio luminosity at 8 GHz versus bolometric luminosity. The solid line represents the radio luminosity expected from photoionisation while the dashed line represents the fit by Anglada et al. (2015) based on observed radio jets over a wide bolometric luminosity range of 1−105L⊙. The direction of arrow head indicates that the bolometric luminosity of S7 is a lower limit. |
We had carried out high-resolution mid-infrared spectroscopy in order to search for the presence of [Ne ii] but did not detect this line. [Ne ii] is a fine-structure line excited by ultraviolet photons of energy >21.6 eV and detection of this line traces hot gas very close to the young massive star, generally seen in compact and ultracompact H ii regions (Zhu et al. 2005; Jaffe et al. 2003) and also sighted towards a few high mass protostellar candidates (Campbell et al. 2008). In the case of S7, we believe that the high circumstellar density, extinction due to the molecular cloud and spectral type of the exciting star could be the reasons for non-detection. The peak column density determined from the column density map towards S7 is 7.3 × 1022 cm-2. This corresponds to a core density of nH ~ ne ~ 4 × 105 cm-3 assuming that the column density along the line-of-sight is associated with the core that is the size of a pixel (6′′ ~ 0.1 pc). This is of the order of the critical density ncrit ~ 3.6 × 105 cm-3 required for collisional de-excitation of [Ne ii] by electrons (Takahashi et al. 2000). The density is expected to be even higher close to the central object leading to de-excitation of ions by collisions. In our case, the lack of detection could also be attributed to optical depth effects. Contrary to one’s naive expectation, extinction could play a role in the non-detection of this mid-infrared line towards dense cores, for example towards the H ii region W33-B2 (Beck et al. 1998). Finally, S7 being a luminous infrared object with little radio emission, it is possible that very little ionised neon is present here.
Both methanol as well as water masers have been detected towards S7. The 44 GHz Class I methanol maser has been detected by Kurtz et al. (2004) and more recently by Gómez-Ruiz et al. (2016) close to S7. Both the measurements are interferometric leading to high positional accuracy (better than the beam size of 2′′ ×1.̋5). The 6.7 GHz Class II methanol maser has also been detected here by Fontani et al. (2010). The radiatively excited Class II masers are associated with hot molecular cores, UCH ii regions and near-IR sources associated with massive young stellar objects, while the collisionally pumped Class I maser sources are generally offset and believed to form at the interfaces between outflows and ambient material or expansion of H ii regions. The presence of Class I methanol maser is supported by the CO measurements towards S7 that indicate the presence of an outflow through the broad, non-Gaussian profile with line wings. However, due to the presence of alternate velocity components along the line-of-sight, it is difficult to discern the outflow through mapping (Zhang et al. 2005). Three water maser spots (velocity components) have been detected towards this region (Urquhart et al. 2011). OH masers that are known to be associated with an advanced stage of the appearance of UCH ii region have not been detected here by Edris et al. (2007). However, these authors detected OH maser emission in a position offset from the IRAS position (>2′) towards the north-west, implying that it is unlikely to be associated with the 18 511 molecular cloud. According to the sequence proposed by Breen et al. (2010), the presence of water masers, both the classes of methanol masers, and absence of OH masers suggests that from the maser viewpoint, S7 is in the relatively intermediate evolutionary stage, prior to or in early UCH ii region phase. Our results discussed earlier point towards the former, that is a phase prior to the hypercompact and ultracompact H ii region phase.
The mid-infrared spectrum comprises an optically thick silicate absorption profile and ice-features implying a cold dense environment. The lack of ionic emission lines and PAH features is another strong indication of the youth of S7. Based on an estimate of the bolometric luminosity, we assert that S7 is the most massive object in the young protocluster. Its radio nature would ascertain that it is in a phase where it is still accreting mass and therefore likely to become more massive before the accretion stops (Hoare et al. 2007). It can, therefore be categorised as a high-mass protostellar object (Beck et al. 1998). The properties of S7 are compiled in Table 4.
Comparison of properties of cluster members: S7, S10, and S11.
5.2. S11
The projected distance between S11 and S7 is 0.3 pc. The molecular CO emission towards IRAS 18511 has two peaks. The brightest peak is at S11 while the secondary peak is at S7. No methanol Class I maser emission is detected here although radio emission is detected at 8.5, 15 and 23 GHz (Watt & Mundy 1999; Sánchez-Monge et al. 2011). The radio emission flux density ranges from 0.65–1.15 mJy. It is possible that the emission is diffuse and not point-like as we see diffuse emission at mid-infrared wavelengths that we associate with a photo-dissociated region (PDR, discussed below). The present resolution of radio images does not allow us to determine whether or not there is any ionised gas associated with S11′. If we assume the radio flux density to be associated with S11 alone, then we estimate the Lyman continuum photon flux to be 2.3 × 1045 s-1 assuming that the ionised gas emission is optically thin at 23.1 GHz. This corresponds to a luminosity of ~ 6 × 10³L⊙ and a spectral type of B1 for S11 (Thompson 1984). In the absence of an independent measure of bolometric luminosity, it is not possible to plot this object in Fig. 12 and estimate whether the emission is from the associated H ii region or jet/wind source. The spectral index value 0.58 ± 0.41 indicates that it is likely to be a jet/wind source. However, the error in spectral index value is also large. If it is indeed an ionised jet or wind source, the bolometric luminosity of S11 would be considerably higher (~ 105L⊙ if we apply Eq. (7)) than the value estimated earlier. In addition, we do not see any hint of the wind in the Br-γ profile (Fig. 3), unlike S7. These considerations lead us to regard S11 as a relatively evolved object, probably in the ultracompact H ii region phase.
Close to S11, we have detected diffuse emission along with the knot S11′. The diffuse mid-infrared emission associated with young stellar objects could be elongated or otherwise. It has been shown that such extended emission could be due to outflow cavities, circumstellar disks or accretion envelopes (De Buizer 2006). Extended mid-infrared emission around massive young stellar objects has been detected, in many cases within the H ii regions indicating that hot dust can be present within these regions (Morales et al. 2009). In our case, S11′ being bright in PAH bands implies that we are probably probing the PDR near the edge of the H ii region (Salgado et al. 2012). As the extended emission is seen to the west and north-west of S11 and not in other directions, this suggests that density inhomogeneities in the vicinity of S11 could be the likely cause. One cannot rule out scattered light from a cavity created by an outflow from S11 providing a glimpse of regions closer to S11. Mid-infrared emission from cavities created by jets has been observed towards several massive protostars (De Buizer 2007) and the PDRs at the edges of the ionised cavities have been attributed to PAH emission from bipolar outflows (Phillips & Pérez-Grana 2009). Alternately, it is possible that S11′ corresponds to a distinct faint source in the vicinity of S11. In the literature, we find that PAH emission has been detected towards young stellar objects with disks: a substantial fraction of Herbig Ae/Be stars (Acke & van den Ancker 2004) and a few T-Tauri stars (Geers et al. 2006). However, these objects suffer low extinction and the fraction of PAH detection from embedded objects is very low (Geers et al. 2009; van Dishoeck & van der Tak 2000). Compact PAH emission has also been imaged towards a number of young objects by van Dishoeck & van der Tak (2000). As the cluster members of IRAS 18511 are embedded, the former possibility of S11′ being associated with a cavity appears more encouraging. More sensitive observations in mid-infrared along with high-resolution molecular line observations could possibly help confirm this. Although S11 has the largest optical depth in silicate (present work), ices and hydrocarbon features (Godard et al. 2012), the silicate feature of S11 is closer to that of Galactic centre and local diffuse ISM. The large optical depth can be explained by the fact that S11 is more embedded than S7 (possibly through clumpy medium). A large extinction could also be explained by the viewing angle in the presence of a disk-like structure if we assume that S11′ is indeed created by an outflow from S11. Considering that (i) diffuse emission is seen towards S11 unlike S7; (ii) class II methanol maser is not detected towards S11 while it is detected towards S7; (iii) S11 is probably in the H ii region phase; and (iv) S11 has lower bolometric luminosity than S7, we speculate that S11 is less massive but more evolved compared to S7. Thus, the protostellar object likely to become the most massive star is less evolved as compared to a lower mass star. It is possible that the evolution of S7 was initiated subsequently to that of S11. On the other hand, if S7 and S11 are co-eval, then this result has a bearing on the evolutionary mechanism of massive stars. Simulations have shown that the evolution of a massive protostar cannot be treated as an independent problem and should also involve the evolution of the host molecular core, leading to variation in properties such as the mass accretion rate (Kuiper & Yorke 2013).
5.3. S10
S10 is located to the south-east of S7 at a projected distance of approximately 0.3 pc. The shape of the silicate absorption feature is similar to that of S7 although the optical depth is larger. This object although bright in mid-infrared has no associated radio emission. Being in close proximity to S11 (projected distance ~ 0.1 pc), it is difficult to ascertain its bolometric luminosity. From the luminosity considerations, it would appear that S10 has lower bolometric luminosity as compared to S7 and S11 (see Table 4). We therefore anticipate that S10 is of lower mass than S7 or S11. Alternately, there is a possibility that S10 is a low-mass and low-luminosity object on its way to becoming a massive protostar. However, unlike S7 no Class I methanol maser is detected here.
The silicate feature of S10 is closer in appearance to that of S7 as compared to S11. This is clear from the comparison of wavelengths at which the absorption peaks and the width of the silicate feature (Table 3), seen in the difference spectra shown in Fig. 10. It is difficult to speculate on the nature of this similarity in view of the limited information we have of this object.
A census of silicate absorption features towards hundreds of massive young stellar objects in the Large Magellanic Cloud shows that the evolutionary stage of the young stellar objects can be categorised based on silicate features, emission lines and PAHs (Seale et al. 2009). Evidence points towards S11 being relatively more evolved as compared to S7 and we find a variation in their silicate profiles where the silicate feature of the former is wider and peaks at a longer wavelength compared to the latter. Our study of massive young objects from the same cluster, although younger and more embedded than the sample considered by Seale et al. (2009), shows that silicate absorption profiles can be combined with other multiwavelength tracers to assess the evolutionary stage of the embedded object. However, further studies of silicate features as well as other tracers from the cluster members in different evolutionary stages are required to confirm this.
6. Summary
We have examined the cluster members and distribution of cold gas in the region associated with IRAS 18511+0146. Near-infrared spectroscopy of seven objects shows a rising SED. Of these, the three brightest in mid-infrared (S7, S10 and S11) have been investigated through spectroscopy and show silicate absorption features with large optical depths. S7 is brightest at near-, mid- and far-infrared as well as at millimetre wavelengths and is the most luminous source in this region. The temperature and density distributions peak close to S7 indicating active star formation here. S11 is associated with diffuse emission in mid-infrared wavelengths which is bright in PAH bands and could be interpreted as the photo-dissociated region in the vicinity of S11. S7 is speculated to be younger and more massive than S11 based on its luminosity, radio emission, and presence of methanol masers. The shape of the silicate feature towards S11 is different from S7 and S10 in terms of the peak absorption wavelength and the width of feature. S7 and S10 show substructures in their silicate absorption feature that could be due to ices or the nature of silicates as the composition is unlikely to be different across the molecular cloud. The bolometric luminosity of IRAS 18511+0146 is estimated to be 1.8 × 10⁴L⊙, equivalent to a single B0.5-B0 ZAMS star.
Acknowledgments
We would like to thank A. G. G. M. Tielens for providing us with details of their silicate profiles and A. Sánchez-Monge for letting us use the radio images. We are grateful to F. Massi for assistance in reduction of the near-infrared spectra. We also thank L. Christensen (VLT), A. Ederoclite and C. Snodgrass (NTT) for the support and friendly atmosphere provided while carrying out the observations. C.M.W. acknowledges travel support from Science Foundation, Ireland (Grant 13/ERC/I12907). Herschel is an ESA space observatory with science instruments provided by European-led Principal Investigator consortia and with important participation from NASA. The ATLASGAL project is a collaboration between the Max-Planck-Gesellschaft, the European Southern Observatory (ESO), and the Universidad de Chile. HIPE is a joint development by the Herschel Science Ground Segment Consortium, consisting of ESA, the NASA Herschel Science Center, and the HIFI, PACS and SPIRE consortia.
References
- Acke, B., & van den Ancker, M. E. 2004, A&A, 426, 151 [NASA ADS] [CrossRef] [EDP Sciences] [Google Scholar]
- André, P., Belloche, A., Motte, F., & Peretto, N. 2007, A&A, 472, 519 [NASA ADS] [CrossRef] [EDP Sciences] [Google Scholar]
- André, P., Men’shchikov, A., Bontemps, S., et al. 2010, A&A, 518, L102 [NASA ADS] [CrossRef] [EDP Sciences] [Google Scholar]
- Anglada, G., Rodríguez, L. F., & Carrasco-Gonzalez, C. 2015, in Proc. Advancing Astrophysics with the Square Kilometre Array (AASKA14), 121 [Google Scholar]
- Aniano, G., Draine, B. T., Gordon, K. D., & Sandstrom, K. 2011, PASP, 123, 1218 [NASA ADS] [CrossRef] [Google Scholar]
- Beck, S. C., Kelly, D. M., & Lacy, J. H. 1998, AJ, 115, 2504 [NASA ADS] [CrossRef] [Google Scholar]
- Beckwith, S. V. W., Sargent, A. I., Chini, R. S., & Guesten, R. 1990, AJ, 99, 924 [NASA ADS] [CrossRef] [Google Scholar]
- Beltrán, M. T., Brand, J., Cesaroni, R., et al. 2006, A&A, 447, 221 [NASA ADS] [CrossRef] [EDP Sciences] [MathSciNet] [Google Scholar]
- Boogert, A. C. A., Pontoppidan, K. M., Knez, C., et al. 2008, ApJ, 678, 985 [NASA ADS] [CrossRef] [Google Scholar]
- Bottinelli, S., Boogert, A. C. A., Bouwman, J., et al. 2010, ApJ, 718, 1100 [NASA ADS] [CrossRef] [Google Scholar]
- Bowey, J. E., Adamson, A. J., & Yates, J. A. 2003, MNRAS, 340, 1173 [NASA ADS] [CrossRef] [Google Scholar]
- Breen, S. L., Ellingsen, S. P., Caswell, J. L., & Lewis, B. E. 2010, MNRAS, 401, 2219 [NASA ADS] [CrossRef] [Google Scholar]
- Calvet, N., Muzerolle, J., Briceño, C., et al. 2004, AJ, 128, 1294 [NASA ADS] [CrossRef] [Google Scholar]
- Campbell, M. F., Sridharan, T. K., Beuther, H., et al. 2008, ApJ, 673, 954 [NASA ADS] [CrossRef] [Google Scholar]
- Chiar, J. E., & Tielens, A. G. G. M. 2006, ApJ, 637, 774 [NASA ADS] [CrossRef] [Google Scholar]
- Chiar, J. E., Ennico, K., Pendleton, Y. J., et al. 2007, ApJ, 666, L73 [NASA ADS] [CrossRef] [Google Scholar]
- Comerón, F., Torra, J., Chiappini, C., et al. 2004, A&A, 425, 489 [NASA ADS] [CrossRef] [EDP Sciences] [Google Scholar]
- Connelley, M. S., & Greene, T. P. 2010, AJ, 140, 1214 [NASA ADS] [CrossRef] [Google Scholar]
- Cooper, H. D. B., Lumsden, S. L., Oudmaijer, R. D., et al. 2013, MNRAS, 430, 1125 [NASA ADS] [CrossRef] [Google Scholar]
- Csengeri, T., Urquhart, J. S., Schuller, F., et al. 2014, A&A, 565, A75 [NASA ADS] [CrossRef] [EDP Sciences] [Google Scholar]
- Cyganowski, C. J., Brogan, C. L., & Hunter, T. R. 2007, AJ, 134, 346 [NASA ADS] [CrossRef] [Google Scholar]
- De Buizer, J. M. 2006, ApJ, 642, L57 [NASA ADS] [CrossRef] [Google Scholar]
- De Buizer, J. M. 2007, in IAU Symp. 237, eds. B. G. Elmegreen, & J. Palous, 407 [Google Scholar]
- Demyk, K., Jones, A. P., Dartois, E., Cox, P., & D’Hendecourt, L. 1999, A&A, 349, 267 [NASA ADS] [Google Scholar]
- Dupac, X., Bernard, J.-P., Boudet, N., et al. 2003, A&A, 404, L11 [NASA ADS] [CrossRef] [EDP Sciences] [Google Scholar]
- Edris, K. A., Fuller, G. A., & Cohen, R. J. 2007, A&A, 465, 865 [NASA ADS] [CrossRef] [EDP Sciences] [Google Scholar]
- Faimali, A., Thompson, M. A., Hindson, L., et al. 2012, MNRAS, 426, 402 [NASA ADS] [CrossRef] [Google Scholar]
- Fontani, F., Cesaroni, R., & Furuya, R. S. 2010, A&A, 517, A56 [NASA ADS] [CrossRef] [EDP Sciences] [Google Scholar]
- Förster Schreiber, N. M. 2000, AJ, 120, 2089 [NASA ADS] [CrossRef] [Google Scholar]
- Garcia Lopez, R., Natta, A., Testi, L., & Habart, E. 2006, A&A, 459, 837 [NASA ADS] [CrossRef] [EDP Sciences] [Google Scholar]
- Geers, V. C., Augereau, J.-C., Pontoppidan, K. M., et al. 2006, A&A, 459, 545 [NASA ADS] [CrossRef] [EDP Sciences] [Google Scholar]
- Geers, V. C., van Dishoeck, E. F., Pontoppidan, K. M., et al. 2009, A&A, 495, 837 [NASA ADS] [CrossRef] [EDP Sciences] [Google Scholar]
- Godard, M., Geballe, T. R., Dartois, E., & Muñoz Caro, G. M. 2012, A&A, 537, A27 [NASA ADS] [CrossRef] [EDP Sciences] [Google Scholar]
- Gómez-Ruiz, A. I., Kurtz, S. E., Araya, E. D., Hofner, P., & Loinard, L. 2016, ApJS, 222, 18 [NASA ADS] [CrossRef] [Google Scholar]
- Greene, T. P., & Lada, C. J. 1996, AJ, 112, 2184 [NASA ADS] [CrossRef] [Google Scholar]
- Greene, T. P., & Lada, C. J. 2000, AJ, 120, 430 [NASA ADS] [CrossRef] [Google Scholar]
- Griffin, M. J., Abergel, A., Abreu, A., et al. 2010, A&A, 518, L3 [Google Scholar]
- Hambly, N. C., Collins, R. S., Cross, N. J. G., et al. 2008, MNRAS, 384, 637 [NASA ADS] [CrossRef] [Google Scholar]
- Hildebrand, R. H. 1983, QJRAS, 24, 267 [NASA ADS] [Google Scholar]
- Hoare, M. G., Kurtz, S. E., Lizano, S., Keto, E., & Hofner, P. 2007, Protostars and Planets V, eds. V. B. Reipurth, D. Jewitt, & K. Keil (Tucson: University of Arizona Press), 181 [Google Scholar]
- Ishii, M., Nagata, T., Chrysostomou, A., & Hough, J. H. 2002, AJ, 124, 2790 [NASA ADS] [CrossRef] [Google Scholar]
- Jaeger, C., Mutschke, H., Begemann, B., Dorschner, J., & Henning, T. 1994, A&A, 292, 641 [Google Scholar]
- Jaffe, D. T., Zhu, Q., Lacy, J. H., & Richter, M. 2003, ApJ, 596, 1053 [NASA ADS] [CrossRef] [Google Scholar]
- Keane, J. V., Tielens, A. G. G. M., Boogert, A. C. A., Schutte, W. A., & Whittet, D. C. B. 2001, A&A, 376, 254 [NASA ADS] [CrossRef] [EDP Sciences] [Google Scholar]
- Kemper, F., Vriend, W. J., & Tielens, A. G. G. M. 2004, ApJ, 609, 826 [NASA ADS] [CrossRef] [Google Scholar]
- Kessler-Silacci, J. E., Hillenbrand, L. A., Blake, G. A., & Meyer, M. R. 2005, ApJ, 622, 404 [Google Scholar]
- Klein, R., Posselt, B., Schreyer, K., Forbrich, J., & Henning, T. 2005, ApJS, 161, 361 [NASA ADS] [CrossRef] [Google Scholar]
- Knez, C., Boogert, A. C. A., Pontoppidan, K. M., et al. 2005, ApJ, 635, L145 [NASA ADS] [CrossRef] [Google Scholar]
- Kraus, M. 2009, A&A, 494, 253 [NASA ADS] [CrossRef] [EDP Sciences] [Google Scholar]
- Kraus, S., Hofmann, K.-H., Benisty, M., et al. 2008, A&A, 489, 1157 [NASA ADS] [CrossRef] [EDP Sciences] [Google Scholar]
- Kuiper, R., & Yorke, H. W. 2013, ApJ, 772, 61 [NASA ADS] [CrossRef] [Google Scholar]
- Kurtz, S., Hofner, P., & Álvarez, C. V. 2004, ApJS, 155, 149 [NASA ADS] [CrossRef] [Google Scholar]
- Lada, C. J., & Lada, E. A. 2003, ARA&A, 41, 57 [NASA ADS] [CrossRef] [Google Scholar]
- Lagage, P. O., Pel, J. W., Authier, M., et al. 2004, The Messenger, 117, 12 [NASA ADS] [Google Scholar]
- Launhardt, R., Stutz, A. M., Schmiedeke, A., et al. 2013, A&A, 551, A98 [NASA ADS] [CrossRef] [EDP Sciences] [Google Scholar]
- Lawrence, A., Warren, S. J., Almaini, O., et al. 2007, MNRAS, 379, 1599 [NASA ADS] [CrossRef] [MathSciNet] [Google Scholar]
- Lucas, P. W., Hoare, M. G., Longmore, A., et al. 2008, MNRAS, 391, 136 [NASA ADS] [CrossRef] [Google Scholar]
- Lumsden, S. L., Hoare, M. G., Urquhart, J. S., et al. 2013, ApJS, 208, 11 [NASA ADS] [CrossRef] [Google Scholar]
- Mathis, J. S. 1998, ApJ, 497, 824 [NASA ADS] [CrossRef] [Google Scholar]
- McKee, C. F., & Ostriker, E. C. 2007, ARA&A, 45, 565 [NASA ADS] [CrossRef] [Google Scholar]
- Meeus, G. 2009, in Cosmic Dust – Near and Far, eds. T. Henning, E. Grün, & J. Steinacker, ASP Conf. Ser., 414, 99 [Google Scholar]
- Meyer, M. R., Edwards, S., Hinkle, K. H., & Strom, S. E. 1998, ApJ, 508, 397 [NASA ADS] [CrossRef] [Google Scholar]
- Mezger, P. G., & Henderson, A. P. 1967, ApJ, 147, 471 [NASA ADS] [CrossRef] [Google Scholar]
- Molinari, S., Swinyard, B., Bally, J., et al. 2010a, A&A, 518, L100 [NASA ADS] [CrossRef] [EDP Sciences] [Google Scholar]
- Molinari, S., Swinyard, B., Bally, J., et al. 2010b, PASP, 122, 314 [NASA ADS] [CrossRef] [Google Scholar]
- Molinari, S., Schisano, E., Elia, D., et al. 2016, A&A, 591, A149 [NASA ADS] [CrossRef] [EDP Sciences] [Google Scholar]
- Moorwood, A., Cuby, J.-G., & Lidman, C. 1998, The Messenger, 91, 9 [NASA ADS] [Google Scholar]
- Morales, E. F. E., Mardones, D., Garay, G., Brooks, K. J., & Pineda, J. E. 2009, ApJ, 698, 488 [NASA ADS] [CrossRef] [Google Scholar]
- Mottram, J. C., Hoare, M. G., Urquhart, J. S., et al. 2011, A&A, 525, A149 [NASA ADS] [CrossRef] [EDP Sciences] [Google Scholar]
- Najita, J., Carr, J. S., & Tokunaga, A. T. 1996, ApJ, 456, 292 [NASA ADS] [CrossRef] [Google Scholar]
- Natta, A., & Giovanardi, C. 1990, ApJ, 356, 646 [NASA ADS] [CrossRef] [Google Scholar]
- Panagia, N., & Felli, M. 1975, A&A, 39, 1 [NASA ADS] [Google Scholar]
- Paradis, D., Veneziani, M., Noriega-Crespo, A., et al. 2010, A&A, 520, L8 [NASA ADS] [CrossRef] [EDP Sciences] [Google Scholar]
- Peretto, N., & Fuller, G. A. 2009, A&A, 505, 405 [NASA ADS] [CrossRef] [EDP Sciences] [Google Scholar]
- Phillips, J. P., & Pérez-Grana, J. A. 2009, MNRAS, 393, 354 [NASA ADS] [CrossRef] [Google Scholar]
- Pilbratt, G. L., Riedinger, J. R., Passvogel, T., et al. 2010, A&A, 518, L1 [CrossRef] [EDP Sciences] [Google Scholar]
- Poglitsch, A., Waelkens, C., Geis, N., et al. 2010, A&A, 518, L2 [NASA ADS] [CrossRef] [EDP Sciences] [Google Scholar]
- Reipurth, B., Hartmann, L., Kenyon, S. J., Smette, A., & Bouchet, P. 2002, AJ, 124, 2194 [NASA ADS] [CrossRef] [Google Scholar]
- Rieke, G. H., & Lebofsky, M. J. 1985, ApJ, 288, 618 [NASA ADS] [CrossRef] [Google Scholar]
- Rodríguez-González, A., Esquivel, A., Raga, A. C., & Cantó, J. 2008, ApJ, 684, 1384 [NASA ADS] [CrossRef] [Google Scholar]
- Sadavoy, S. I., Di Francesco, J., Johnstone, D., et al. 2013, ApJ, 767, 126 [NASA ADS] [CrossRef] [Google Scholar]
- Salgado, F., Berné, O., Adams, J. D., et al. 2012, ApJ, 749, L21 [NASA ADS] [CrossRef] [Google Scholar]
- Sánchez-Monge, Á., Pandian, J. D., & Kurtz, S. 2011, ApJ, 739, L9 [NASA ADS] [CrossRef] [Google Scholar]
- Schuller, F., Beuther, H., Bontemps, S., et al. 2010, The Messenger, 141, 20 [NASA ADS] [Google Scholar]
- Schutte, W. A., & Khanna, R. K. 2003, A&A, 398, 1049 [NASA ADS] [CrossRef] [EDP Sciences] [Google Scholar]
- Seale, J. P., Looney, L. W., Chu, Y.-H., et al. 2009, ApJ, 699, 150 [NASA ADS] [CrossRef] [Google Scholar]
- Sewilo, M., Watson, C., Araya, E., et al. 2004, ApJS, 154, 553 [NASA ADS] [CrossRef] [Google Scholar]
- Takahashi, H., Matsuhara, H., Watarai, H., & Matsumoto, T. 2000, ApJ, 541, 779 [NASA ADS] [CrossRef] [Google Scholar]
- Tanaka, K. E. I., Tan, J. C., & Zhang, Y. 2016, ApJ, 818, 52 [NASA ADS] [CrossRef] [Google Scholar]
- Testi, L., Palla, F., & Natta, A. 1998, A&AS, 133, 81 [NASA ADS] [CrossRef] [EDP Sciences] [Google Scholar]
- Thompson, R. I. 1984, ApJ, 283, 165 [NASA ADS] [CrossRef] [Google Scholar]
- Urquhart, J. S., Morgan, L. K., Figura, C. C., et al. 2011, MNRAS, 418, 1689 [NASA ADS] [CrossRef] [Google Scholar]
- van Breemen, J. M., Min, M., Chiar, J. E., et al. 2011, A&A, 526, A152 [NASA ADS] [CrossRef] [EDP Sciences] [Google Scholar]
- van Dishoeck, E. F., & van der Tak, F. F. S. 2000, in From Molecular Clouds to Planetary, eds. Y. C. Minh, & E. F. van Dishoeck, IAU Symp., 197, 97 [Google Scholar]
- Vig, S., Testi, L., Walmsley, M., et al. 2007, A&A, 470, 977 (VTW07) [NASA ADS] [CrossRef] [EDP Sciences] [Google Scholar]
- Wallace, L., & Hinkle, K. 1997, ApJS, 111, 445 [NASA ADS] [CrossRef] [Google Scholar]
- Wang, K., Zhang, Q., Wu, Y., Li, H.-B., & Zhang, H. 2012, ApJ, 745, L30 [NASA ADS] [CrossRef] [Google Scholar]
- Ward-Thompson, D., André, P., & Kirk, J. M. 2002, MNRAS, 329, 257 [NASA ADS] [CrossRef] [Google Scholar]
- Ward-Thompson, D., Kirk, J. M., André, P., et al. 2010, A&A, 518, L92 [NASA ADS] [CrossRef] [EDP Sciences] [Google Scholar]
- Watt, S., & Mundy, L. G. 1999, ApJS, 125, 143 [NASA ADS] [CrossRef] [Google Scholar]
- Wolf-Chase, G., Moriarty-Schieven, G., Fich, M., & Barsony, M. 2003, MNRAS, 344, 809 [NASA ADS] [CrossRef] [Google Scholar]
- Wright, E. L., Eisenhardt, P. R. M., Mainzer, A. K., et al. 2010, AJ, 140, 1868 [NASA ADS] [CrossRef] [Google Scholar]
- Zhang, Q., Hunter, T. R., Brand, J., et al. 2005, ApJ, 625, 864 [NASA ADS] [CrossRef] [Google Scholar]
- Zhu, Q.-F., Lacy, J. H., Jaffe, D. T., Richter, M. J., & Greathouse, T. K. 2005, ApJ, 631, 381 [NASA ADS] [CrossRef] [Google Scholar]
- Zinnecker, H., & Yorke, H. W. 2007, ARA&A, 45, 481 [NASA ADS] [CrossRef] [Google Scholar]
Appendix A: Herschel images of IRAS 18511+0146
 |
Fig. A.1 Emission towards IRAS 18511+0146 at a) 70 μm; b) 160 μm; c) 250 μm; d) 350 μm; and e) 500 μm using Herschel PACs and SPIRE. The contour levels are marked on the colour wedges. |
All Tables
Photometric mid-infrared fluxes of sources associated with IRAS 18511 observed using VLT-VISIR.
All Figures
|
Fig. 1 a) Spitzer-GLIMPSE 8 μm and b) UKDISS – GPS K-band image of IRAS 18511 region. a) The mid-infrared sources 18511-A (S7) as well as young stellar objects G3–G5 are marked. The sources for which near-infrared spectroscopy have been carried out are shown in b). |
| In the text | |
|
Fig. 2 Near infrared HK spectra of objects in the region associated with IRAS 18511. The gap in the spectra between 1.8 and 2.1μm is due to atmospheric absorption. |
| In the text | |
|
Fig. 3 Continuum subtracted spectra of S7, S9, S11 and AS1 showing Br-γ line emission. The location of H2 (1–0) S(1) line is also shown. |
| In the text | |
|
Fig. 4 Left: IRAC image of S7 at 8.0 μm with the 17.7 μm emission shown as solid line contours. Right: S10 and S11 through 8.6 μm (PAH1) filter. An ellipse is drawn to show the location of S11′, diffuse emission associated with S11. The dashed contours in both panels represent the radio emission at 8.5 GHz at levels 0.04, 0.08, 0.1 and 0.12 mJy/beam (left) and 0.2, 0.3, 0.4 and 0.55 mJy/beam (right) where beam size is 9.̋2 × 7.̋5 (Sánchez-Monge et al. 2011). |
| In the text | |
|
Fig. 5 Mid-infrared spectra of bright cluster members in the IRAS 18511 region along with the spectrum of S11′. The dotted line in each panel represents the fitted continuum. |
| In the text | |
|
Fig. 6 Opacity profiles of the silicate feature of the cluster members (solid line, short-dashed line and long-dashed line) normalised at 11 μm. Also shown is the silicate profile of the Galactic centre (dot-dashed line) from Chiar & Tielens (2006). |
| In the text | |
|
Fig. 7 High-resolution mid-infrared spectrum of S7 near the [Ne ii] line. |
| In the text | |
|
Fig. 8 a) Column density map of N(H2); b) Dust temperature map; and c) |
| In the text | |
|
Fig. 9 Modified blackbody fit to the flux densities corresponding to the pixel with maximum column density (J2000 coordinates 18h53m38.08s +01°50′30.5′′). |
| In the text | |
|
Fig. 10 Difference spectra of the silicate optical depth profiles between the observed and Galactic centre (GC) of the sources S7, S10 and S11. |
| In the text | |
|
Fig. 11 SED of the IRAS 18 511 region using flux densities in the aperture shown in Fig. 8. The flux densities from MSX, WISE, Herschel Hi-GAL, JCMT-SCUBA, ATLASGAL and SEST-SIMBA are shown using solid circles. The triangles represent lower limits and diamonds represent IRAS-Point Source Catalog fluxes. The crosses and grey triangles represent flux densities and lower limits to flux densities of S7, respectively. In addition to the fluxes from the above mentioned images used for estimating the bolometric luminosity of S7, 2MASS and Spitzer-IRAC flux densities and lower limits have been used. The grey dashed line represents the SED under which the area is integrated to obtain a limit to the bolometric luminosity of S7. |
| In the text | |
|
Fig. 12 Radio luminosity at 8 GHz versus bolometric luminosity. The solid line represents the radio luminosity expected from photoionisation while the dashed line represents the fit by Anglada et al. (2015) based on observed radio jets over a wide bolometric luminosity range of 1−105L⊙. The direction of arrow head indicates that the bolometric luminosity of S7 is a lower limit. |
| In the text | |
|
Fig. A.1 Emission towards IRAS 18511+0146 at a) 70 μm; b) 160 μm; c) 250 μm; d) 350 μm; and e) 500 μm using Herschel PACs and SPIRE. The contour levels are marked on the colour wedges. |
| In the text | |
Current usage metrics show cumulative count of Article Views (full-text article views including HTML views, PDF and ePub downloads, according to the available data) and Abstracts Views on Vision4Press platform.
Data correspond to usage on the plateform after 2015. The current usage metrics is available 48-96 hours after online publication and is updated daily on week days.
Initial download of the metrics may take a while.