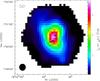
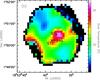
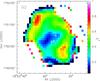
Fig. 8
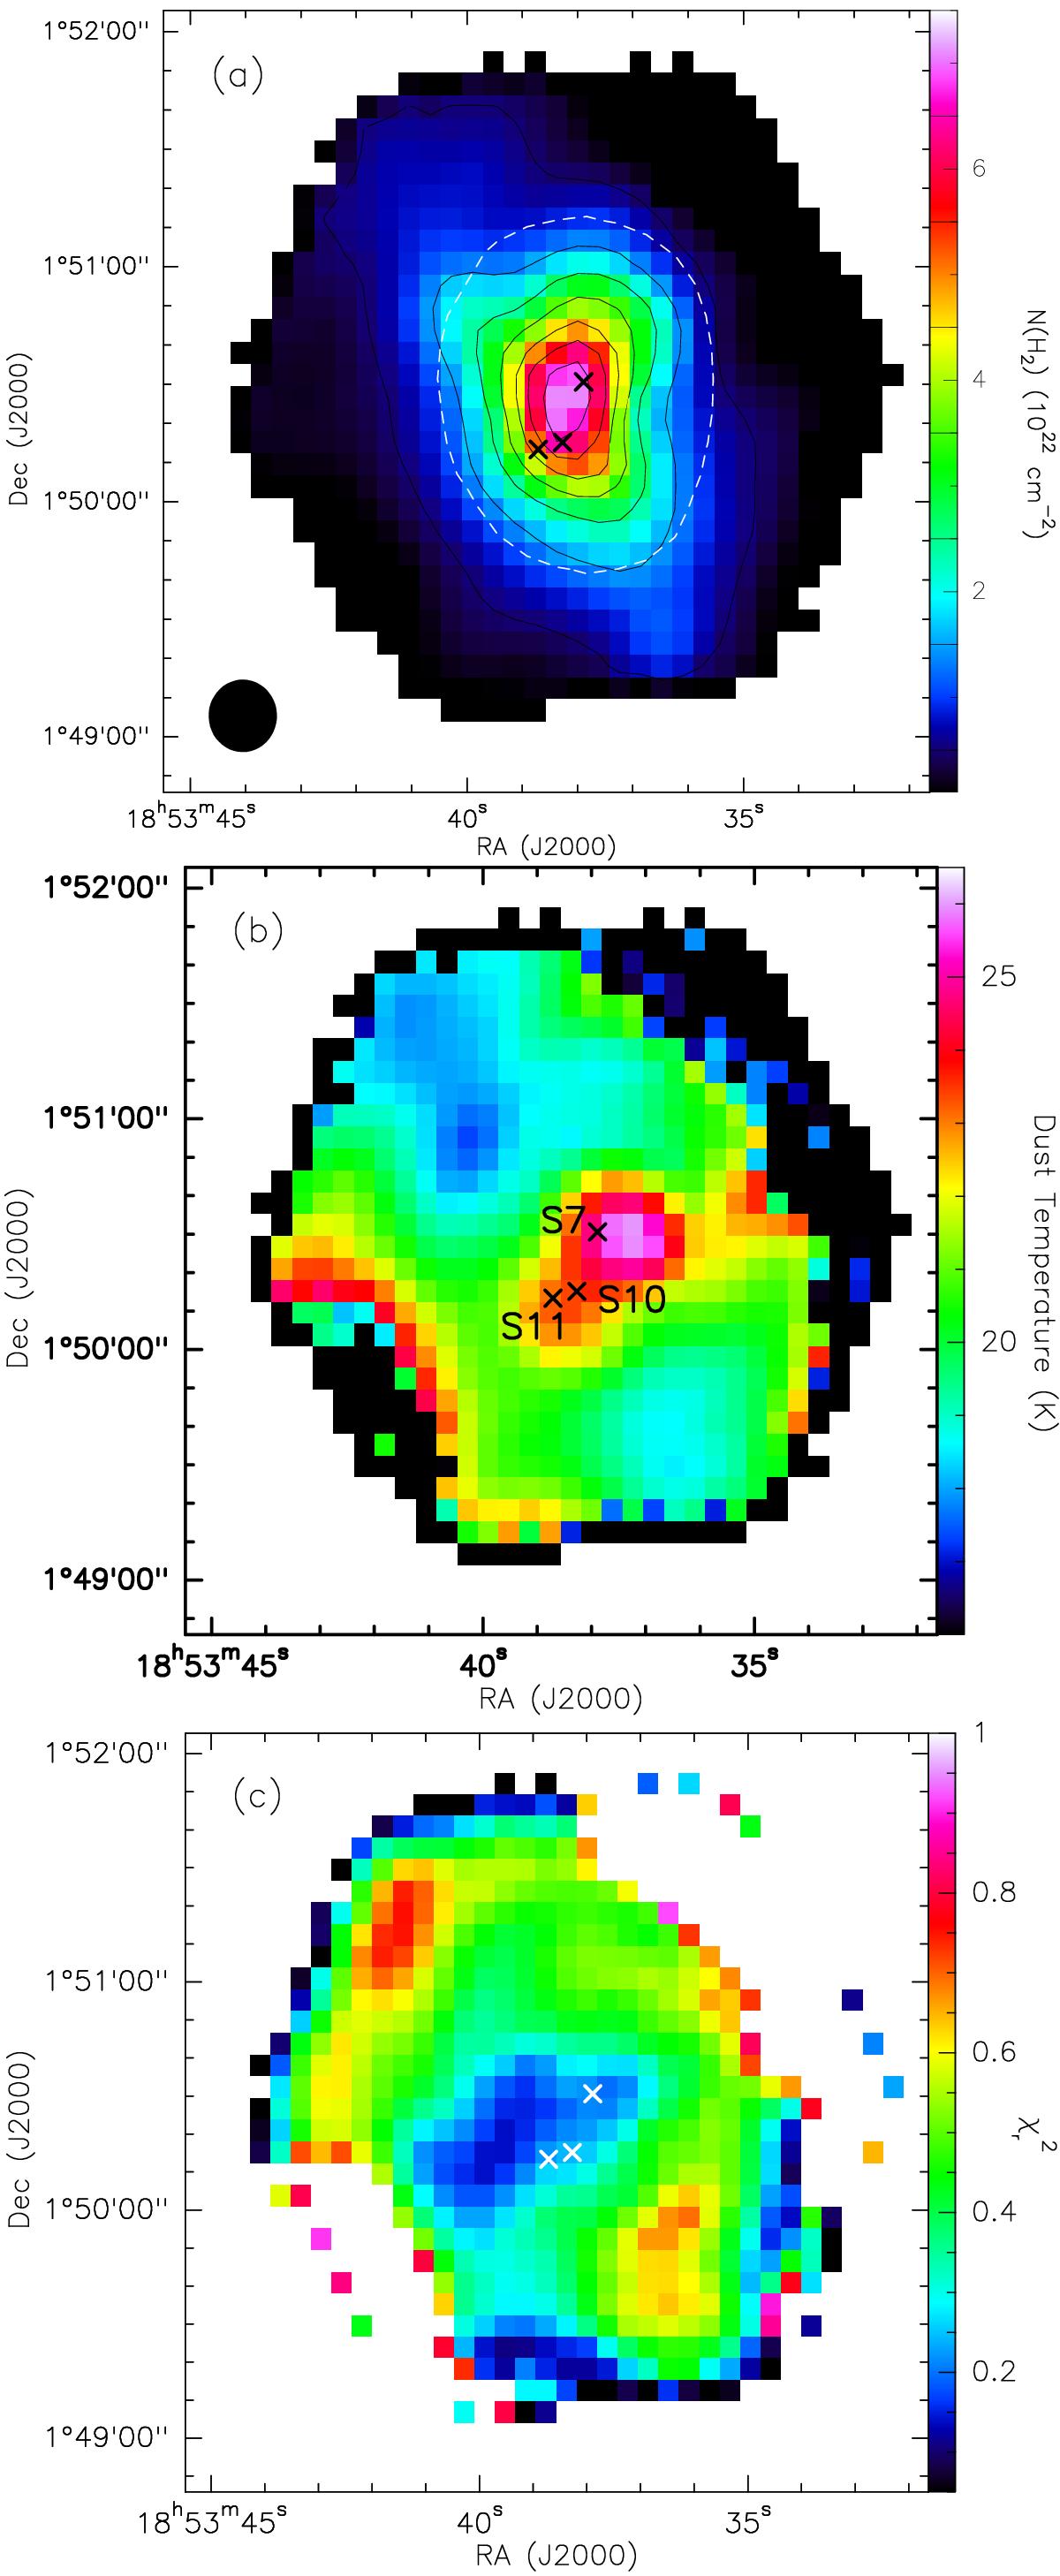
a) Column density map of N(H2); b) Dust temperature map; and c) ![]() map obtained using pixel-by-pixel modified blackbody fit to 70, 160, 250, 450 and 850 μm fluxes from the maps of IRAS 18511+0146. The beamsize is shown as a filled circle in the lower left-hand corner of a). The region enclosed within the dashed line in a) represents the aperture for estimating the SED of this region. The crosses in all the panels depict the positions of sources S7, S10 and S11, shown in b).
map obtained using pixel-by-pixel modified blackbody fit to 70, 160, 250, 450 and 850 μm fluxes from the maps of IRAS 18511+0146. The beamsize is shown as a filled circle in the lower left-hand corner of a). The region enclosed within the dashed line in a) represents the aperture for estimating the SED of this region. The crosses in all the panels depict the positions of sources S7, S10 and S11, shown in b).
Current usage metrics show cumulative count of Article Views (full-text article views including HTML views, PDF and ePub downloads, according to the available data) and Abstracts Views on Vision4Press platform.
Data correspond to usage on the plateform after 2015. The current usage metrics is available 48-96 hours after online publication and is updated daily on week days.
Initial download of the metrics may take a while.