Fig. 11
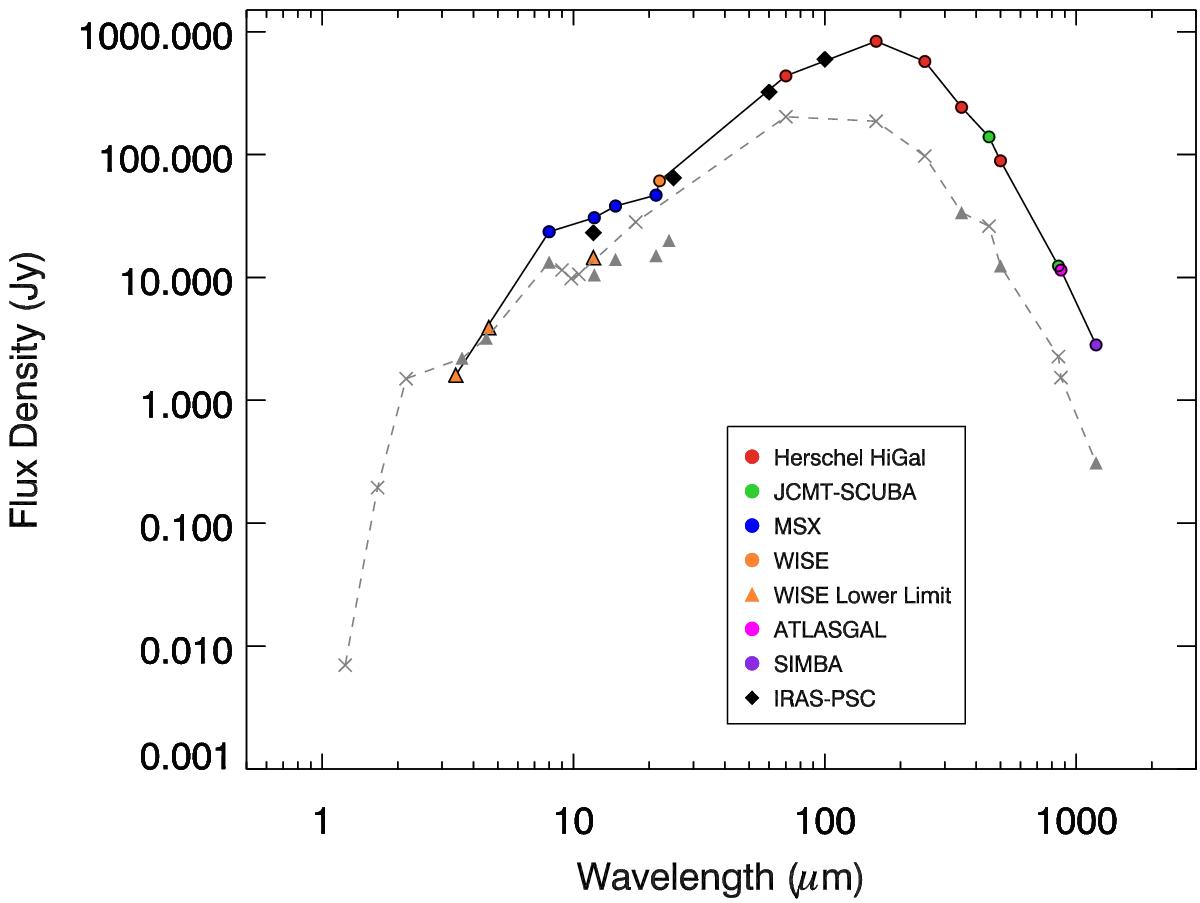
SED of the IRAS 18 511 region using flux densities in the aperture shown in Fig. 8. The flux densities from MSX, WISE, Herschel Hi-GAL, JCMT-SCUBA, ATLASGAL and SEST-SIMBA are shown using solid circles. The triangles represent lower limits and diamonds represent IRAS-Point Source Catalog fluxes. The crosses and grey triangles represent flux densities and lower limits to flux densities of S7, respectively. In addition to the fluxes from the above mentioned images used for estimating the bolometric luminosity of S7, 2MASS and Spitzer-IRAC flux densities and lower limits have been used. The grey dashed line represents the SED under which the area is integrated to obtain a limit to the bolometric luminosity of S7.
Current usage metrics show cumulative count of Article Views (full-text article views including HTML views, PDF and ePub downloads, according to the available data) and Abstracts Views on Vision4Press platform.
Data correspond to usage on the plateform after 2015. The current usage metrics is available 48-96 hours after online publication and is updated daily on week days.
Initial download of the metrics may take a while.