| Issue |
A&A
Volume 599, March 2017
|
|
|---|---|---|
| Article Number | A40 | |
| Number of page(s) | 18 | |
| Section | Interstellar and circumstellar matter | |
| DOI | https://doi.org/10.1051/0004-6361/201629269 | |
| Published online | 24 February 2017 | |
Water delivery from cores to disks: Deuteration as a probe of the prestellar inheritance of H2O
1 Leiden Observatory, Leiden University, PO Box 9513, 2300 RA Leiden, The Netherlands
2 Center for Computational Sciences, University of Tsukuba, 1-1-1 Tennoudai, 305-8577 Tsukuba, Japan
e-mail: This email address is being protected from spambots. You need JavaScript enabled to view it.
3 European Southern Observatory, Karl-Schwarzschild-Str. 2, 85748 Garching, Germany
4 Max-Planck-Institut für Extraterrestrische Physik, Giessenbachstrasse, 85741 Garching, Germany
5 School of Physics and Astronomy, University of Leeds, Leeds, LS2 9JT, UK
6 Heidelberg University, Center for Astronomy, Institute of Theoretical Astrophysics, Albert-Ueberle-Straße 2, 69120 Heidelberg, Germany
7 Department of Chemistry, University of Virginia, Charlottesville, VA 22904, USA
Received: 8 July 2016
Accepted: 21 October 2016
Abstract
We investigate the delivery of regular and deuterated forms of water from prestellar cores to circumstellar disks. We adopt a semi-analytical, axisymmetric, two-dimensional collapsing core model with post-processing gas-ice astrochemical simulations, in which a layered ice structure is considered. The physical and chemical evolutions are followed until the end of the main accretion phase. In our models, when mass averaged over the whole disk, a forming disk has a similar H2O abundance and HDO/H2O abundance ratio (within a factor of 2) as the precollapse values of these quantities, regardless of time. Consistent with previous studies, our models suggest that interstellar water ice is delivered to forming disks without significant alteration. On the other hand, the local vertically averaged H2O ice abundance and HDO/H2O ice ratio can differ more, by up to a factor of several, depending on time and distance from a central star. Key parameters for the local variations are the fluence of stellar UV photons en route into the disk and the ice layered structure, the latter of which is mostly established in the prestellar stages. We also find that even if interstellar water ice is destroyed by stellar UV and (partly) reformed prior to disk entry, the HDO/H2O ratio in reformed water ice is similar to the original value. This finding indicates that some caution is needed in discussions on the prestellar inheritance of H2O based on comparisons between the observationally derived HDO/H2O ratio in clouds/cores and that in disks/comets. Alternatively, we propose that the ratio of D2O/HDO to HDO/H2O better probes the prestellar inheritance of H2O. It is also found that in forming disks icy organics are more enriched in deuterium than water ice. The differential deuterium fractionation in water and organics is inherited from prestellar stages.
Key words: astrochemistry / ISM: clouds / ISM: molecules / protoplanetary disks
© ESO, 2017
1. Introduction
A molecular cloud core is the formation site of stars. The gravitational collapse of cores leads to the birth of protostars, which are accompanied by surrounding disk-like structures, which are termed circumstellar disks. When star-disk systems are born, they are deeply embedded in the surrounding core, and evolve via the accretion of remnant material. In disks, grain growth and/or gravitational instability eventually lead to the formation of planets, although the timing of planet formation in the sequence of the physical evolution remains an open question (e.g., Shu et al. 1987; Testi et al. 2014; Brogan et al. 2015; Yen et al. 2016).
It is known that water ice is already abundant in molecular clouds (Whittet 1993). One of the major goals in the field of astrochemistry is to reveal the water trail from its formation in molecular clouds and cores to the delivery to planetary systems (van Dishoeck et al. 2014, for a recent review). The level of deuterium fractionation in molecules, which is measured via the HDO/H2O and D2O/H2O abundance ratios for water, depends on their formation environments. This characteristic can allow us to gain insights into the water trail by comparing the deuterium fractionation in objects at different evolutionary stages. Recent interferometric observations have quantified the gaseous HDO/H2O ratio in the inner hot regions (>100 K) around deeply embedded low-mass protostars, where water ice has sublimated (e.g., Persson et al. 2014). The inferred HDO/H2O ratio is ~10-3, which is similar to that in some comets in our solar system (e.g., Villanueva et al. 2009; Altwegg et al. 2015). This similarity may imply that some cometary water originated from the embedded protostellar or earlier prestellar phases. On the other hand, given the variation in the HDO/H2O ratio among pristine solar system materials (i.e., comets and meteorites; e.g., Mumma & Charnley 2011; Alexander et al. 2012), the situation may be more complicated.
There have been numerous efforts to understand the water deuteration in star- and planet-forming regions using numerical simulations (e.g., Tielens 1983; Aikawa & Herbst 1999). In this work, we focus on the delivery of regular and deuterated forms of water from prestellar cores to circumstellar disks. The disk formation stage is the connecting point of the interstellar chemistry and disk chemistry and thus the key to understanding the connection between both phases. Here we outline the water ice formation and deuteration in molecular clouds and cores and describe the aim of this paper. The potential importance of (chemical) processing in disks themselves is discussed in Sect. 6.
Astrochemical models for clouds and cores in the local interstellar medium (ISM) have shown that deuteration of water ice can occur (too) efficiently owing to the low gas temperature (~10 K) and the availability of cosmic rays as a source of ionization. Both are necessary to drive deuterium fractionation through isotopic exchange reactions in the gas phase, such as  (Watson et al. 1976). The elemental abundance of deuterium with respect to hydrogen is [D/H] elem = 1.5 × 10⁻⁵ in the local ISM (Linsky 2003). The primary reservoir of deuterium is HD in the dense ISM. At low temperatures, the isotopic exchange reactions favor deuterium transfer from HD to H
 , for example, over the endothermic reverse direction. The endothermicity depends on the nuclear spin states of the reactants and the products (e.g., Hugo et al. 2009). The enrichment of deuterium in H, for example, is distributed to both gaseous and icy molecules through sequential chemical reactions (Tielens 1983; Millar et al. 1989). Indeed pseudo-time dependent models for prestellar cores, in which the physical conditions are constant with time, usually predict an HDO/H2O ice ratio on the order of ~10-2 or even larger, which is greater than the upper limit on the HDO/H2O ice ratio inferred from infrared observations of ices in outer cold protostellar envelopes (<(2–10) × 10-3, Dartois et al. 2003; Parise et al. 2003).
A promising solution to this contradiction is the large gradient of deuterium fractionation during water ice formation, which was originally proposed by Dartois et al. (2003) and was recently reproposed by Furuya et al. (2015, 2016b) based on gas-ice chemical simulations during the formation and evolution of molecular clouds. The basic idea is that, first, the majority of volatile oxygen is locked up in water ice and other O-bearing molecules in molecular clouds without significant deuterium fractionation; and, second, at later times, in prestellar cores, water ice formation continues with reduced efficiency but with enhanced deuterium fractionation. The enhanced deuterium fractionation in the latter stage can be triggered by a drop in the ortho-to-para nuclear spin ratio of H2, CO freeze-out, and the attenuation of the interstellar UV field (e.g., Roberts et al. 2002; Flower et al. 2006). In this case, a small fraction of water ice (i.e., the outer layers of ice mantles) is formed with high deuteration ratios of ≳10-2, but the HDO/H2O ratio in the entire ice mantle is not very high (≪10-2). This scenario is also consistent with the higher D2O/HDO ratio compared to the HDO/H2O ratio measured in the inner hot regions around a Class 0 protostar, where water ice has sublimated (Coutens et al. 2014; Furuya et al. 2016b). The production rate of X2O ice is denoted as RX2O, where X is H or D; RHDO ∝ fDRH2O and  , where fD is the atomic D/H ratio. Then, the total amount of D2O is sensitive to the water ice formation in the later stage when deuterium fractionation is efficient. This makes D2O a good probe of the water ice formation in the later stage.
The scenario also explains the higher levels of deuterium fractionation in formaldehyde and methanol than that in water in the inner hot regions around protostars (e.g., Parise et al. 2006); formaldehyde and methanol form via the sequential hydrogenation of CO ice (e.g., Watanabe & Kouchi 2002) primarily in prestellar cores, where deuterium fractionation is enhanced (Cazaux et al. 2011; Taquet et al. 2012; Furuya et al. 2016b). In summary, the chemical and isotopic compositions of the ISM ice are characterized not only by the bulk ice composition, but also by the differentiation within the ice mantle, reflecting the physical and chemical evolution during the prestellar stages (e.g., Rodgers & Charnley 2008; Boogert et al. 2015).
Visser et al. (2009b, 2011) studied the chemical evolution from prestellar cores to circumstellar disks with an axisymmetric two-dimensional (2D) collapse model. They suggested that disks contain significant amounts of interstellar H2O ice that has been delivered from cores without experiencing significant UV and thermal processing. In order to test this scenario observationally, we need a chemical tracer that probes the processing of water ice, i.e., deuteration. One may think that if the claim of Visser et al. were true, it would hold for HDO ice as well and the prestellar HDO/H2O ice ratio would be preserved. This assumption would be correct, if the ISM ices were mixed well in terms of chemical composition. However, given the layered ice structure in the ISM, the situation for HDO can be different from that for H2O because the upper ice mantle layers, where the large portion of HDO is present, interact with the gas phase more easily than the lower ice mantle layers.
The aim of the present work is to investigate the delivery of layered ice from prestellar cores to forming disks with a special focus on regular and deuterated water. We revisit the collapse model of Visser et al. with a multiphase gas-ice chemical model, in which the ice layered structure and deuteration are considered. In terms of chemistry, the protostar and disk formation may be divided into three stages: (i) processing of prestellar materials (gas and ice) by stellar heating and UV photons (van Dishoeck & Blake 1998); (ii) accretion shock heating upon disk entry (Lunine et al. 1991; Sakai et al. 2014); and (iii) chemical evolution and redistribution of angular momentum (i.e., materials) in the forming disk. The main focus of this work is stage (i), although our model follows the physical and chemical evolution in the disk as well. The accretion shock heating is not taken into account in our model; for the dust grain size assumed in the present work (radius of 0.1 μm), the stellar heating of dust grains dominates over the shock heating (Visser et al. 2009b). Preliminary results of this work are in part presented in Furuya et al. (2016a), which appears in the proceedings of the 6th Zermatt ISM Symposium.
This paper is organized as follows. We describe our physical and chemical models in Sects. 2 and 3, respectively. In Sect. 4 we present the structure of water ice abundances and the deuteration ratios in an infalling envelope and in a forming disk in our fiducial model. Parameter dependences are discussed in Sect. 5. The implication of our results to arguments on the origin of disk and cometary water is addressed in Sect. 6. Differences between the level of deuteration in water and that in organics are also discussed. Our findings are summarized in Sect. 7.
2. Physical model
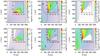 |
Fig. 1 Spatial distributions of the gas density (left), dust temperature (middle), and stellar FUV radiation field normalized by cosmic ray-induced radiation field (104 photons cm-2 s-1; right) at t = 0.5tacc (top) and 0.9tacc (bottom) in our fiducial model. In the middle panel, contours are drawn at 100 K, 50 K, 30 K, and 20 K. Insets zoom in on the disk. The disk surface is shown with the gray solid line. |
We simulate the physical evolution from the collapse of rotating prestellar cores to the formation of circumstellar disks, adopting the axisymmetric, semi-analytical, 2D model developed by Visser et al. (2009b, 2011) and adjusted by Harsono et al. (2013). We briefly present features of the model; more details can be found in the original papers. The model describes the temporal evolution of the density and velocity fields in a semi-analytical manner, following the inside-out collapse model with the effect of rotation (Shu 1977; Cassen & Moosman 1981; Terebey et al. 1984) and the one-dimensional accretion disk model with the α viscosity prescription (Shakura & Sunyaev 1973; Lynden-Bell et al. 1974; Visser & Dullemond 2010). The vertical density structure of the disk is set by the assumption of hydrostatic equilibrium, i.e., self-gravity of the disk is not considered. The disk surface is defined as regions in which the ram pressure of infalling gas from the envelope to the disk equals the thermal pressure of the disk. The effect of magnetic fields is neglected except for the consideration of outflow cavities, which are added manually. The motivation behind this addition is to explore the impact of outflow cavities on chemistry through enhanced temperatures and stellar far-UV (FUV, 6–13.6 eV) radiation field. The position of the outflow cavity wall at a given time t is 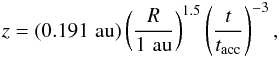 (1)where R and z are cylindrical coordinates (see Drozdovskaya et al. 2014, for more details). The parameter tacc is defined as M0/Ṁ, where M0 is the initial core mass and Ṁ is the accretion rate of infalling gas onto the star-disk system (Shu 1977). The t-3 dependence means that the opening angle of the cavity increases with time. Inside the cavity, the gas density is set to be a constant 104 cm-3.
The dust temperature and stellar FUV radiation field are critical for the chemistry. Given the density structure, they are calculated by solving the wavelength-dependent radiative transfer at each timestep with RADMC-3D1. The interstellar radiation field is neglected under the assumption that the core is embedded in an ambient molecular cloud. The gas and dust temperatures are initially set to be 10 K throughout the core. It should be noted that viscous heating, which is important for the temperature of the inner disk (D’Alessio et al. 1997; Harsono et al. 2015) is not considered. Since the main focus of this paper is the delivery of water ice from a protostellar envelope to a disk rather than processing in a disk itself, the omission does not affect our primary conclusions. In low density and UV irradiated regions, the gas temperature can be higher than the dust temperature (e.g., Draine 1978). We calculate the temperature difference between gas and dust using an analytical prescription based on detailed thermochemical models by Bruderer et al. (2012; S. Bruderer 2015, priv. comm.). The impact of the gas-temperature modification is not significant at least for water chemistry discussed in this paper.
Initially, the core has a power-law density distribution ∝r-2, where r is the distance from the center of the singular core with an outer boundary of ~7000 au and core mass of M0 = 1 M⊙. The effective sound speed, which is the parameter that sets the speed of the collapse expansion wave, is set to cs = 2.6 × 104 cm s-1. In our fiducial model, a solid-body rotation rate of the core is assumed to be Ω = 10-13 s-1, and thus the ratio of rotational energy to the gravitational energy is only ~0.8 (Ω/10-13 s-1)%. The adopted energy ratio is similar to the typical value inferred from observations of dense cores (Goodman et al. 1993; Caselli et al. 2002). The α viscosity of the disk is set to αvis = 10-2 regardless of space and time. The protostar is assumed to be born at 2 × 10⁴ yr after the onset of collapse (see Visser et al. 2009b, for the detailed discussion). The model follows the physical evolution until the end of the main accretion phase, t = tacc ~ 2.5 × 10⁵ yr, when the gas accretion onto the star-disk system is almost complete (>99% of the total mass is in the star-disk system). Our fiducial model corresponds to case 7 in Visser et al. (2009b) and infall-dominated disk case in Drozdovskaya et al. (2014).
Figure 1 shows the physical structure at t = 0.5tacc and 0.9tacc in our fiducial model. The disk outer radius increases with time and finally reaches ~280 au at t = tacc (not shown). The disk is denser and colder than the envelope material, but warmer than 20 K. It is seen that the envelope regions close to the outflow cavity walls are subject to higher levels of stellar UV radiation, while the disk is heavily shielded from UV irradiation.
3. Chemical model
Fluid parcels are traced in the physical model, and a gas-ice chemical simulation is performed along the streamlines (e.g., Drozdovskaya et al. 2014). The chemical evolution along a total of ~35 000 streamlines is calculated for our fiducial model to investigate the envelope-scale and disk-scale chemical structures with their time evolution. The ~35 000 fluid parcels are randomly distributed throughout the core at the onset of the collapse. We adopt the rate equation method and the chemistry is described by a seven-phase model, which is introduced as a natural extension of the three-phase model proposed by Hasegawa & Herbst (1993). The three-phase model considers the gas phase, a surface of ice, and the bulk ice mantle, assuming that the bulk mantle has uniform chemical composition for simplicity. Our seven-phase model to some extent takes a depth-dependent ice structure into account by considering the bulk mantle as, at most, five distinct phases. We chose the seven-phase model, considering the balance between the computational time and the resolution of an ice layered structure. A detailed description of the method is given in Appendix A. As chemical processes, we consider gas-phase reactions, interaction between gas and (icy) grain surface, and surface reactions. We assume the top four monolayers of the ice are chemically active following Vasyunin & Herbst (2013), i.e., the top four ice monolayers are considered to be a surface. The bulk ice mantle is assumed to be chemically inert in our fiducial model (i.e.,  in Eq. (A.8)).
We use the same chemical network as in Furuya et al. (2015) except that species containing chlorine, phosphorus, or more than four carbon atoms were excluded. The network is originally based on the gas-ice chemical reaction network of Garrod & Herbst (2006) supplemented by the high-temperature gas-phase reaction set from Harada et al. (2010). The network has been extended to include singly, doubly, and triply deuterated species (Aikawa et al. 2012; Furuya et al. 2013), and nuclear spin states of light species (Hugo et al. 2009; Hincelin et al. 2014). In total, the network consists of 728 gaseous species, 305 icy species for each ice phase, and ~85 000 reactions.
The binding energy of water on a surface is set to be 5700 K (Fraser et al. 2001), which corresponds to a sublimation temperature of 100–150 K for the relevant density range in our model. Since the details of our treatment of the chemical processes are given in Furuya et al. (2015), we present here only the treatment of chemistry induced by UV photons and the adopted initial molecular composition for the collapse model. Unlike Furuya et al. (2015), the modified rate method of Garrod (2008), which can take into account the competition between surface processes in the stochastic regime, is not used in this work in order to shorten the computational time. We confirmed, by running our chemical model with the modified rate method for several streamlines, that this omission does not significantly affect the water chemistry discussed in the present paper. There are two potential rationales for the nonsignificant stochastic effect. First, a moderately high thermal hopping-to-desorption energy ratio of 0.5 is assumed in our model (also the surface diffusion through quantum tunneling is not allowed in our model); and, second, our collapsing cores have a relatively high gas density (>104 cm-3 for 10 K and orders of magnitude higher densities for warmer regions). Both the slower surface diffusion and higher gas density (i.e., higher adsorption rates onto dust grains) tend to reduce the stochastic effect (e.g., Vasyunin et al. 2009).
3.1. Chemistry induced by UV photons
3.1.1. Gas phase
We consider chemistry induced by stellar and cosmic ray-induced UV photons. In the physical model, the wavelength-dependent stellar UV flux is calculated at each point in the core. We approximate the photodissociation and photoionization rates by scaling the rates for the interstellar radiation field using the wavelength-integrated FUV flux at each point. Self-shielding for H2, HD, CO, and N2 and mutual shielding by H2 for HD, CO, and N2 are taken into account (Draine & Bertoldi 1996; Visser et al. 2009a; Wolcott-Green & Haiman 2011; Li et al. 2013). The effective column densities of H2 and other self-shielding species at each point are calculated following the method of Visser et al. (2011, see their Sect. 3.1). Photorates for cosmic ray-induced UV are calculated following Gredel et al. (1989).
3.1.2. Solid phase
Photodissociation of water ice can lead to several outcomes including desorption of water and its photofragments into the gas phase (Andersson & van Dishoeck 2008). The total photodissociation rate (cm-3 s-1) of water ice on an icy grain surface is calculated similar to Furuya et al. (2015) as follows: ![Mathematical equation: \begin{eqnarray} R^{\rm tot}_{{\rm ph}, \,i} &=& f_{{\rm abs}, \,i} \pi a^2 n_{\rm gr} F_{\rm UV}, \label{eq:photodiss} \\[3mm] f_{{\rm abs}, \,i} &=& \theta_i P_{{\rm abs}, \,i} \times {\rm min}(N_{\rm layer}, \,\, 4), \label{eq:photodiss2} \end{eqnarray}](/articles/aa/full_html/2017/03/aa29269-16/aa29269-16-eq49.png) where ngr is the number density of dust grains per unit gas volume, a is the radius of dust grains (10-5 cm), fabs,i is the fraction of the incident photons absorbed by species i (i.e., water ice here), and FUV is the flux of stellar or cosmic ray-induced UV photons. The parameter θi is the surface coverage of species i, which is defined as a fractional abundance of species i in the top four monolayers (i.e., on the surface;
where ngr is the number density of dust grains per unit gas volume, a is the radius of dust grains (10-5 cm), fabs,i is the fraction of the incident photons absorbed by species i (i.e., water ice here), and FUV is the flux of stellar or cosmic ray-induced UV photons. The parameter θi is the surface coverage of species i, which is defined as a fractional abundance of species i in the top four monolayers (i.e., on the surface;  , where
  is the number density of species i on the surface). The parameter Pabs,i is the probability of photoabsorption by one monolayer of pure water ice, which is calculated by convolving the wavelength-dependent photoabsorption cross sections of water ice (Mason et al. 2006) with the emission spectrum of the interstellar radiation field (Draine 1978) and with that of the cosmic ray-induced radiation field (Gredel et al. 1989). The parameter Nlayer is the number of monolayers of ice in total, and the term min(Nlayer, 4) in fabs,i corresponds to the absorption by up to four outermost monolayers. Arasa et al. (2015) studied the possible outcomes of H2O, HDO, and D2O photodissociation in H2O ice and derived their probabilities per dissociation (bj), using molecular dynamics simulations. With their results, the rate of each outcome j is calculated by
  . The photodesorption yield of water (desorbed as OX or X2O, where X is H or D) per incident UV photon is ~ 3 × 10⁻⁴ in our model.
For the other icy species, the photoabsorption probability is calculated by  , where
  is the photodissociation rate in the gas phase for the interstellar radiation field. It is assumed that all photofragments remain on the surface for simplicity. Instead the photodesorption rates are calculated by Eqs. (2) and (3), but Pabs,i and min(Nlayer, 4) are replaced by the experimentally derived photodesorption yield and min(Nlayer/ 4, 1), respectively (e.g., Bertin et al. 2012; Fayolle et al. 2013). For species for which the yield is not available in the literature, we assume a yield of 10-3 per incident photon.
UV photons can penetrate deep into the ice and dissociate molecules in the bulk ice mantle as well as those on the surface. In our fiducial model, it is implicitly assumed that the photofragments in the ice mantle recombine immediately. The effect of this assumption is discussed in Sect. 5.1.
3.2. Initial abundances
In order to set the molecular abundances at the onset of collapse, we reran the model of molecular cloud formation from diffuse H i dominated clouds for 8 × 10⁶ yr (Bergin et al. 2004; Hassel et al. 2010; Furuya et al. 2015), followed by a further molecular evolution for 3 × 10⁵ yr under prestellar core conditions; the gas density, temperature, and the visual extinction are set to 2 × 104 cm-3, 10 K, and 10 mag, respectively. The cosmic ray ionization rate of H2 is set to be 5 × 10-17 s-1 (Dalgarno 2006). The elemental abundance of deuterium with respect to hydrogen is set to [D/H] elem = 1.5 × 10⁻⁵ (Linsky 2003).
Figure 2 shows the initial ice layered structure for the collapse model. In the inner ice layers (i.e., ice layers formed in the early evolution; <50 MLs) H2O is the dominant constituent, while in the outer layers the fraction of CO and its hydrogenated molecules become significant. The trend is qualitatively consistent with infrared observations of the ISM ice (Pontoppidan 2006; Öberg et al. 2011). It is also seen that the fraction of deuterated water increases toward the outer layers as discussed in Sect. 1. The total H2O ice abundance with respect to gaseous hydrogen nuclei is 1.1 × 10⁻⁴. The HDO/H2O ratio and the D2O/HDO ratio in the entire ice mantle are 8.7 × 10⁻⁴ and 4.9 × 10⁻³, respectively, which reproduce the observationally derived values toward the Class 0 protostar NGC 1333-IRAS 2A within a factor of 2 (Coutens et al. 2014). The agreement between the modeled and observational values justifies our initial layered ice structure for the collapse model (see Furuya et al. 2016b, for further discussion).
In Table 1, we summarize the parameters considered in this paper. The impact of some of these parameters is discussed in Sect. 5.
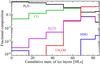 |
Fig. 2 Initial layered ice structure at the onset of collapse. The ice consists of 86 MLs in total. The ice surface (top 4 MLs) and five distinct mantle phases have different chemical compositions. |
Summary of adopted parameters.
4. Results from the fiducial model
4.1. Infalling envelope
Given the complexity of our physical and chemical models, we present the global picture of water ice chemistry rather than discuss the detailed chemical evolution of individual fluid parcels.
Figure 3 shows spatial distributions of the fluid parcels on a 1000 au scale at t = 0.3tacc, 0.5tacc, 0.7tacc, and 0.9tacc. At t = 0.3tacc for example, the star-disk system has ~30% of the total core mass, while the envelope has ~70% of the total mass. Each fluid parcel experiences different physical conditions in the infalling protostellar envelope (see Fig. 7 in Drozdovskaya et al. 2014, for examples). Reflecting different histories, the H2O ice abundance (left panels) and the HDO/H2O ice ratio (right panels) vary among the fluid parcels. It is seen that the H2O ice abundance is almost unaltered in the infalling envelope except for the regions close to the outflow cavity wall, in which H2O ice is largely destroyed by stellar UV photons. The size of the regions where H2O ice is lost increases with time as the opening angle of the cavity increases and the density of the envelope decreases, both of which allow the deeper penetration of the stellar UV photons into the envelope. The regions with a high dust temperature (>100 K), where water ice sublimates, are small (<several of tens au, depending on time) in the fiducial physical model. Thus thermal desorption is not important for the water abundance structure on a 1000 au scale. Our results are consistent with the earlier findings by Visser et al. (2011), i.e., the majority of H2O is delivered to the disk as ice without significant UV processing and sublimation, while some H2O is lost in the protostellar envelope prior to disk entry.
The HDO/H2O ratio is found to be more sensitive to the stellar UV photons in the envelope (Fig. 3, right panels). The HDO/H2O ratio is lower than the initial value (~10-3) even in regions where the H2O ice abundance is almost unaltered (see Sect. 4.3 for more quantitative discussions). This is a consequence of the layered structure of the ice; most HDO is present in the upper layers of ice mantles, which are destroyed via photodissociation and thermal desorption of the photofragments prior to the destruction of the lower ice layers, where most H2O is present (see Fig. 2). The selective loss of HDO ice leads to the decrease in the HDO/H2O ratio, depending on the streamline. In our fiducial model, water ice in the protostellar envelope has a variation in the HDO/H2O ice ratio ranging from ~10-4 to ~10-3. We confirmed that the selective loss of HDO ice does not occur if we assume a well-mixed ice at the onset of collapse.
In summary, there are three cases for water ice chemistry in the infalling envelope, depending on the degree of UV processing experienced along the streamline: (i) the prestellar ice is almost preserved, and both the H2O ice abundance and the HDO/H2O ice ratio are almost unaltered during the collapse; (ii) only the upper layers of the prestellar ice are lost and then the H2O ice abundance is almost unaltered, while the HDO/H2O ice ratio is lowered; and (iii) the entire H2O ice reservoir is largely lost (and partly reformed). The importance of UV processing increases with time, which can lead to a time-dependent disk composition. In case (ii), not only HDO ice but also other icy molecules that are formed later than H2O ice in the prestellar phase, such as regular/deuterated formaldehyde and methanol ices, are selectively lost with respect to H2O ice (see Sect. 6.2).
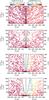 |
Fig. 3 Spatial distributions of fluid parcels on a 1000 au scale at t = 0.3tacc, 0.5tacc, 0.7tacc, and 0.9tacc (from top to bottom) in our fiducial model. Left: H2O ice abundance with a logarithmic scale. Right: ice HDO/H2O ratio with a logarithmic scale. The black solid lines at each panel depict the disk surface and outflow cavity wall. See Fig. 4 for the zoom-in view on the disk. |
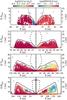 |
Fig. 4 Zoom-in view of Fig. 3 on the disk scale. We note the different spatial scales among the panels. Water snow lines, where the rate of adsorption onto dust grains and that of thermal desorption are balanced, are depicted by dashed lines. The outflow cavity walls are not shown in this figure. |
4.2. Disk
Figure 4 shows the H2O ice abundance (left panels) and the HDO/H2O ice ratio (right panels) on the spatial scale of the forming disk at the selected times. Reflecting the variation of the composition of the accreting materials, the disk composition varies with time. It is also seen that the disk composition at any given time is not spatially uniform, especially at later times.
For more quantitative discussions, we calculate the vertically averaged H2O ice abundance and the HDO/H2O column density ratio as functions of disk radius. We interpolated the molecular compositions of the fluid parcels to the cylindrical coordinates used in the physical simulation, adopting bilinear interpolation. From the gridded data, the vertically averaged abundance and column density ratio for z/R< 0.2 at each radius are calculated, because the spatial distributions of the fluid parcels are sparser at z/R ≳ 0.2. We confirmed that at least 55–80% of the gas mass at each radius lies below z/R = 0.2, depending on time, and that a change of the threshold z/R (0.15 or 0.25) does not significantly affect the resultant abundance and column density ratio. A small number of the fluid parcels have very high HDO/H2O ice ratios of 10-2–10-1 (30 parcels out of ~12 000 parcels at t = tacc for example). Those parcels were not considered in the above calculation because their inclusion with the interpolation makes the radial profile of the HDO/H2O ratio very peaky in some regions (R = 50–130 au at t = tacc, for example). The importance of such super-deuterated water for the disk composition is unclear from our simulations.
Figure 5 shows the vertically averaged H2O ice abundance (top) and the HDO/H2O column density ratio (middle) as functions of radius at selected times. At t< 0.7tacc, the averaged H2O ice abundance is very similar to the initial (precollapse) value of 10-4. At later times, the H2O ice abundance becomes lower than 10-4 at 30 au ≲ R ≲ 100 au by up to a factor of 3, owing to the accretion of H2O ice-poor material onto the disk.
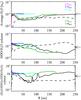 |
Fig. 5 Vertically averaged H2O ice abundance (top), HDO/H2O ice column density ratio (middle), and ice column density ratio of D2O/HDO to HDO/H2O (bottom) in the forming disk as a function of radius at selected times in our fiducial model, represented by different colors (solid lines). Arrows on the right-hand margin indicate the values at the onset of collapse. The disk outer radius increases with time. The black dashed lines represent the prediction assuming in situ formation of water ice in the disk structure given at t = tacc. |
The HDO/H2O ice ratio is almost constant throughout the disk at t< 0.7tacc, and the ratio is higher than the precollapse value (9 × 10⁻⁴) by a factor of up to 2, owing to the additional formation of a small amount (H2O abundance of ~10-6) of highly fractionated (HDO/H2O > 10-2) water ice during the collapse. At later times, the HDO/H2O ice ratio tends to decrease with radius, owing to the accretion of material with a low HDO/H2O ice ratio (~10-4) onto the outer disk. This radial trend contrasts with the trend expected from the disk thermal structure; as the gas temperature decreases with radius, the level of deuterium fractionation is expected to increase with radius. For confirmation we ran the chemical model on the disk structure given at t = tacc for a selection of ~200 spatial points, assuming that chemical species are initially in atomic form except for hydrogen and deuterium which are locked up in H2 and HD, respectively. We assumed that the ortho-to-para ratio of H2 is locally thermalized (i.e., OPR(H2) = 9exp(−170 /Tgas)) in this simulation for simplicity. After 2.5 × 10⁵ yr (=tacc), the vertically averaged abundance of H2O ice reaches ~ 5 × 10⁻⁵ at R ≳ 30 au, inside which the production of H2O ice is less efficient due to the higher dust temperatures (≳30 K) even in the midplane. The HDO/H2O ice column density ratio increases with radius as expected (dashed line in Fig. 5). The qualitative difference between the radial profile of the HDO/H2O ratio in our fiducial model and that predicted from the disk thermal structure demonstrates the importance of the dynamical evolution and the ice layered structure, with the latter mostly established in the precollapse phase.
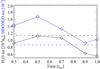 |
Fig. 6 Bulk disk-averaged H2O ice abundance (black) and HDO/H2O ice ratio (blue) as functions of time in the fiducial model. The horizontal dashed lines indicate their values at the onset of collapse. |
From the radial profiles of the H2O ice and HDO ice column densities, the average H2O ice abundance and HDO/H2O ice ratio in the whole disk are calculated, assuming axisymmetry. Figure 6 shows the bulk disk-averaged H2O ice abundance and HDO/H2O ice ratio as functions of time. The deviations from the precollapse values are factors of ~2 at most, regardless of time. Therefore, when averaged over the whole disk, the forming disk contains an H2O abundance and a HDO/H2O ratio similar to those at the onset of collapse in our model, while the local vertically averaged disk compositions show larger differences, especially at late times (Fig. 5).
4.3. Details of water and deuterium chemistry
The above subsections have shown that water chemistry in our model is dominated by processes induced by stellar UV photons in the envelope. Fluence is the time integral of flux with a unit of cm-2 in cgs. For a more detailed analysis, we define normalized fluence for each fluid parcel along its streamline,  , as
, as ![Mathematical equation: \begin{eqnarray} \overline{Ft} = \int_{0}^{t_{\rm acc}} [F_{\ast}(\bm{l}(t)) + F_{\rm CRUV}] {\rm d}t/\int_{0}^{t_{\rm acc}} F_{\rm CRUV} {\rm d}t, \label{eq:ft} \end{eqnarray}](/articles/aa/full_html/2017/03/aa29269-16/aa29269-16-eq104.png) (4)where F∗ and FCRUV are the local flux by the stellar and cosmic ray-induced UV photons, respectively, and l(t) is the position vector of a fluid parcel in cylindrical coordinates at a given time t. Since the cosmic ray-induced UV photons set the minimum of the UV radiation field in our model, the normalized fluence can be used as a measure of the importance of the stellar UV radiation. In our model, FCRUV is constant, 104 photons cm-2 s-1, for simplicity, neglecting an attenuation effect of cosmic rays for large column densities (Umebayashi & Nakano 1981). It is worth mentioning again that the disk is heavily shielded from the stellar UV irradiation (Fig. 1).
(4)where F∗ and FCRUV are the local flux by the stellar and cosmic ray-induced UV photons, respectively, and l(t) is the position vector of a fluid parcel in cylindrical coordinates at a given time t. Since the cosmic ray-induced UV photons set the minimum of the UV radiation field in our model, the normalized fluence can be used as a measure of the importance of the stellar UV radiation. In our model, FCRUV is constant, 104 photons cm-2 s-1, for simplicity, neglecting an attenuation effect of cosmic rays for large column densities (Umebayashi & Nakano 1981). It is worth mentioning again that the disk is heavily shielded from the stellar UV irradiation (Fig. 1).  , i.e., when the cosmic ray-induced UV dominates over the stellar UV, corresponds to ~ 2 × 10⁷ incident UV photons per one dust grain up to tacc in our model.
Figure 7 shows the abundances of H2O ice (top) and HDO ice (middle), and the HDO/H2O ice ratio (bottom) as functions of in the fluid parcels which are located in the disk at t = tacc. It is clear that the cosmic ray-induced UV has a negligible impact on the water ice abundances, while the stellar UV dominates the water ice chemistry. An anti-correlation between the UV fluence and the H2O ice abundance is seen especially at  . The dashed blue and red lines in the figure represent the expected water ice abundances as functions of when only photodesorption is an allowed chemical process and when only photodissociation and photodesorption are allowed, respectively,
  (5)where
  is the abundance of HXO ice, where X is H or D, in parcels with
  .
.  is similar to Eq. (2) but ngr and FUV are replaced by the abundance of dust grains and the time-averaged flux along a streamline,
  , respectively. On the evaluation of Eq. (5), θH2O was set to be 0.35 (i.e., the rest of the ice mantle consists of other species), which comes from the average fraction of H2O in the topmost ~50 MLs of the ice mantle at the onset of collapse (cf. Fig. 2). That is smaller than the average fraction of H2O in the entire ice mantle, ~0.5, but larger than the surface coverage of H2O ice, ~0.2. The parameter bj is the branching ratio of each outcome j of H2O ice photodissociation (Arasa et al. 2015). It is clear that the photodissociation of H2O ice is much more important for H2O ice destruction than photodesorption. Given the warm temperature of the protostellar envelope (≳20–30 K, see Fig. 1), which reduces the probability of hydrogenation on the grain surface upon H atom adsorption, the reformation of H2O ice is not efficient enough to compensate for its photodissociation. However, considering the numerical data are (well) above the red line, the reformation of H2O ice is not negligible. The scatter in the H2O ice abundance at the high fluence regime likely comes from the difference in the dust temperature when water ice is (partly) reformed. The reformation of H2O ice via OHice + Hice competes with the formation of CO2 ice via OHice + COice, the latter of which becomes more favorable with increasing dust temperature. At higher dust temperatures (≳40–50 K), where surface chemistry is inefficient, gaseous O2 is the dominant product of water ice destruction, which forms via the neutral-neutral reaction in the gas phase, OH + O (see also Drozdovskaya et al. 2016; Taquet et al. 2016).
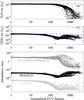 |
Fig. 7 H2O ice (top) and HDO ice (middle) abundances in the fluid parcels that are located in the disk at t = tacc as functions of the normalized UV fluence. The bottom panel shows HDO/H2O ice ratio (black), D2O/H2O ice ratio (light gray), and the ratio of D2O/HDO to HDO/H2O ice ratio (gray). Only the fluid parcels in which the H2O ice abundance is larger than 10-5 are plotted. The blue and red dashed lines depict the expected H2O (or HDO) ice abundance when only photodesorption is an allowed chemical process and when only photodissociation and photodesorption are included, respectively. See the main text for more details. |
The HDO ice abundance and the HDO/H2O ice ratio show more complex behavior: they start to drop at  , while in the higher fluence regime, where H2O ice starts to be largely destroyed and partly reformed, the HDO ice abundance and the HDO/H2O ice ratio tend to stay constant or increase with the fluence. The former indicates again that the HDO ice abundance is more sensitive to the photochemistry than that of H2O ice; the upper ice layers where most HDO is present are lost prior to the lower ice layers where most H2O is present. The red line in the middle panel shows Eq. (5) for HDO with θHDO of 2 × 10⁻³ (cf. Fig. 2). The line reproduces the numerical data at
  . The behavior of the HDO ice abundance in the higher fluence regime indicates that the level of deuterium fractionation in reformed water ice is similar to or higher than that in the original water ice (i.e., water ice before the destruction). This implies that using the HDO/H2O ratio as a probe of the prestellar inheritance of H2O is limited because the HDO/H2O ratio does not enable a distinction between the original and reformed ice. Alternatively, in the bottom panel of Fig. 7, it is seen that the ratio of D2O/HDO to HDO/H2O is different between the original and reformed water ice. This implies that the ratio of D2O/HDO to HDO/H2O is a better probe of the prestellar inheritance of H2O than solely the HDO/H2O ratio. We discuss this probe of the prestellar inheritance in more detail in Sect. 6.1.
The rationale for the high HDO/H2O ratio in the reformed water ice is twofold: first, the photofragments are highly enriched in deuterium as the original ice was highly enriched in deuterium, and, second, it takes some time for the photofragments to reach the equilibrium level (i.e., low level) of deuterium fractionation at the warm temperatures of the envelope via gas-phase ion-neutral chemistry. Then, if the timescale of ice reformation is shorter than the relaxation timescale of deuterium fractionation, the fractionation in the photofragments (i.e., the original ice) is transferred to the reformed ice. This is the case in our model. Additionally there are pathways of deuterium fractionation in the gas phase that can work even at warm gas temperatures, e.g., OH + D → OD + H + 810 K (Millar et al. 1989; Atahan et al. 2005). OD in the gas phase can freeze out onto (icy) dust grains, followed by the formation of HDO ice via ODice + Hice.
5. Parameter dependencies
5.1. Effect of bulk ice chemistry
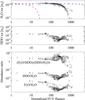 |
Fig. 8 Similar to Fig. 7, but for the model with the bulk ice chemistry (shown by square). Gray crosses show the results from our fiducial model for comparisons. |
In our fiducial model it is assumed that the top four monolayers of ice are chemically active, while the rest of the bulk mantle is inert. However UV photons can penetrate deeper into the ice (>100 MLs) and dissociate icy molecules. To check the impact of this assumption on the inert bulk mantle, we performed additional simulations in which bulk ice chemistry (including two-body reactions and photodissociation) in each mantle phase is taken into account (i.e.,  and
and  in Eq. (A.8)). For two-body reactions, we assume that species thermally diffuse in ice and react with each other when they meet analogously to grain-surface reactions (Garrod 2013). We only allow reactions between species within the same mantle phases, assuming that vertical motion of species is limited (≲8 MLs, as each mantle phase has at most ~17 MLs) and the longer range vertical diffusion is not important. We set the energy barrier against thermal diffusion in ice to be 1.2Edes, where Edes is the binding energy on a surface. For photodissociation, we use a similar formula as Eq. (2), but additionally consider UV attenuation in ice by evaluating the photon absorption probability in each mantle phase in order from upper to lower mantle phases. The effect of the UV attenuation is minor, as ice with a thickness of ≲100 MLs is optically thin against UV photons (Andersson & van Dishoeck 2008). For simplicity, we assume that all photofragments remain trapped in ice (i.e., the possibilities of reformation and desorption are not considered). Since the inclusion of the bulk ice chemistry increases the runtime of the chemical model considerably, we ran the model only for a selection of ~200 fluid parcels, which are located in the disk at t = tacc.
Figure 8 shows abundances of H2O ice (top) and HDO ice (middle), the HDO/H2O ice ratio, and the ratio of D2O/HDO to HDO/H2O (bottom) as functions of in the selected ~200 fluid parcels. We confirm that the bulk ice chemistry does not affect our qualitative chemical results, while it can affect the deuterated water ice abundances by a factor of several or less, depending on the streamline. The H2O ice abundance is similar between the two models; reformation of H2O ice via two body reactions (OH + H and OH + H2) in the ice mantle compensates for the destruction by photodissociation in our model with the bulk ice chemistry. The red line in the top panel shows the expected H2O ice abundance when only photodissociation and photodesorption in the entire ice mantle are included. The significant deviation of the numerical data from the red line indicates the importance of the reformation of water ice in the bulk mantle. For the assumed energy barrier (600 K), the timescales of thermal diffusion for H atom and H2 in ice are longer than 1 Myr at 10 K. In our model, the warm temperature of the protostellar envelope promotes the diffusion of such light species inside ice and the reformation of water. This contrasts with our claim in Sect. 4.3 that the warm temperature of the protostellar envelope slows down the reformation of water ice on an icy grain surface because of the efficient thermal desorption of the light species at the ice surface.
5.2. Effect of rotation rate of a prestellar core
The rotation rate of the initial prestellar core is one of the critical parameters for the formation and evolution of circumstellar disks. In our fiducial physical model, the initial solid-body rotation rate of the core is assumed to be 10-13 s-1. In this subsection, we present the model with a lower rotation rate of 10-14 s-1, which corresponds to case 3 in Visser et al. (2009b) and spread-dominated disk case in Drozdovskaya et al. (2014), and discuss its impact on the water ice chemistry. The other physical and chemical parameters are the same as in our fiducial model. The parameter tacc is the same as in our fiducial model.
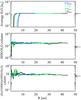 |
Fig. 9 Similar to Fig. 5, but for the model with Ω = 10-14 s-1. The results at t = 0.3tacc are not shown, because most of the disk has higher temperature than the water ice sublimation at the time. |
We confirmed that the spatial distributions of the H2O ice abundance and the HDO/H2O ice ratio on a 1000 au scale are similar to those in the fiducial model; the envelope material has variations in the H2O ice abundance and the HDO/H2O ice ratio depending on the degree of processing by stellar UV photons (see Appendix B for figures). The variations in the envelope, however, are not directly transferred to the disk in the model with the lower rotation rate. This contrasts with the fiducial model. Figure 9 shows the vertically averaged H2O ice abundance and the HDO/H2O ice column density ratio in the disk in the lower rotational core model as functions of radius. The outer disk radius at a given time is smaller than that in the fiducial model. The sharp drop of the H2O ice abundance in the inner regions is due to sublimation of water ice rather than the effect of UV photons. Both H2O ice abundance and HDO/H2O ice ratio are almost constant and independent of radius and time, but the HDO/H2O ratio is enhanced compared to the precollapse value by a factor of two. The enhancement is caused by the additional formation of a small amount of highly deuterated water ice during the collapse as mentioned in Sect. 4.2 for the fiducial model. Because of the lower rotation rate, the envelope material that is exposed to the stellar UV radiation mostly accretes at small spatial scales (i.e., becomes part of the star) or enters into the outflow cavity and does not significantly contribute to the disk formation. The material that is significantly processed by the stellar UV radiation in the envelope tends to have lower specific angular momentum than that which is not significantly processed since the outflow direction and the rotational axis are aligned.
In summary, the initial rotational rate does not affect the water ice chemistry significantly on 1000 au and larger spatial scales, while it can affect the composition of forming disks as the fate of envelope material (falls onto stars, stays in disks, etc.) is largely decided by its initial specific angular momentum. As a cautionary note, the temporal evolution of the star-disk-envelope system and the outflow cavity are not treated in a self-consistent way in our model. Our model also does not explicitly consider the effect of magnetic fields, which may efficiently transfer angular momentum from disks to envelopes (magnetic braking; e.g., Basu & Mouschovias 1994; Yen et al. 2015). More sophisticated 3D nonideal magnetohydrodynamics simulations of protostar and disk formation with chemistry are needed to fully confirm the above claim.
6. Discussion
6.1. Water deuteration as a probe of the prestellar inheritance of H2O
Comets are thought to be the most pristine objects of the cold ice-bearing regions in the solar nebula. Observations of cometary comae indicate that the HDO/H2O ratio ranges from 3 × 10⁻⁴ to 11 × 10-4 depending on the source (with no clear difference in the HDO/H2O ratio between Oort Cloud comets and Jupiter-family comets; e.g., Mumma & Charnley 2011; Altwegg et al. 2015). Based on these measurements, there are long-standing arguments on the origin of cometary water (e.g., Geiss & Reeves 1981; Aikawa & Herbst 1999). The suggested possibilities, as two extremes, range from prestellar inheritance to in situ formation in protoplanetary disks (e.g., Furuya et al. 2013; Albertsson et al. 2014; Cleeves et al. 2014, for recent modeling work). The main difficulty in distinguishing between these two cases comes from the fact that deuterium fractionation of molecules driven by isotopic exchange reactions, such as , can occur efficiently both in the prestellar stages and in the cold midplane of protoplanetary disks (e.g., Aikawa & Herbst 1999).
6.1.1. Inheritance versus in situ formation in disks
Our results (in part) support the prestellar inheritance scenario; interstellar water ice is largely delivered to forming disks without significant alteration. When averaged over the whole disk, our forming disk has an H2O abundance and HDO/H2O ratio that is similar to the precollapse values. On the other hand, because of the selective loss of HDO ice with respect to H2O ice, the local vertically averaged HDO/H2O ice ratio can be more divergent depending on time, distance from the central star, and the rotational rate of the prestellar core. Our fiducial model reproduces the variation in the HDO/H2O ratio observed in comets via the combination of ice formation in the prestellar stages and the selective loss of HDO en route into the disk (see Fig. 5).
However, even if this is the case, chemical processing in forming disks themselves can eliminate the prestellar inheritance. At high gas temperatures, isotopic exchange between HDO and H2 in the gas phase, HDO + H2 ⇌ H2O + HD, is thermally activated, and in equilibrium at Tgas ≳ 500 K, the HDO/H2O ratio is close to the HD/H2 ratio, i.e., 2 × [D/H] elem (Richet et al. 1977). The rate coefficient of the forward reaction at >300 K was measured by Lécluse & Robert (1994). More precisely, they measured the rate coefficient for the D2O-H2 system, and that for the HDO-H2 system was estimated from the assumption of statistical branching ratios. The timescale of the forward reaction, HDO + H2, is given by τ ≈ 10exp(5170 K /Tgas) (1013 cm-3/nH2) yr, for example, at Tgas = 500 K and nH2 = 1013 cm-3, τ ≈ 0.5 Myr. Thus the impact of this reaction is negligible on the timescale of star and disk formation, except for regions with both very high density and very high temperature, i.e., the inner regions of forming disks. Such reprocessed water could be mixed with unprocessed interstellar water via radial spreading and accretion (Drouart et al. 1999; Yang et al. 2013). The resulting radial profile of the HDO/H2O ratio depends on how much material is transported from the very hot, dense inner regions to the outer cold regions. The presence of crystalline silicates in comets in our solar system (e.g., Zolensky et al. 2006) could imply that water was also efficiently thermally processed in the solar nebula (but see, e.g., Vinković 2009; Tazaki & Nomura 2015).
The work by Cleeves et al. (2014) puts limits on the efficiency of the thermal processing in the solar nebula. They show that if water deuteration is completely reset by processing (i.e., HDO/H2O = 2 × [D/H] elem, but volatile oxygen is mostly locked up in H2O and CO), ionization and ice chemistry in Class II disks cannot produce enough HDO to explain the measured level of water deuteration in the solar system. The main limiting factor for the HDO production is the availability of volatile oxygen (see also Willacy et al. 2009; Furuya et al. 2013). The claim is further strengthened if the cosmic rays are modulated by the stellar wind (Cleeves et al. 2013, 2014). Therefore, at least some fraction of disk water would avoid the high-temperature processing in the solar nebula. In summary, it is now possible to explain the HDO/H2O measurements in comets quantitatively by the prestellar inheritance scenario being supported by astrophysical and chemical models.
On the other hand, it is also possible to explain the HDO/H2O measurements in comets via Class II disk chemistry with turbulent mixing, regardless of the initial disk compositions. Furuya et al. (2013) and Albertsson et al. (2014) independently claim that abundant water ice with cometary HDO/H2O ratios can be formed in their Class II disk chemical models with turbulent mixing, regardless of the initial HDO/H2O ratio. Turbulence can bring ice-coated dust grains from the disk midplane to the disk surface where stellar UV and X-ray radiation destroy ices. Similarly, turbulence can bring atomic oxygen from the disk surface to the midplane, where volatile oxygen is largely locked up in the ice. The cycle of destruction and reformation resets the chemical composition, and then the steady-state composition in the turbulent disk model does not depend on the initial composition, but does depend on the thermal structure of disks. The models predict that the HDO/H2O ice ratio increases with radius reflecting the thermal structure of disks. As a cautionary note, it is unclear if the turbulent disk chemistry can reach steady state in reality. The models of Furuya et al. (2013) and Albertsson et al. (2014) did not consider the effect of gas accretion onto the central star and dust evolution, which can lead to nonequilibrium chemical compositions. Furthermore, recent observations suggest that the turbulence in the surface layers of disks is not strong (nonthermal motion is less than 3% of the local sound speed), meaning that turbulent mixing may also be weaker than commonly assumed in models (Flaherty et al. 2015).
6.1.2. The ratio of D2O/HDO to HDO/H2O
The main question here is again how we can observationally distinguish between inheritance and in situ formation of water in a protoplanetary disk. To complicate matters further, our models show that even if interstellar water ice is destroyed by stellar UV and reformed prior to the disk entry, the HDO/H2O ratio in reformed water ice is similar to the original value (Fig. 7). One way could be to constrain the disk radial profile of the HDO/H2O ratio; the in situ formation scenario predicts that the HDO/H2O ratio is an increasing function of distance from central stars, while the inheritance scenario predicts that the HDO/H2O ratio does not always increase with radius depending on parameters. Another way is to look for probes of prestellar inheritance other than the HDO/H2O ratio.
A possible alternative is the ratio of D2O/HDO to HDO/H2O (hereafter fD2/fD1 ratio). In contrast to the HDO/H2O ratio, the fD2/fD1 ratio is significantly different between the original and reformed water ices (10 versus ~0.1; see the bottom panel of Fig. 7). The water observations toward low-mass protostellar cores have suggested that the water ice formed in the prestellar stages may be characterized by a high fD2/fD1 ratio of >1. Coutens et al. (2014) quantified the fD2/fD1 ratio to be ~7 in the hot inner regions (>100 K) around the Class 0 protostar NGC 1333-IRAS 2A, where water ice has sublimated. Quasi-steady-state chemistry of water ice formation on grain surfaces leads to fD2/fD1 ≤ 0.25 (cf. Rodgers & Charnley 2002). Furuya et al. (2016b) proposed that the anomalously high fD2/fD1 ratio is a natural consequence of chemical evolution during low-mass star formation. First, the majority (≳90%) of volatile oxygen is locked up in water ice and other O-bearing molecules without significant deuterium fractionation. Second, at later times, water ice formation continues with reduced efficiency but with enhanced deuterium fractionation; the probability of deuteration with respect to hydrogenation is enhanced by a factor of ≳100. The enhancement of deuterium fractionation can be triggered by a drop in the ortho-to-para nuclear spin ratio of H2, CO freeze-out and the attenuation of the interstellar UV field. When either of the two conditions is not satisfied, the fD2/fD1 ice ratio is close to 0.25 or smaller. In the warm infalling protostellar envelope, it is difficult to satisfy both conditions, especially the second condition. Therefore, the reformed water ice in the warm envelope has a lower fD2/fD1 ratio than the original water ice.
The chemical processing in disks discussed above leads to the fD2/fD1 ratio of around unity or smaller. The thermally induced exchange reactions XDO + H2 ⇌ XHO + HD, where X is H or D, in the inner regions of forming disks would lead to fD2/fD1 of unity in equilibrium at high temperatures (>500 K). We checked the Class II turbulent disk chemical model of Furuya et al. (2013) and found that the fD2/fD1 ratio is around unity or smaller in regions where abundant water ice is present reproducing the cometary HDO/H2O ratios (see Appendix C). Taken together, the fD2/fD1 ratio better probes the prestellar inheritance of H2O than the HDO/H2O ratio. The radial profiles of the fD2/fD1 ice ratio in our models are shown in the bottom panels of Figs. 5 and 9. The fD2/fD1 ice ratio is much larger than unity except for the regions where the H2O ice abundance is low, i.e., the fD2/fD1 ratio is a measure of how much H2O was lost during the disk formation. The comparisons between the observationally derived fD2/fD1 ratio in the bulk ice in clouds/cores and that in disks/comets would provide the strongest constraints on the prestellar inheritance of H2O. There is no detection of D2O in comets yet in the literature. In addition, whether fD2/fD1> 1 is common in low-mass star-forming regions is not fully confirmed observationally. More D2O observations toward protostars and comets with detections of H2O and HDO are highly desired.
6.2. Water deuteration versus organics deuteration
Observations toward the inner hot regions (>100 K) around Class 0 low-mass protostars, where ices have sublimated, have found that formaldehyde and methanol show higher levels of deuterium fractionation than water typically by a factor of 10 or more (e.g., Parise et al. 2006; Coutens et al. 2013; Persson et al. 2014). The inferred gas-phase fractionation ratios are thought to reflect those in the ice through thermal desorption. This idea is supported by 1D collapsing core models with detailed gas-ice chemical models (e.g., Aikawa et al. 2012; Taquet et al. 2014). We confirmed that our 2D model at early times (t = 0.3tacc), which considers the effect of stellar UV radiation unlike the 1D models, also supports this idea, although the size of the hot regions in our model is more compact (~10 au) than the size of the emission estimated from the observations (several tens of au; Persson et al. 2013; Maury et al. 2014; Taquet et al. 2015). Thus it is likely that the icy organics have higher deuteration than water ice in the ISM. This trend likely reflects the different epoch of their formation, i.e., H2O ice is formed earlier than HDO, formaldehyde and methanol ices during star formation. Recent astrochemical models have successfully reproduced this trend (Taquet et al. 2014; Furuya et al. 2016b).
The main question here is whether or not the higher deuteration in organics is transferred to circumstellar disks. Hereafter we use the D/H ratio of molecules instead of the abundance ratio between the regular and deuterated forms; the former is often used in the solar system community. For molecule HnX, [D/H] HnX = n-1 × (Hn−1DX/HnX). Then [D/H] H2O = 0.5 × (HDO/H2O). Observations of cometary comae have quantified [D/H] H2O at ~ (1−6) × 10-4 (e.g., Altwegg et al. 2015). The detection of other deuterated molecules in comae is not reported except for DCN in comet Hale-Bopp. The measured D/H ratio of HCN is 2 × 10⁻³, which is higher than that of water in the same comet by a factor of ~7 (Meier et al. 1998a,b). The upper limits of the D/H ratios of methanol for CH2DOH and for CH3OD in comet Hale-Bopp are 8 × 10⁻³ and 0.025, respectively (Crovisier et al. 2004). Meanwhile, like comets, chondritic meteorites are thought to be pristine probes of the solar nebula. In meteorites, both hydrated minerals (i.e., water) and organic materials contribute to the bulk D/H ratio. Alexander et al. (2012) found that the bulk D/H ratio increases with the bulk C/H ratio in a sample of meteorites, which indicates organics are more enriched in deuterium than water (e.g., Robert 2006; Ceccarelli et al. 2014, for reviews). In summary, these measurements indicate that organics in pristine objects of the solar system are more enriched in deuterium than water, although the available data are limited for comets.
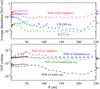 |
Fig. 10 Molecular abundances and D/H ratios in the disk at t = 0.5tacc (solid lines) and t = tacc (dashed lines) as functions of radius in our fiducial model. Top: vertically averaged abundances of H2CO ice, CH3OH ice, and the sum of icy organics with respect to H2O ice. Bottom: the D/H column density ratios of formaldehyde ice, methanol ice, icy organics, and water ice. Arrows on the right-hand margin indicate the values at the onset of collapse. |
The top panel of Fig. 10 shows the vertically averaged abundances with respect to H2O ice of H2CO ice, CH3OH ice, and the sum of icy organics as functions of radius at t = 0.5tacc and t = tacc in the fiducial model. The total abundance of icy organics was calculated by summing the abundances of icy molecules with at least one C-H bond. The lower panel shows their D/H column density ratios. The D/H ratio of methanol ice is calculated by 0.25 × (xCH2DOHice + xCH3ODice) /xCH3OHice, because our chemical network does not fully distinguish the various possible isomers of radicals, such as CH2DO and CH2OD, which are relevant for methanol. The CH2DOH/CH3OD ice ratio in our model is close to the statistical value of 3 due to the incomplete distinction of the isomers. Also, our network does not include the substitution and abstraction reactions of formaldehyde and methanol. These reactions can enhance the level of deuterium fractionation in formaldehyde and methanol and can affect the abundance ratio of methanol isomers (Watanabe & Kouchi 2008). We reran the molecular cloud formation model and the prestellar core model (Sect. 3.2) with a modified network to check the impact of our simplified treatment of icy methanol chemistry. The modification includes the distinction of the possible isomers and the addition of the substitution and abstraction reactions following the method of Taquet et al. (2012). The modified network gives a higher CH2DOH/CH3OD ice ratio (5 versus 3) and a higher D/H ratio of methanol (1 × 10⁻² versus 3 × 10⁻³) at the onset of collapse compared to our fiducial network. The D/H ratios of icy organics are calculated from the total number of D atoms in all icy organics divided by the total number of H atoms in all icy organics as in Cleeves et al. (2016).
At t = 0.5tacc, the CH3OH ice abundance and the total abundance of icy organics are similar to their precollapse values. At t = tacc, the CH3OH ice abundance ranges from 1 to 10% of water ice, which is lower than its precollapse value (see also Drozdovskaya et al. 2014). CH3OH ice is selectively lost with respect to H2O ice, since CH3OH is mostly present in the upper ice layers in contrast to H2O which is mostly present in the lower layers (Fig. 2). This is true for H2CO ice as well. The D/H column density ratios of icy organics in the disk are similar to or slightly higher than their precollapse values, regardless of time and radius, and are higher than the D/H ratio of water ice by a factor of 3 or more. As both regular and deuterated forms of methanol ice are mostly present in the upper ice layers, selective loss of deuterated methanol relative to its regular isotopologue does not occur unlike in water, even if materials are subject to stellar UV radiation. The differences between the D/H ratios of the icy organics and water ice tend to remain or even become enhanced during the collapse and en route into the disk.
7. Summary
We investigated the delivery of regular and deuterated water from prestellar cores to circumstellar disks. We used the axisymmetric 2D model originally developed by Visser et al. (2009b, 2011) to follow the physical evolution of collapsing cores. In the physical simulations, streamlines of fluid parcels were tracked and gas-ice astrochemical simulations were performed along the streamlines. Our findings are summarized as follows.
-
1.
There are three cases for water ice chemistry in the infallingenvelope, depending on the degree of processing by stellar UVphotons that the infalling fluid parcels experience:(i) the prestellar ice is preserved, and both the H2Oice abundance and the HDO/H2O ice ratio are unaltered during the collapse;(ii) only the upper layers of the prestellar ice are lost and then theH2O ice abundance is unaltered, while the HDO/H2O ice ratio is lowered (cf.Fig. 2); and (iii) the entire ice mantle is largely lost(and partly reformed). In the last case, the HDO/H2O ratio in reformed waterice is similar to the original value because the photofragments areenriched in deuterium.
-
2.
Our models suggest that interstellar water ice is largely delivered to forming disks without significant alteration. In our fiducial model, when averaged over the whole disk, the H2O ice abundance and HDO/H2O ice ratio are similar to the precollapse values to within a factor of ~2, regardless of time. On the other hand, the local vertically averaged H2O ice abundance and HDO/H2O ice ratio show larger differences depending on time and distance from the central star, reflecting the variation of the composition of the accreting material.
-
3.
How the chemical differentiation in the protostellar envelope is reflected in the forming disk depends on the solid-body rotation rate of the core in our models, which in turn determines the UV fluence and temperature variations that the infalling fluid parcels experience. As the outflow direction and the rotational axis are aligned, the more significantly processed material by the stellar UV tends to have a lower specific angular momentum. In the model with a lower core rotation rate (Ω = 10-14 s-1; in our fiducial model, 10-13 s-1), the envelope material that was processed via the stellar UV radiation is most likely eventually accreted onto the small spatial scales (i.e., star) or enters into the outflow cavity and does not contribute to the disk material.
-
4.
There are long-standing arguments about the origin of cometary water based on the HDO/H2O ratio. The suggested possibilities range from prestellar inheritance to in situ formation in protoplanetary disks. We propose that the ratio of D2O/HDO to HDO/H2O is a better probe to distinguish the two cases than solely the HDO/H2O ratio (see Sect. 6.1). The comparison between the observationally derived ratio in the bulk ice in clouds/cores and that in disks/comets would provide the strongest constraints on the origin of cometary water. Future D2O observations with H2O and HDO toward hot gas (>100 K) around protostars and toward cometary comae are crucial.
-
5.
Icy organics are more enriched in deuterium than water ice in the forming disks in our models. The trend is inherited from the prestellar stages.
Acknowledgments
We thank the anonymous referee for useful comments that helped to improve this paper. Astrochemistry in Leiden is supported by the Netherlands Research School for Astronomy (NOVA), by a Royal Netherlands Academy of Arts and Sciences (KNAW) professor prize, and by the European Union A-ERC grant 291141 CHEMPLAN. K.F. acknowledges support by the Research Fellowship from the Japan Society for the Promotion of Science (JSPS). M.N.D. acknowledges support by a Huygens fellowship from Leiden University. C.W. acknowledges financial support from the Netherlands Organisation for Scientific Research (NWO, program number 639.041.335). D.H. is funded by Deutsche Forschungsgemeinschaft Schwerpunktprogramm (DFG SPP 1385) The First 10 Million Years of the Solar System – a Planetary Materials Approach. Numerical computations were, in part, carried out on PC cluster at Center for Computational Astrophysics, National Astronomical Observatory of Japan.
References
- Aikawa, Y., & Herbst, E. 1999, ApJ, 526, 314 [NASA ADS] [CrossRef] [MathSciNet] [Google Scholar]
- Aikawa, Y., Wakelam, V., Hersant, F., Garrod, R., & Herbst, E. 2012, ApJ, 760, 40 [NASA ADS] [CrossRef] [Google Scholar]
- Albertsson, T., Semenov, D., & Henning, T. 2014, ApJ, 784, 39 [NASA ADS] [CrossRef] [Google Scholar]
- Alexander, C. M. O. D’., Bowden, R., Fogel, M. L., et al. 2012, Science, 337, 721 [NASA ADS] [CrossRef] [PubMed] [Google Scholar]
- Altwegg, K., Balsiger, H., Bar-Nun, A., et al. 2015, Science, 347, 1261952 [Google Scholar]
- Andersson, S., & van Dishoeck, E. F. 2008, A&A, 491, 907 [NASA ADS] [CrossRef] [EDP Sciences] [Google Scholar]
- Arasa, C., Koning, J., Kroes, G.-J., Walsh, C., & van Dishoeck, E. F. 2015, A&A, 575, A121 [NASA ADS] [CrossRef] [EDP Sciences] [Google Scholar]
- Atahan, A., Alexander, M. H., & Rackham, J. 2005, J. Chem. Phys., 123, 204306 [NASA ADS] [CrossRef] [Google Scholar]
- Basu, S., & Mouschovias, T. C. 1994, ApJ, 432, 720 [NASA ADS] [CrossRef] [Google Scholar]
- Bergin, E. A., Hartmann, L. W., Raymond, J. C., & Ballesteros-Paredes, J. 2004, ApJ, 612, 921 [NASA ADS] [CrossRef] [Google Scholar]
- Bertin, M., Fayolle, E. C., Romanzin, C., et al. 2012, Phys. Chem. Chem. Phys., 14, 9929 [NASA ADS] [CrossRef] [Google Scholar]
- Boogert, A. C. A., Gerakines, P., & Whittet, D. C. B. 2015, ARA&A, 53, 541 [Google Scholar]
- Brogan, C. L., Pérez, L. M., et al. (ALMA Partnership) 2015, ApJ, 808, L3 [NASA ADS] [CrossRef] [Google Scholar]
- Bruderer, S., van Dishoeck, E. F., Doty, S. D., & Herczeg, G. J. 2012, A&A, 541, A91 [NASA ADS] [CrossRef] [EDP Sciences] [Google Scholar]
- Cassen, P., & Moosman, A. 1981, Icarus, 48, 353 [NASA ADS] [CrossRef] [Google Scholar]
- Caselli, P., Benson, P. J., Myers, P. C., & Tafalla, M. 2002, ApJ, 572, 238 [NASA ADS] [CrossRef] [Google Scholar]
- Cazaux, S., Caselli, P., & Spaans, M. 2011, ApJ, 741, L34 [NASA ADS] [CrossRef] [Google Scholar]
- Ceccarelli, C., Caselli, P., Bockelée-Morvan, D., et al. 2014, Protostars & Planets VI (Tucson: Univ. Arizona Press), 859 [Google Scholar]
- Cleeves, L. I., Adams, F., & Bergin, E. A. 2013, ApJ, 772, 5 [NASA ADS] [CrossRef] [Google Scholar]
- Cleeves, L. I., Bergin, E. A., Alexander, C. M. O., et al. 2014, Science, 345, 1590 [NASA ADS] [CrossRef] [Google Scholar]
- Cleeves, L. I., Bergin, E. A., Alexander, C. M. O., et al. 2016, ApJ, 819, 13 [NASA ADS] [CrossRef] [Google Scholar]
- Coutens, A., Vastel, C., Cabrit, S., et al. 2013, A&A, 560, A39 [NASA ADS] [CrossRef] [EDP Sciences] [Google Scholar]
- Coutens, A., Jørgensen, J. K., Persson, M., et al. 2014, ApJ, 792, L5 [NASA ADS] [CrossRef] [Google Scholar]
- Crovisier, J., Bockelée-Morvan, D., Colom, P., et al. 2004, A&A, 418, 1141 [NASA ADS] [CrossRef] [EDP Sciences] [Google Scholar]
- D’Alessio, P., Calvet, N., & Hartmann, L. 1997, ApJ, 474, 397 [NASA ADS] [CrossRef] [MathSciNet] [Google Scholar]
- Dalgarno, A. 2006, Proc. National Academy Science, 103, 12269 [NASA ADS] [CrossRef] [Google Scholar]
- Dartois, E., Thi, W. F., Geballe, T. R., et al. 2003, A&A, 399, 1020 [Google Scholar]
- Draine, B. T. 1978, ApJS, 36, 595 [NASA ADS] [CrossRef] [Google Scholar]
- Draine, B. T., & Bertoldi, F. 1996, ApJ, 468, 269 [NASA ADS] [CrossRef] [EDP Sciences] [Google Scholar]
- Drouart, A., Dubrulle, B., Gautier, D., & Robert, F. 1999, Icarus, 140, 129 [NASA ADS] [CrossRef] [Google Scholar]
- Drozdovskaya, M. N., Walsh, C., Visser, R., Harsono, D., & van Dishoeck, E. F. 2014, MNRAS, 445, 913 [NASA ADS] [CrossRef] [Google Scholar]
- Drozdovskaya, M. N., Walsh, C., van Dishoeck, E. F., et al. 2016, MNRAS, 462, 977 [NASA ADS] [CrossRef] [Google Scholar]
- Fayolle, E. C., Öberg, K. I., Cuppen, H. M., Visser, R., & Linnartz, H. 2011, A&A, 529, A74 [NASA ADS] [CrossRef] [EDP Sciences] [Google Scholar]
- Fayolle, E. C., Bertin, M., Romanzin, C., et al. 2013, A&A, 556, A122 [NASA ADS] [CrossRef] [EDP Sciences] [Google Scholar]
- Flaherty, K. M., Hughes, A. M., Rosenfeld, K. A., et al. 2015, ApJ, 813, 99 [NASA ADS] [CrossRef] [Google Scholar]
- Flower, D. R., Pineau Des Forêts, G., & Walmsley, C. M. 2006, A&A, 449, 621 [NASA ADS] [CrossRef] [EDP Sciences] [Google Scholar]
- Fraser, H. J., Collings, M. P., McCoustra, M. R. S., & Williams, D. A. 2001, MNRAS, 327, 1165 [NASA ADS] [CrossRef] [Google Scholar]
- Furuya, K., & Aikawa, Y. 2014, ApJ, 790, 97 [NASA ADS] [CrossRef] [Google Scholar]
- Furuya, K., Aikawa, Y., Nomura, H., Hersant, F., & Wakelam, V. 2013, ApJ, 779, 11 [NASA ADS] [CrossRef] [Google Scholar]
- Furuya, K., Aikawa, Y., Hincelin, U., et al. 2015, A&A, 584, A124 [NASA ADS] [CrossRef] [EDP Sciences] [Google Scholar]
- Furuya, K., Drozdovskaya, M. N., Walsh, C., & van Dishoeck, E. F. 2016a, EAS Pub. Ser., 75, 259 [Google Scholar]
- Furuya, K., van Dishoeck, E. F., & Aikawa, Y. 2016b, A&A, 586, A127 [NASA ADS] [CrossRef] [EDP Sciences] [Google Scholar]
- Garrod, R. T. 2008, A&A, 491, 239 [NASA ADS] [CrossRef] [EDP Sciences] [Google Scholar]
- Garrod, R. T. 2013, A&A, 765, A60 [Google Scholar]
- Garrod, R. T., & Herbst, E. 2006, A&A, 457, 927 [NASA ADS] [CrossRef] [EDP Sciences] [Google Scholar]
- Garrod, R. T., & Pauly, T. 2011, ApJ, 735, 15 [NASA ADS] [CrossRef] [Google Scholar]
- Geiss, J., & Reeves, H. 1981, A&A, 93, 189 [Google Scholar]
- Goodman, A. A., Benson, P. J., Fuller, G. A., & Myers, P. C. 1993, ApJ, 406, 528 [NASA ADS] [CrossRef] [Google Scholar]
- Gredel, R., Lepp, S., Dalgrano, A., & Herbst, E. 1989, ApJ, 347, 289 [NASA ADS] [CrossRef] [Google Scholar]
- Harada, N., Herbst, R., & Wakelam, V. 2010, ApJ, 721, 1570 [NASA ADS] [CrossRef] [Google Scholar]
- Harsono, D., Visser, R., Bruderer, S., van Dishoeck, E. F., & Kristensen, L. E. 2013, A&A, 555, A45 [NASA ADS] [CrossRef] [EDP Sciences] [Google Scholar]
- Harsono, D., Bruderer, S., & van Dishoeck, E. 2015, A&A, 582, A41 [NASA ADS] [CrossRef] [EDP Sciences] [Google Scholar]
- Hasegawa, T. I., & Herbst, E. 1993, MNRAS, 263, 589 [NASA ADS] [CrossRef] [Google Scholar]
- Hasegawa, T. I., Herbst, E., & Leung, C. M. 1992, ApJS, 82, 167 [NASA ADS] [CrossRef] [Google Scholar]
- Hassel, G. E., Herbst, E., & Bergin, E. A. 2010, A&A, 515, A66 [NASA ADS] [CrossRef] [EDP Sciences] [Google Scholar]
- Hincelin, U., Herbst, E., Chang, Q., et al. 2014, 69th Int. Symp. Mol. Spectr., 9 [Google Scholar]
- Hugo, E., Asvany, O., & Schlemmer, S. 2009, J. Chem. Phys., 130, 164302 [NASA ADS] [CrossRef] [PubMed] [Google Scholar]
- Ioppolo, S., Cuppen, H. M., Romanzin, C., van Dishoeck, E. F., & Linnartz, H. 2010, Phys. Chem. Chem. Phys., 12, 12065 [NASA ADS] [CrossRef] [Google Scholar]
- Lécluse, C., & Robert, F. 1994, Geochim. Cosmochim. Acta, 58, 2927 [NASA ADS] [CrossRef] [Google Scholar]
- Lynden-Bell, D., & Pringle, J. E. 1974, MNRAS, 168, 603 [NASA ADS] [CrossRef] [Google Scholar]
- Li, X., Heays, A. N., Visser, R., et al. 2013, A&A, 555, A14 [NASA ADS] [CrossRef] [EDP Sciences] [Google Scholar]
- Linsky, J. L. 2003, Space Sci. Rev., 106, 49 [NASA ADS] [CrossRef] [Google Scholar]
- Lunine, J. I., Engel, S., Rizk, B., & Horanyi, M. 1991, Icarus, 94, 333 [NASA ADS] [CrossRef] [Google Scholar]
- Mason, N. J., Dawes, A., Holtom, P. D., et al. 2006, Faraday Discuss., 133, 311 [NASA ADS] [CrossRef] [Google Scholar]
- Maury, A. J., Belloche, A., André, P., et al. 2014, A&A, 563, L2 [NASA ADS] [CrossRef] [EDP Sciences] [Google Scholar]
- Meier, R., Owen, T. C., Matthews, H. E., et al. 1998a, Science, 279, 842 [NASA ADS] [CrossRef] [PubMed] [Google Scholar]
- Meier, R., Owen, T. C., Jewitt, D. C., et al. 1998b, Science, 279, 1707 [NASA ADS] [CrossRef] [PubMed] [Google Scholar]
- Millar, T. J., Bennet, A., & Herbst, E. 1989, ApJ, 340, 906 [NASA ADS] [CrossRef] [Google Scholar]
- Mumma, M. J., & Charnley, S. B. 2011, ARA&A, 49, 471 [NASA ADS] [CrossRef] [Google Scholar]
- Öberg, K. I., Fayolle, E. C., Cuppen, H. M., van Dishoeck, E. F., & Linnartz, H. 2009, A&A, 505, 183 [NASA ADS] [CrossRef] [EDP Sciences] [Google Scholar]
- Öberg, K. I., Boogert, A. C. A., Pontoppidan, K. M., et al. 2011, ApJ, 740, 109 [NASA ADS] [CrossRef] [Google Scholar]
- Parise, B., Simon, T., Caux, E., et al. 2003, A&A, 410, 897 [NASA ADS] [CrossRef] [EDP Sciences] [Google Scholar]
- Parise, B., Ceccarelli, C., Tielens, A. G. G. M., et al. 2006, A&A, 453, 949 [NASA ADS] [CrossRef] [EDP Sciences] [Google Scholar]
- Persson, M. V., Jørgensen, J. K., & van Dishoeck, E. F. 2013, A&A, 549, L3 [NASA ADS] [CrossRef] [EDP Sciences] [Google Scholar]
- Persson, M. V., Jørgensen, J. K., van Dishoeck, E., & Harsono, D. 2014, ApJ, 563, 74 [Google Scholar]
- Pontoppidan, K. M. 2006, A&A, 453, L47 [NASA ADS] [CrossRef] [EDP Sciences] [Google Scholar]
- Richet, P., Bottinga, Y., & Javoy, M. 1977, Annu. Rev. Earth Planet. Sci., 5, 65 [Google Scholar]
- Robert, F. 2006, in Meteorites and the Early Solar System II, eds. D. S. Lauretta, & H. Y. McSween, Jr. (Tucson, AZ: Univ. Arizona Press), 341 [Google Scholar]
- Roberts, H., Herbst, E., & Millar, T. J. 2002, MNRAS, 336, 283 [NASA ADS] [CrossRef] [Google Scholar]
- Rodgers, S. D., & Charnley, S. B. 2002, Planet. Space Sci., 50, 1125 [NASA ADS] [CrossRef] [Google Scholar]
- Rodgers, S. D., & Charnley, S. B. 2008, MNRAS, 385, L48 [NASA ADS] [CrossRef] [Google Scholar]
- Sakai, N., Sakai, T., Hirota, T., et al. 2014, Nature, 507, 78 [NASA ADS] [CrossRef] [Google Scholar]
- Shakura, N. I., & Sunyaev, R. A. 1973, A&A, 24, 337 [NASA ADS] [Google Scholar]
- Shu, F. H. 1977, ApJ, 214, 488 [NASA ADS] [CrossRef] [Google Scholar]
- Shu, F. H., Adams, F. C., & Lizano, S. 1987, ARA&A, 25, 23 [Google Scholar]
- Taquet, V., Ceccarelli, C., & Kahane, C. 2012, ApJ, 748, L3 [NASA ADS] [CrossRef] [Google Scholar]
- Taquet, V., Charnley, S. B., & Sipilä, O. 2014, ApJ, 791, 1 [NASA ADS] [CrossRef] [Google Scholar]
- Taquet, V., López-Sepulcre, A., Ceccarelli, C., et al. 2015, ApJ, 804, 81 [NASA ADS] [CrossRef] [Google Scholar]
- Taquet, V., Furuya, K., Walsh, C., & van Dishoeck, E. F. 2016, MNRAS, 462, 99 [NASA ADS] [CrossRef] [Google Scholar]
- Tazaki, R., & Nomura, H. 2015, ApJ, 799, 119 [NASA ADS] [CrossRef] [Google Scholar]
- Terebey, S., Shu, F. H., & Cassen, P. 1984, ApJ, 286, 529 [NASA ADS] [CrossRef] [Google Scholar]
- Testi, L., Birnstiel, T., Ricci, L., et al. 2014, Protostars & Planets VI (Tucson: Univ. of Arizona Press), 339 [Google Scholar]
- Tielens, A. G. G. M. 1983, A&A, 119, 177 [NASA ADS] [Google Scholar]
- Umebayashi, T., & Nakano, T. 1981, PASJ, 33, 617 [NASA ADS] [Google Scholar]
- van Dishoeck, E. F., Bergin, E. A., Lis, D. C., & Lunine, J. I. 2014, Protostars & Planets VI (Tucson: Univ. Arizona Press), 835 [Google Scholar]
- van Dishoeck, E. F., & Blake, G. A. 1998, ARA&A, 36, 317 [NASA ADS] [CrossRef] [Google Scholar]
- Vasyunin, A. I., & Herbst, E. 2013, ApJ, 762, 86 [NASA ADS] [CrossRef] [Google Scholar]
- Vasyunin, A. I., Semenov, D. A., Wiebe, D. S., & Henning, T. 2009, ApJ, 691, 1459 [NASA ADS] [CrossRef] [Google Scholar]
- Villanueva, G. L., Mumma, M. J., Bonev, B. P., et al. 2009, ApJ, 690, L5 [NASA ADS] [CrossRef] [Google Scholar]
- Visser, R., & Dullemond, C. P. 2010, A&A, 519, A28 [NASA ADS] [CrossRef] [EDP Sciences] [Google Scholar]
- Visser, R., van Dishoeck, E. F., & Black, J. H. 2009a, A&A, 503, 323 [NASA ADS] [CrossRef] [EDP Sciences] [Google Scholar]
- Visser, R., van Dishoeck, E. F., Doty, S. D., & Dullemond, C. P. 2009b, A&A, 495, 881 [NASA ADS] [CrossRef] [EDP Sciences] [Google Scholar]
- Visser, R., Doty, S. D., & van Dishoeck, E. F. 2011, A&A, 534, A132 [NASA ADS] [CrossRef] [EDP Sciences] [Google Scholar]
- Vinković, D. 2009, Nature, 459, 227 [NASA ADS] [CrossRef] [Google Scholar]
- Watanabe, N., & Kouchi, A. 2002, ApJ, 571, L173 [NASA ADS] [CrossRef] [Google Scholar]
- Watanabe, N., & Kouchi, A. 2008, Prog. Surf. Sci., 83, 439 [NASA ADS] [CrossRef] [Google Scholar]
- Watanabe, N., Mouri, O., Nagaoka, A., Kouchi, A., & Pirronello, V. 2007, ApJ, 668, 1001 [NASA ADS] [CrossRef] [Google Scholar]
- Watson, W. D. 1976, Rev. Mod. Phys., 48, 513 [NASA ADS] [CrossRef] [Google Scholar]
- Whittet, D. C. B. 1993, Dust and Chemistry in Astronomy (Bristol and Philadelphia: Institute of Physics Publishing), 9 [Google Scholar]
- Willacy, K., & Woods, P. M. 2009, ApJ, 703, 479 [NASA ADS] [CrossRef] [Google Scholar]
- Wolcott-Green, J., & Haiman, Z. 2011, MNRAS, 412, 2603 [NASA ADS] [CrossRef] [Google Scholar]
- Yang, L., Ciesla, F. J., & Alexander, C. M. O. 2013, Icarus, 226, 256 [NASA ADS] [CrossRef] [Google Scholar]
- Yen, H.-W., Takakuwa, S., Koch, P. M., et al. 2015, ApJ, 812, 129 [NASA ADS] [CrossRef] [Google Scholar]
- Yen, H.-W., Liu, H. B., Gu, P.-G., et al. 2016, ApJ, 820, L25 [NASA ADS] [CrossRef] [Google Scholar]
- Zolensky, M. E., Zega, T. J., Yano, H., et al. 2006, Science, 314, 1735 [NASA ADS] [CrossRef] [PubMed] [Google Scholar]
Appendix A: (2+n)-phase gas-ice astrochemical model
In order to simulate molecular evolution in the dense ISM appropriately, one must consider, at least, two phases of chemical species, gas and ice (the so-called two-phase model; Hasegawa et al. 1992). In the original two-phase model, the whole ice mantle is assumed to be chemically active, while laboratory experiments have shown that two-body association reactions to form icy molecules preferentially occur in the surface layers rather than the whole ice mantle at low temperatures (e.g., Watanabe et al. 2007; Ioppolo et al. 2010). Hasegawa & Herbst (1993) proposed the so-called three-phase model, in which three phases, gas, icy surface, and the bulk ice, are considered to account for the different chemical activity. The basic assumption of the three-phase model is that the bulk ice mantle has uniform chemical composition, while ice composition in the ISM is most likely inhomogenous. To take a depth-dependent ice structure into account, we introduce a (2+n)-phase model, where n ≥ 2, as a natural extension of the three-phase, i.e., (2+1)-phase, model.
We start from describing the three-phase model originally proposed by Hasegawa & Herbst (1993). The three-phase model consists of three sets of ordinary differential equations (ODEs) as follows: 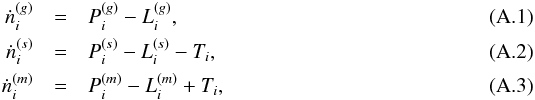 where
where  , , and
  are the number densities of species i per unit gas volume in the gas phase, on the surface of the icy dust grain, and in the ice mantle, respectively. The dots represent the derivatives with respect to time. Pi and Li are the production and loss rates of species i by chemical processes, respectively. In the three-phase model, molecules on the surface layers become part of the ice mantle with the growth of ice, while part of the ice mantle become the surface layers with the loss of ice. We denoted the surface-mantle transition rate of species i as Ti. The total rate of the surface-mantle transition, ∑ iTi, should satisfy 0 ≤ | ∑ iTi | ≤ | R(s) |, where
 ![Mathematical equation: \hbox{$R^{(s)} = \sum_{i}[\req{P}{i}{s} - \req{L}{i}{s}]$}](/articles/aa/full_html/2017/03/aa29269-16/aa29269-16-eq170.png) . R(s) ≥ 0 and R(s)< 0 correspond to the net growth and net loss of ice, respectively. One may write
. R(s) ≥ 0 and R(s)< 0 correspond to the net growth and net loss of ice, respectively. One may write  (A.4)where 0 ≤ fgrow ≤ 1 and 0 ≤ floss ≤ 1. We denote
  as n(x). It is often assumed that chemical processes only occur in the uppermost monolayer. In this case fgrow is given as the coverage of a surface, i.e., n(s)/ (Nsitengr), where Nsite is the number of binding sites per monolayer and ngr is the number density of dust grains per unit gas volume (Hasegawa & Herbst 1993). n(s)/ngr represents the average number of icy molecules on the surface of a dust grain. On the other hand, we consider the uppermost Nactlay layers to be chemically active (Nactlay = 4 MLs in this paper), and fgrow is given by [n(s)/ (Nsitengr)−(Nactlay−1)] with the lower limit of zero. Then the surface-mantle transition occurs after the formation of (Nactlay−1) monolayers of ice in our model. floss is n(m)/min(n(s),Nsitengr) with the upper limit of unity (Garrod & Pauly 2011). To determine each Ti, it is assumed that the rate is proportional to the fractional composition:
  (A.5)In Eq. (A.3) we did not consider diffusion between the surface and bulk ice mantle, which would be important for the segregation of CO2 ice as suggested from the ice observations in protostellar envelopes, although the mechanism and efficiency in the ISM ice remain uncertain (Öberg et al. 2009; Fayolle et al. 2011).
The basic assumption of the three-phase model is that the bulk ice mantle has uniform chemical composition. We divide the bulk ice mantle into distinct n phases, where n ≥ 2, to take a depth-dependent ice structure into account. One may refer to the model as a (2+n)-phase model analogously to the (2+1)-phase (three-phase) model. The (2+n)-phase model consists of 2+n sets of ODEs as follows: 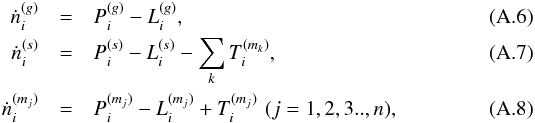 where
where  is the number density of species i per unit gas volume in the jth mantle phase (mj). We refer to the lowermost mantle phase as the 1st mantle (m1) and the uppermost mantle phase as the nth mantle (mn). Each mantle phase consists of
  ice monolayers at a maximum. It is assumed that when the net growth of ice occurs, the mantle phases are filled in order of m1 → m2 → ... → mn, while when the net loss occurs, the mantle phases are emptied in reverse. The surface-mantle transition rate of species i in the jth mantle is given as follows:
  (A.9)where floss was redefined by ∑ jn(mj)/min(n(s),Nsitengr) with the upper limit of unity. We introduced additional factors,
  and
and  , which describe “activity” of the jth mantle for the surface-mantle transition, and satisfy
  ,
,  , and
, and  . Then,
  is identical to ∑ iTi in the three-phase model; if one is only interested in the formation of ice and assumes that bulk ice mantle is chemically inert, the three-phase model and the (2+n)-phase model with arbitrary n give identical whole ice compositions. The functional forms of and are given as follows:
 ![Mathematical equation: \appendix \setcounter{section}{1} \begin{eqnarray} \alpha^{(m_j)}_{\rm grow} &=& 1 - {\rm min}\left[1, \,\, \left(N^{(m_{j-1})}_{\rm maxlay} - \sumreq{n}{m_{j-1}}/(N_{\rm site}n_{\rm gr})\right)\right], \\ \alpha^{(m_j)}_{\rm loss} &=& 1 - {\rm min}\left[1, \,\, \sum_{k}^{k > j}\sumreq{n}{m_k}/(N_{\rm site}n_{\rm gr})\right]. \end{eqnarray}](/articles/aa/full_html/2017/03/aa29269-16/aa29269-16-eq205.png) Finally, there is a way to treat ice structure in layer-by-layer manner even within the framework of the two-phase model by keeping track of each layer as it forms (Taquet et al. 2012). However, it was found that the method is computationally expensive when simulating ice sublimation (Taquet et al. 2014), losing the major advantage of the rate equation method over more detailed methods such as the macroscopic Monte Carlo approach (Vasyunin & Herbst 2013). As has been demonstrated in this work, our (2+n)-phase model can be used with a complicated chemical network and a time-dependent physical model, which covers wide ranges of physical conditions, although the resolution of the depth-dependent ice structure in our model is limited. In principle, it is possible to treat each monolayer as a distinct phase in the (2+n)-phase model by setting to
Finally, there is a way to treat ice structure in layer-by-layer manner even within the framework of the two-phase model by keeping track of each layer as it forms (Taquet et al. 2012). However, it was found that the method is computationally expensive when simulating ice sublimation (Taquet et al. 2014), losing the major advantage of the rate equation method over more detailed methods such as the macroscopic Monte Carlo approach (Vasyunin & Herbst 2013). As has been demonstrated in this work, our (2+n)-phase model can be used with a complicated chemical network and a time-dependent physical model, which covers wide ranges of physical conditions, although the resolution of the depth-dependent ice structure in our model is limited. In principle, it is possible to treat each monolayer as a distinct phase in the (2+n)-phase model by setting to  . It requires, however, significant computational effort because of the increasing number of ODEs to be solved. Another advantage of our (2+n)-phase model is that it allows us to consider chemical processes in the distinct mantle phases as carried out in Sect. 5.1, which is beyond the framework of the two- and three-phase models.
Appendix B: Additional figures from the model with a lower solid-body rotation rate of the core
Here we present additional figures from the model with a solid-body rotation rate of the core of Ω = 10-14 s-1 (Sect. 5.2). Figure B.1 shows the physical structure at selected times in the model with the lower rotation rate. Compared to the fiducial model, the envelope materials close to the cavity walls are denser at a given time. As a result, stellar UV photons are shielded more efficiently and the UV radiation field is weaker in the envelope. It is also seen that the outer disk radius is smaller than that in the fiducial model. Figure B.2 shows the distributions of H2O ice abundance (left) and the HDO/H2O ice ratio (right) at t = 0.3tacc–0.9tacc on a 1000 au scale, while Fig. B.3 shows the zoom-in views on disk scales. Figure B.4 shows water ice abundances and the abundance ratios as functions of the normalized UV fluence defined by Eq. (4). Compared with the fiducial model, the UV fluence is significantly lower for the majority of the fluid parcels, and thus the water ice abundances tend to remain uniform.
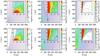 |
Fig. B.1 Spatial distributions of the gas density (left), dust temperature (middle), and stellar UV radiation field at t = 0.5tacc (top) and 0.9tacc (bottom) in the model with low core rotation rate (Ω = 10-14 s-1). Other details are the same as Fig. 1. |
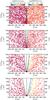 |
Fig. B.2 Spatial distributions of fluid parcels on a 1000 au scale at 0.3tacc, 0.5tacc, 0.7tacc, and 0.9tacc (from top to bottom) in the model with a low core rotation rate (Ω = 10-14 s-1). Left: H2O ice abundance with a logarithmic scale. Right: icy HDO/H2O ratio with a logarithmic scale. The black solid lines at each panel depict the disk surface and outflow cavity wall. See Fig. B.3 for the zoom-in view. |
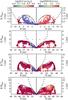 |
Fig. B.3 Zoom-in view of Fig. B.2. We note the different spatial scale among the panels. Water snow lines are depicted by dashed lines. The outflow cavity walls are not shown in this figure. |
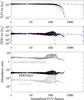 |
Fig. B.4 H2O ice (top) and HDO ice (middle) abundances in the fluid parcels that are located in the disk at t = tacc as functions of the normalized UV fluence in the model with a low core rotation rate (Ω = 10-14 s-1). The bottom panel shows HDO/H2O ice ratio (black), D2O/H2O ice ratio (light gray), and the ratio of D2O/HDO to HDO/H2O ice ratio (gray). Only the fluid parcels in which the H2O ice abundance is larger than 10-5 are plotted. The blue and red dashed lines depict the expected H2O (or HDO) ice abundance when only photodesorption is an allowed chemical process and when only photodissociation/photodesorption are included, respectively. |
Appendix C: The ratio of D2O/HDO to HDO/D2O in a Class II turbulent disk chemical model
Figure C.1 shows the vertically averaged H2O ice abundance (top), the HDO/H2O ice column density ratio (middle), and the ice column density ratio of D2O/HDO to HDO/H2O (the bottom) in a disk model around a typical T Tauri star after 1 Myr chemical evolution. The data are taken from an updated version of the Furuya et al. (2013) model that is presented in Furuya & Aikawa (2014). The alpha parameter for the vertical diffusion coefficient, which decides the efficiency of vertical mixing of materials, is set to 10-2. We note that deuterium and ice chemistry in the turbulent disk model are limited (e.g., neither spin state chemistry nor ice layered structure are considered).At radii 20–24 au, H2O ice is abundant (~10-4 [nH]) and the cometary HDO/H2O ice ratios ((3–11) × 10-4; Mumma & Charnley 2011, and references therein) are reproduced. In this region, the ratio of D2O/HDO to HDO/H2O ranges from ~2 to ~0.1. The significant enhancement of the ratio of D2O/HDO to HDO/H2O at radii ≲20 au is caused by the production of D2O in the gas phase followed by freeze-out, rather than by the icy grain surface chemistry. In such regions, the H2O ice abundance is low, since the warm dust temperatures reduce the reformation rate of H2O ice (Furuya et al. 2013).
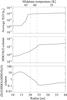 |
Fig. C.1 Vertically averaged H2O ice abundance (top), HDO/H2O ice column density ratio (middle), and the ice column density ratio of D2O/HDO to HDO/H2O (bottom) in a disk model around a typical T Tauri star after 1 Myr evolution. The data are taken from Furuya et al. (2013) and Furuya & Aikawa (2014). In regions between the dashed vertical lines, H2O ice is abundant (~10-4) and the cometary HDO/H2O ice ratio is reproduced. The top label represents the temperature in the disk midplane. |
All Tables
All Figures
|
Fig. 1 Spatial distributions of the gas density (left), dust temperature (middle), and stellar FUV radiation field normalized by cosmic ray-induced radiation field (104 photons cm-2 s-1; right) at t = 0.5tacc (top) and 0.9tacc (bottom) in our fiducial model. In the middle panel, contours are drawn at 100 K, 50 K, 30 K, and 20 K. Insets zoom in on the disk. The disk surface is shown with the gray solid line. |
| In the text | |
|
Fig. 2 Initial layered ice structure at the onset of collapse. The ice consists of 86 MLs in total. The ice surface (top 4 MLs) and five distinct mantle phases have different chemical compositions. |
| In the text | |
|
Fig. 3 Spatial distributions of fluid parcels on a 1000 au scale at t = 0.3tacc, 0.5tacc, 0.7tacc, and 0.9tacc (from top to bottom) in our fiducial model. Left: H2O ice abundance with a logarithmic scale. Right: ice HDO/H2O ratio with a logarithmic scale. The black solid lines at each panel depict the disk surface and outflow cavity wall. See Fig. 4 for the zoom-in view on the disk. |
| In the text | |
|
Fig. 4 Zoom-in view of Fig. 3 on the disk scale. We note the different spatial scales among the panels. Water snow lines, where the rate of adsorption onto dust grains and that of thermal desorption are balanced, are depicted by dashed lines. The outflow cavity walls are not shown in this figure. |
| In the text | |
|
Fig. 5 Vertically averaged H2O ice abundance (top), HDO/H2O ice column density ratio (middle), and ice column density ratio of D2O/HDO to HDO/H2O (bottom) in the forming disk as a function of radius at selected times in our fiducial model, represented by different colors (solid lines). Arrows on the right-hand margin indicate the values at the onset of collapse. The disk outer radius increases with time. The black dashed lines represent the prediction assuming in situ formation of water ice in the disk structure given at t = tacc. |
| In the text | |
|
Fig. 6 Bulk disk-averaged H2O ice abundance (black) and HDO/H2O ice ratio (blue) as functions of time in the fiducial model. The horizontal dashed lines indicate their values at the onset of collapse. |
| In the text | |
|
Fig. 7 H2O ice (top) and HDO ice (middle) abundances in the fluid parcels that are located in the disk at t = tacc as functions of the normalized UV fluence. The bottom panel shows HDO/H2O ice ratio (black), D2O/H2O ice ratio (light gray), and the ratio of D2O/HDO to HDO/H2O ice ratio (gray). Only the fluid parcels in which the H2O ice abundance is larger than 10-5 are plotted. The blue and red dashed lines depict the expected H2O (or HDO) ice abundance when only photodesorption is an allowed chemical process and when only photodissociation and photodesorption are included, respectively. See the main text for more details. |
| In the text | |
|
Fig. 8 Similar to Fig. 7, but for the model with the bulk ice chemistry (shown by square). Gray crosses show the results from our fiducial model for comparisons. |
| In the text | |
|
Fig. 9 Similar to Fig. 5, but for the model with Ω = 10-14 s-1. The results at t = 0.3tacc are not shown, because most of the disk has higher temperature than the water ice sublimation at the time. |
| In the text | |
|
Fig. 10 Molecular abundances and D/H ratios in the disk at t = 0.5tacc (solid lines) and t = tacc (dashed lines) as functions of radius in our fiducial model. Top: vertically averaged abundances of H2CO ice, CH3OH ice, and the sum of icy organics with respect to H2O ice. Bottom: the D/H column density ratios of formaldehyde ice, methanol ice, icy organics, and water ice. Arrows on the right-hand margin indicate the values at the onset of collapse. |
| In the text | |
|
Fig. B.1 Spatial distributions of the gas density (left), dust temperature (middle), and stellar UV radiation field at t = 0.5tacc (top) and 0.9tacc (bottom) in the model with low core rotation rate (Ω = 10-14 s-1). Other details are the same as Fig. 1. |
| In the text | |
|
Fig. B.2 Spatial distributions of fluid parcels on a 1000 au scale at 0.3tacc, 0.5tacc, 0.7tacc, and 0.9tacc (from top to bottom) in the model with a low core rotation rate (Ω = 10-14 s-1). Left: H2O ice abundance with a logarithmic scale. Right: icy HDO/H2O ratio with a logarithmic scale. The black solid lines at each panel depict the disk surface and outflow cavity wall. See Fig. B.3 for the zoom-in view. |
| In the text | |
|
Fig. B.3 Zoom-in view of Fig. B.2. We note the different spatial scale among the panels. Water snow lines are depicted by dashed lines. The outflow cavity walls are not shown in this figure. |
| In the text | |
|
Fig. B.4 H2O ice (top) and HDO ice (middle) abundances in the fluid parcels that are located in the disk at t = tacc as functions of the normalized UV fluence in the model with a low core rotation rate (Ω = 10-14 s-1). The bottom panel shows HDO/H2O ice ratio (black), D2O/H2O ice ratio (light gray), and the ratio of D2O/HDO to HDO/H2O ice ratio (gray). Only the fluid parcels in which the H2O ice abundance is larger than 10-5 are plotted. The blue and red dashed lines depict the expected H2O (or HDO) ice abundance when only photodesorption is an allowed chemical process and when only photodissociation/photodesorption are included, respectively. |
| In the text | |
|
Fig. C.1 Vertically averaged H2O ice abundance (top), HDO/H2O ice column density ratio (middle), and the ice column density ratio of D2O/HDO to HDO/H2O (bottom) in a disk model around a typical T Tauri star after 1 Myr evolution. The data are taken from Furuya et al. (2013) and Furuya & Aikawa (2014). In regions between the dashed vertical lines, H2O ice is abundant (~10-4) and the cometary HDO/H2O ice ratio is reproduced. The top label represents the temperature in the disk midplane. |
| In the text | |
Current usage metrics show cumulative count of Article Views (full-text article views including HTML views, PDF and ePub downloads, according to the available data) and Abstracts Views on Vision4Press platform.
Data correspond to usage on the plateform after 2015. The current usage metrics is available 48-96 hours after online publication and is updated daily on week days.
Initial download of the metrics may take a while.