| Issue |
A&A
Volume 599, March 2017
|
|
|---|---|---|
| Article Number | A103 | |
| Number of page(s) | 25 | |
| Section | Planets and planetary systems | |
| DOI | https://doi.org/10.1051/0004-6361/201629134 | |
| Published online | 09 March 2017 | |
Hayabusa-2 mission target asteroid 162173 Ryugu (1999 JU3): Searching for the object’s spin-axis orientation⋆
1 Max-Planck-Institut für extraterrestrische Physik, Giessenbachstraße, Postfach 1312, 85741 Garching, Germany
e-mail: This email address is being protected from spambots. You need JavaScript enabled to view it.
2 Astronomical Institute, Faculty of Mathematics and Physics, Charles University, V Holešovičkách 2, 180 00 Praha 8, Czech Republic
3 Department of Physics and Astronomy, Seoul National University, Gwanak, 151-742 Seoul, Korea
4 Kapteyn Astronomical Institute, Rijksuniversiteit Groningen, Postbus 800, 9700 AV Groningen, The Netherlands
5 Korea Astronomy and Space Science Institute, 776 Daedeokdae-ro, Yuseong-gu, 305-348 Daejeon, Korea
6 European Space Astronomy Centre (ESAC), European Space Agency, 28691 Villanueva de la Cañada, Madrid, Spain
7 Center for Planetary Science, Graduate School of Science, Kobe University, 7-1-48, Minatojima-Minamimachi, Chuo-Ku, 650-0047 Kobe, Japan
8 Konkoly Observatory, Research Center for Astronomy and Earth Sciences, Hungarian Academy of Sciences ; Konkoly Thege 15-17, 1121 Budapest, Hungary
9 IMCCE, Observatoire de Paris, UPMC Paris-06, Université Lille1, UMR 8028 CNRS, 77 Av. Denfert Rochereau, 75014 Paris, France
10 Laboratoire Lagrange, UNS-CNRS, Observatoire de la Côte d’Azur, Boulevard de l’Observatoire-CS 34229, 06304 Nice Cedex 4, France
11 Earth and Planetary Science Department & Planetary Geosciences Institute, University of Tennessee, Knoxville, TN 37996, USA
12 Institute of Space and Astronautical Science, Japan Aerospace Exploration Agency, 3-1-1 Yoshinodai, Sagamihara, 229-8510 Kanagawa, Japan
13 Harvard-Smithsonian Center for Astrophysics, 60 Garden Street, MS 65, Cambridge, MA 02138-1516, USA
14 Okayama Astrophysical Observatory, National Astronomical Observatory of Japan, Honjo 3037-5, Kamogata, Asakuchi, 719-0232 Okayama, Japan
15 Carnegie Observatories, Las Campanas Observatory, Casilla 60, La Serena, Chile
16 Johns Hopkins University Applied Physics Laboratory, 11101 Johns Hopkins Rd., Laurel, MD 20723, USA
17 Northern Arizona University, Department of Physics and Astronomy, Bldg. 19, Rm. 209, Flagstaff, AZ 86011, USA
18 Bisei Spaceguard Center, Japan Spaceguard Association, 1716-3 Okura, Bisei-cho, Ibara, 714-1411 Okayama, Japan
19 Max-Planck-Institut für Sonnensystemforschung, Justus-von-Liebig-Weg 3, 37077 Göttingen, Germany
20 Planetary Science Institute, 1700 East Fort Lowell, Suite 106, Tucson, AZ 85719, USA
21 Astronomisches Rechen-Institut, Zentrum für Astronomie der Universität Heidelberg, Mönchhofstr. 12-14, 69120 Heidelberg, Germany
Received: 17 June 2016
Accepted: 25 October 2016
Abstract
The JAXA Hayabusa-2 mission was approved in 2010 and launched on December 3, 2014. The spacecraft will arrive at the near-Earth asteroid 162173 Ryugu (1999 JU3) in 2018 where it will perform a survey, land and obtainsurface material, then depart in December 2019 and return to Earth in December 2020. We observed Ryugu with the Herschel Space Observatory in April 2012 at far-infrared thermal wavelengths, supported by several ground-based observations to obtain optical lightcurves. We reanalysed previously published Subaru-COMICS and AKARI-IRC observations and merged them with a Spitzer-IRS data set. In addition, we used a large set of Spitzer-IRAC observations obtained in the period January to May, 2013. The data set includes two complete rotational lightcurves and a series of ten “point-and-shoot” observations, all at 3.6 and 4.5 μm. The almost spherical shape of the target together with the insufficient lightcurve quality forced us to combine radiometric and lightcurve inversion techniques in different ways to find the object’s spin-axis orientation, its shape and to improve the quality of the key physical and thermal parameters. Handling thermal data in inversion techniques remains challenging: thermal inertia, roughness or local structures influence the temperature distribution on the surface. The constraints for size, spin or thermal properties therefore heavily depend on the wavelengths of the observations. We find that the solution which best matches our data sets leads to this C class asteroid having a retrograde rotation with a spin-axis orientation of (λ = 310°−340°; β = −40° ± ~ 15°) in ecliptic coordinates, an effective diameter (of an equal-volume sphere) of 850 to 880 m, a geometric albedo of 0.044 to 0.050 and a thermal inertia in the range 150 to 300 J m-2 s-0.5 K-1. Based on estimated thermal conductivities of the top-layer surface in the range 0.1 to 0.6 W K-1 m-1, we calculated that the grain sizes are approximately equal to between 1 and 10 mm. The finely constrained values for this asteroid serve as a “design reference model”, which is currently used for various planning, operational and modelling purposes by the Hayabusa-2 team.
Key words: minor planets, asteroids: individual: 162173 Ryugu (1999 JU3) / radiation mechanisms: thermal / techniques: photometric / infrared: planetary systems
This work includes space data from (i) Herschel, an ESA space observatory with science instruments provided by European-led Principal Investigator consortia and with important participation from NASA; (ii) Spitzer Space Telescope, which is operated by the Jet Propulsion Laboratory, California Institute of Technology under a contract with NASA; (iii) AKARI, a JAXA project with the participation of ESA.
© ESO, 2017
1. Introduction
Remote observations and in-situ measurements of asteroids are considered highly complementary in nature: remote sensing shows the global picture, but transforming measured fluxes into physical quantities frequently depends upon model assumptions to describe surface properties. In-situ techniques measure physical quantities, such as size, shape, rotational properties, geometric albedo or surface details, in a more direct way. However, in-situ techniques are often limited in spatial/rotational/aspect coverage (flybys) and wavelength coverage (mainly visual and near-IR wavelengths). Mission targets are therefore important objects for a comparison of properties derived from disk-integrated measurements taken before arrival at the asteroid with those produced as output of the in-situ measurements. The associated benefits are obvious: (i) the model techniques and output accuracies for remote, disk-integrated observations can be validated (e.g., Müller et al. 2014 for the Hayabusa mission target 25143 Itokawa or O’Rourke et al. 2012 for the Rosetta flyby target 21 Lutetia); (ii) the model techniques can then be applied to many similar objects which are not included in interplanetary mission studies, but easily accessible by remote observations. The pre-mission observations are also important for determining the object’s thermal and physical conditions in support for the construction of the spacecraft and its instruments, and to prepare flyby, orbiting and landing scenarios.
The JAXA Hayabusa-2 mission, approved in 2010, was successfully launched on Dec. 3, 2014. It is expected to arrive at the asteroid 162173 Ryugu in 2018, survey the asteroid for a year and a half, then land and obtain surface material, and finally depart in December 2019, returning to Earth in December 2020.
Summary of previously published thermal and physical properties of 162173 Ryugu.
For various Hayabusa-2 planning, operational and modelling activities, it is crucial to know at least the basic characteristics of the mission target asteroid. Previous publications (Table 1) presented shape solutions close to a sphere and a rotation period of approximately 7.63 h, but a range of possible solutions for Ryugu’s spin properties which were then tested against visual lightcurves and various sets of thermal data, using different thermal models and assumptions for Ryugu’s surface properties:
-
Hasegawa et al. (2008) assumed anequator-on observing geometry (prograde rotation) for theirradiometric analysis and fitted a small set of thermalmeasurements (AKARI, Subaru).
-
Abe et al. (2008) found (λ, β)ecl = (331.0°, +20°) and (327.3°, +34.7°), indicating a prograde rotation. The solutions were based on applying two different methods (epoch and amplitude methods) to the available set of visual lightcurves.
-
Campins et al. (2009) were using the Abe et al. (2008) spin-axis solution, but also tested an extreme case of an equatorial retrograde geometry (λ, β)ecl = (80°, –80°) against a single-epoch Spitzer-IRS spectrum.
-
Müller et al. (2011) derived three possible solutions for the spin-axis orientation based on a subset of the currently existing data, but assuming a very high (and probably unrealistic) surface roughness: (λ, β)ecl = (73°, –62°), (69.6°, –56.7°), and (77.1°, –30.9°).
-
Yu et al. (2014) reconstructed a shape model (from low-quality MPC photometric points) under the assumption of a rotation axis orientation with (73°, -62°)ecl and re-interpreted previously published thermal measurements.
The radiometric studies have been performed using ground and space-based observations (Table 1 and references therein). Disk-integrated thermal observations from ground (Subaru) and space (AKARI, Spitzer) were combined with studies on reflected light (light curves, phase curves and colours). Most studies agree on the object’s effective diameter of ≈900 m, a geometric V-band albedo of 6−8%, an almost spherical shape (related to its low lightcurve amplitude) with a siderial rotation period of approximately 7.63 h and a thermal inertia in the range 150−1000 J m-2 s-0.5 K-1. A low-resolution near-IR spectrum (Pinilla-Alonso et al. 2013) confirmed the primitive nature of the C-type object Ryugu. Two independent studies on the rotational characterisation of the Hayabusa-2 target asteroid (Lazzaro et al. 2013; Moskovitz et al. 2013) found featureless spectra with very little variation, indicating a nearly homogeneous surface. However, one key element necessary for detailed mission planning and a final radiometric analysis was still not settled: the object’s spin-axis orientation.
The shape and spin properties of an asteroid are typically derived from inversion techniques (Kaasalainen & Torppa 2001; Kaasalainen et al. 2001) on the basis of multi-aspect light curve observations. This procedure was previously applied to 162173 Ryugu and the results were presented by Müller et al. (2011). We repeated the analysis this time using the large, recently obtained set of visual lightcurves. The full data set of lightcurves includes measurements taken between July 2007 and July 2012, covering a wide range of phase and aspect angles. But the very shallow light curve amplitudes and the insufficient quality of many observations did not allow us to derive a unique solution for the object’s spin-axis orientation. Wide ranges of pro- and retrograde orientations combined with different shape models are compatible (in the least-square sense) with the combined data set of all available lightcurves.
This forced us to combine lightcurve inversion techniques with radiometric methods in a new way to find the object’s spin-axis orientation, its shape and to improve the quality of the key physical and thermal parameters of 162173 Ryugu.
In Sect. 2 we present new thermal observations obtained by Herschel-PACS, re-analysed and re-calibrated AKARI-IRC and ground-based Subaru observations and Spitzer-IRAC observations at 3.6 and 4.5 μm. Ground-based, multi-band visual observations are described in Sect. 3. In Sect. 4 we describe our new approach to solve for the object’s properties. First, we present the search for the object’s spin-axis orientation using only the thermal measurements in combination with a spherical shape model (Sect. 4.1). In a more sophisticated second step (Sect. 4.2) we use all thermal and visual-wavelength photometric data together and allow for more complex object shapes in our search for the spin axis. In Sect. 5 we use the best shape and spin-axis information to derive additional physical and thermal properties, and then discuss the results. We conclude in Sect. 6 by presenting the derived object properties and discuss our experience in combining lightcurve inversion and radiometric techniques, which is applicable to other targets and will help in defining better observing strategies.
2. Thermal observations of 162173 Ryugu
2.1. Herschel PACS observations
The European Space Agency’s (ESA) Herschel Space Observatory (Pilbratt et al. 2010) performed observations from the 2nd Lagrangian point (L2) at 1.5 × 10⁶ km from Earth during the operational phase from 2009 to 2013. It has three science instruments on board covering the far-infrared part of the spectrum not accessible from the ground. The Photodetector Array Camera and Spectrometer (PACS; Poglitsch et al. 2010) was used to observe 162173 Ryugu as part of the “Measurements of 11 Asteroids & Comets” program (MACH-11, O’Rourke et al. 2014). PACS observed the asteroid in early April of 2012 for approximately 1.3 h, split into two separate measurements and taken in solar-system-object tracking mode. The target at this time moved at a Herschel-centric apparent speed of 34′′/h, corresponding to 19.3′′ movement between the mid-times of both observations. The observations were performed in the 70/160 μm filter combination to get the best possible S/N in both bands. We selected seven repetitions in each of the two scan directions for a better characterisation of the background and therefore a more accurate object flux.
Herschel PACS observations of 162173 Ryugu as part of the GT1_lorourke programme executed on operational day OD 1057 under the observation identifier OBSID 1342243716 & 1342243717.
AKARI-IRC observations of 162173 Ryugu: the colour-corrected flux densities FD at reference wavelengths λc, together with the observational error (σ) and the absolute flux error (σabs).
The PACS measurements were reduced and calibrated in a standard way as part of the Herschel data pipeline processing. Further processing was then performed as follows. We produced single repetition images from both scan direction measurements: scanA1...scanA7, scanB1...scanB7, not correcting for the apparent motion of the target (it is slow enough that the movement is not visible in a single 282s repetition). We then subtracted from each scanA_n image the respective, single repetition scanB_n image: diff_1 = scanA1-scanB1,...diff_7=scanA7-scanB7, producing differential (“diff”) images.
At this point, we co-added the diff images in such a way that each diff image was shifted by the corresponding apparent motion, relative to the first diff image. We produced the double-differential image and then performed the photometry and determined the noise using the implanted source method (Kiss et al. 2014 and references therein) on the final image. It was not feasible to extract the data from the red (160 μm) image due to the strongly enhanced cirrus background at that wavelength. The final 160 μm differential image had an estimated confusion noise level of approximately 7 mJy, more than a factor of two higher than the expected source flux.
The final derived flux was aperture and colour corrected to obtain monochromatic flux densities at the PACS reference wavelengths. The colour correction value for 162173 Ryugu of 1.005 in the blue band (70 μm) is based on a thermophysical model spectral energy distribution (SED), corresponding to an approximately 250 K black-body curve (Poglitsch et al. 2010).
The flux calibration was verified by a set of five high-quality fiducial stars (βAnd, αCet, αTau, αBoo and γDra), which have been observed multiple times in the same PACS observing mode as our observations (Balog et al. 2014) and which led to an absolute flux accuracy of 5% for standard PACS photometer observations. Table 2 provides the Herschel observation data set, accompanying information and results.
2.2. Re-analysis of AKARI-IRC observations
The AKARI observations were included in work by Hasegawa et al. (2008) and also used by Müller et al. (2011) and amount to a single-epoch data set from the IRC instrument with measurements at 15 and 24 μm. These measurements were reanalysed with the 2015 release of the imaging data reduction toolkit1 (Egusa et al. 2016). The flux calibration is described by Tanabe et al. (2008). The new L15 flux is approximately 7% lower than the previous value in Hasegawa et al. (2008), while the L24 flux is almost identical (Table 3)2.
2.3. Re-analysis of Subaru-COMICS observations
The Ryugu observations were described in detail by Hasegawa et al. (2008) and also used by Müller et al. (2011). Here, we re-analysed all data with a more representative handling of the variable atmospheric conditions during the five hours (10:30−15:30 UT) of observations on the 28th August, 2007. Using the CFHT skyprobe3, we found that the sky was generally stable to an accuracy of <~0.05 mag, but sporadically attenuated by >0.1 mag, probably caused by the passage of thin clouds. Although the skyprobe operates at optical wavelengths, it certainly affected the N-band photometry as well.
For the data reduction we followed the latest version (from Nov. 2012) of the COMICS cookbook4. Here we put special emphasis on the construction of time-varying sky flats, a very critical element for the final accuracy of the derived fluxes. With this new element we could recover the flux of a standard star, placed at different detector positions and observed multiple times during our campaign, on a 3% level. The monitoring of the calibration star 66 Peg (HD 220363) allowed us to establish the instrumental magnitudes at the times of the Ryugu observations. Finally, we conducted aperture photometry for the standard star and our target with different aperture sizes. Colour corrections are typically only on a 1−3% level (Hasegawa et al. 2008; Müller et al. 2004), but depend on the object’s spectral energy distribution and the atmospheric conditions and were not applied. Based on the quality of the stellar model for 66 Peg (Cohen et al. 1999), and uncertainties due to colour, aperture and atmosphere issues, we added a 5% error to account for the absolute flux calibration error in the various N-band filters. The updated flux densities, errors and observational circumstances are listed in Table D.1.
2.4. Warm Spitzer observations in 2013
Ryugu was the target of an extensive photometric observation program (Mueller et al. 2012; 2013) in early 2013 using the Infrared Array Camera (IRAC, Fazio et al. 2004) onboard the Spitzer Space Telescope (Werner et al. 2004). The observations include ten “point-and-shoot” measurements consisting of short standard IRAC measurements that were spaced by several days up to a few weeks between January 20 and May 29, 2013, and two complete lightcurves, each using IRAC’s channels 1 and 2 at nominal wavelengths of 3.550 μm and 4.493 μm, respectively5. The point-and-shoot observations were taken between 20th January and 29th May, 2013, covering a phase angle range between −54° and −102°. The lightcurve observations were taken on 10/11th February and 2nd May, 2013 at phase angles of −84° and −85°, respectively. Each lightcurve observation lasted approximately 8 h, which is a little longer than a full rotation period of Ryugu. Observational details are given in Table D.2.
IRAC’s channels 1 and 2 observe the sky simultaneously, with non-overlapping field of views (FOV) that are a number of arc minutes offset from one another. As in previous IRAC observations of near-Earth objects (see, e.g. Trilling et al. 2010), we manually set up a dither pattern in which channels 1 and 2 alternate being on target (off-target frames are discarded in the data analysis). While this incurs additional overheads due to telescope slews, it enables quasi-simultaneous sampling between the two channels. The target was dithered on different parts of the FOV to minimize the impact of any pixel-to-pixel gain differences. The standard photometric measurements (point-and-shoot) took approximately 10 min each. For technical reasons, each of the two lightcurve observations (lc1a/b and lc2a/b) had to be split in two separate observations Astronomical Observation Requests (“AORs” in Spitzer terminology) that were scheduled back-to-back, with a gap of ~7.5 min between them. In the first lightcurve epoch, a 12 s frame time was used. Between the two AORs, there were 465 on-target frames per channel. The observation setup in the second lightcurve epoch was identical, except that two consecutive 6 s frames were used to avoid saturation. The Moving Object mode was used tracking at asteroid rates. Target movement during individual frames was at the sub-arcsecond level and hence much smaller than IRAC’s pixel scale of 1.8′′. Over the duration of a lightcurve, however, the target moved by tens of arc minutes, that is, several IRAC FOV widths.
The data reduction followed the method used in the ExploreNEOs program (Trilling et al. 2010). Briefly, a mosaic of the field is constructed from the data set itself and then subtracted from the individual Basic Calibrated Data (BCD) frames to mitigate contamination from background sources. Due to the short frame times, trailing of field stars during an individual BCD can be neglected. We were therefore able to generate a high signal-to-noise mosaic of the field. Aperture photometry was then performed on the background-subtracted frames. A small number of BCDs were rejected because the target was affected by bad IRAC pixels, cosmic-ray hits, or bright field stars. The derived IRAC fluxes and noise values from this Spitzer PID 90145 are given in Tables A.1, B.1−B.4, including the two lightcurve measurement sequences in full-time resolution.
The measured IRAC fluxes account for the sum of sunlight reflected by the object and thermally emitted flux, integrated over the IRAC passbands. Due to the low albedo of our target combined with its low heliocentric distance, the reflected flux contribution is relatively small. We estimated that the reflected-light contributions are approximately 2−3% at 3.55 μm (approximately 10% at 3.1 μ where the bandpass opens) and well below 1% at 4.49 μm. We did not subtract these contributions, but consider it in the radiometric analysis in our thermophysical model setup which includes thermal emission and reflected light simultaneously. To obtain monochromatic flux densities at the channel 1and 2 reference wavelengths, we have to colour-correct the thermal fluxes. Here, we used model calculations of the object’s SED (reflected light and thermal emission) and combined it with the publically available IRAC spectral response tables6. The resulting colour-correction factors weakly depend on the selected object properties. We used a 6% albedo in combination with a thermal inertia of 200 J m-2 s-0.5 K-1 and obtained colour-correction factors7 of 1.09 (channel 1) and 1.04 (channel 2), with an estimated error of approximately 2% to cover object-SED and passband uncertainties, as well as differences in the observing geometry. In addition to the 2% error for colour correction, we also added a 5% error to account for limitations in the absolute flux calibration of the IRAC channels, diffuse straylight, moving target issues and possible other calibration changes during the warm part of the Spitzer mission8, such as intrapixel sensitivity variations or warm image features. The final colour-corrected flux densities and absolute flux errors are given in Table D.2. For the two lightcurves, we averaged the observed fluxes (see Tables B.1−B.4) over the rotation period of 7.63 h, colour-corrected the fluxes and added the calibration errors as for the point-and-shoot observations.
2.5. Additional thermal measurements
In addition, we also used Spitzer-IRS measurements. The single-epoch Spitzer-IRS spectrum was presented by Campins et al. (2009) and we used it in its calibrated full version and also in a rebinned version with 20 points over the entire wavelength range from 5.2 to 37.7 μm (see description in Müller et al. 2011). The absolute IRS flux accuracy is given with 5−7% which is added quadratically to the uncertainties in the reduced spectrum. Later on, in Sect. 5.2.1 we also use the IRS spectrum without the absolute calibration error for comparing the measured SED slopes with TPM slopes.
3. Ground-based visual observations of 162173 Ryugu with GROND
The Gamma-Ray burst Optical-Near-ir Detector (GROND, Greiner et al. 2008) is mounted on the MPI 2.2 m telescope at the ESO La Silla observatory (Chile). GROND observes in four optical- (g′, r′, i′, z′) and three near-IR (J, H, K) filters, simultaneously. The observations of 162173 Ryugu were performed in pointing mode with four dithers carried out every minute to place the source again in the centre of the 5.4 × 5.4 arcmin2 FOV of the optical Charge-Coupled Devices (CCDs).
A first short set of observations was taken on 27/28th May, 2012, for 2 × 4 min, followed by ≈ 5 h coverage on 8th June 2012 (with a 1.5 h gap in between) and another 3 h the following night. Table D.3 provides a list of observations taken including heliocentric distance r, observatory-centric distance Δ and the phase angle α.
The GROND data were reduced and analysed with the standard tools and methods described in Krühler et al. (2008). The g′, r′, i′ photometry was obtained using aperture photometry with aperture sizes corresponding to 1.5′′ (approximately 2× the width of the PSF) to include the complete flux of the slightly elongated source images (Ryugu was moving approximately 0.8′′ during the ≈35 s integration times). The z, J, H, and K-band measurements were not used for the analysis due to the substantially lower S/N.
The photometry and photometric calibration of 162173 Ryugu was achieved as follows. First, the moving target was extracted from the list of detected sources for each band and filter by its observatory-centric position. For each sequence number in each observation ID we extracted the object’s magnitude and its statistical photometric error for each of the four target dither positions. We additionally extracted several reference stars which were close to the path of Ryugu and similar in brightness (or brighter). As not every star was seen throughout the night (due to the rapid movement of Ryugu of around 100′′/h which required frequent re-pointing of the telescope), we selected several stars so that we had three to four stars at each given time. We monitored the magnitudes of these stars, calibrated against USNO (g′, r′, i′), in parallel to the object’s magnitudes. This resulted in 1σ accuracies of approximately 0.02 mag in the given bands. As the absolute photometric calibration of USNO is not very accurate, only the relative photometry is used in the remainder of the analysis. The results of the GROND lightcurve measurements (one value per TDP9, i.e. for each GROND pointing) are given in Tables C.1 and C.2. The magnitude errors include the photon noise (approximately 0.01−0.03 mag depending on the time of measurements during the nights) and the error from the corrections related to the multiple star measurements (typically well below 0.01 mag). There is also a flat-field error due to the varying position of Ryugu on the GROND camera (0.01 to 0.02 mag) which is difficult to quantify for an individual observation, but explains the scatter for some of the data points.
4. Searching for the spin-axis orientation
The standard lightcurve inversion technique (Kaasalainen & Torppa 2001; Kaasalainen et al. 2001) derives the asteroid’s shape, siderial rotation period and spin-axis direction from the observed lightcurves. Earlier work by Müller et al. (2011), based on a smaller sample of lightcurve observations of Ryugu, found many solutions with different shapes, spin-orientations and rotation periods, all being compatible in the χ2-sense with the available visual data. This analysis was followed by using the derived solutions in the context of the available thermal data. The radiometric technique could eliminate wide ranges of solutions but did not lead to a unique spin-axis orientation. We repeated this procedure, now using many more lightcurve observations and additional thermal data points. However, the almost spherical shape and the insufficient quality of some data sets made this exercise very challenging and no unique solution was found. We therefore tried a different path.
4.1. Spherical shape model
Knowing that the observed lightcurve amplitudes are small (the amplitude is approximately 0.1 mag) we simply assumed a spherical shape model with the spin-axis orientation, size, albedo and thermal inertia as free parameters. Also, instead of using the visual lightcurves first, we started by using the thermal measurements. This approach worked very well in the case of (101955) Bennu where the radiometrically established spin-axis orientation (Müller et al. 2012) agreed within error bars with the radar derived value (Nolan et al. 2013). Furthermore, in the case of the very elongated object (25143) Itokawa, a careful analysis of thermal data in combination with a spherical shape model led to realistic predictions for the orientation of the object’s spin vector within approximately 10° of the in-situ measured values (Müller et al. 2005, 2014).
Summary of general TPM input parameters and applied ranges.
The analysis was performed by means of a TPM code (Lagerros 1996; 1997; 1998; Müller & Lagerros 1998). The target is described by a given size, shape, spin-state and albedo and placed at the true, epoch-specific observing and illumination geometry. The TPM considers a 1-d heat conduction into the surface with the thermal inertia Γ being the critical parameter. Surface roughness is also included, described by “f” the fraction of the surface covered by spherical crater segments and “ρ”, the rms of the surface slopes, connected to the crater width-to-depth ratio (Lagerros 1998). For each surface facet, the energy balance between solar insolation, reflected light and thermal emission is treated individually. The reflected light contribution is calculated by multiplying the solar irradiance with the bidirectional reflectance and the transition phase between reflected light and thermal emission is estimated using Lambert’s scattering law (Lagerros 1996, and references therein). We use the H-G system (Bowell et al. 1989) to describe the amount of reflected light. We used HV = 19.25 ± 0.03 mag and G = 0.13 ± 0.02 which was derived from calibrated V-band observations covering a very wide phase angle range (Ishiguro et al. 2014). Table 4 summarises the general TPM settings for our radiometric analysis.
4.1.1. Using only mid-/far-IR thermal data
In the first step we used the above-mentioned thermal measurements by Herschel-PACS (Table 2), Subaru-COMICS (Table D.1), AKARI, and Spitzer-IRS (see Müller et al. 2011), but we excluded the Spitzer-IRAC measurements (Table D.2). The IRAC measurements are taken at shorter wavelengths (3.6 and 4.5 μm) where reflected light contributions might play a role. In addition, the individual short-wavelength (absolute) thermal fluxes are dominated by the hottest areas on the surface (related to local shape features near the sub-solar point), and global shape and spin properties are less relevant.
We used a spherical shape model with approximately 100 different spin axis orientations distributed over the entire 4 π solid angle. In a first round, we used a grid of pole directions with 30° steps, and later on we refined the steps around some of the promising pole directions (when the χ2-values were within 3σ of an acceptable solution). This iterative approach worked well, knowing that the surface temperature distribution on a spherical shape model changes only gradually when changing the pole direction by one step. Size, albedo and thermal inertia are the dominating object properties when trying to reproduce the observed fluxes; the roughess has only a minor influence. We started by assuming a moderate surface roughness (rms-slopes of 0.2) to lower the number of free parameters in the first iteration.
For each value of the spin axis, we solved for the effective size and geometric albedo for a wide range of thermal inertias ranging from 0 (regolith with extremely low heat conductivity) to 2500 J m-2 s-0.5 K-1 (bare rock surface with very high conductivity). The results are shown in Fig. 1 (top) with one curve per spin-axis orientation, each with a specific size/albedo solution as a function of thermal inertia. Reduced χ2 values close to 1.0 indicate a good fit to the thermal data set. In the bottom part of the figure we show the standard χ2 values in the ecliptic longitude and latitude space: χ2 = Σ((FDTPM−FDObs) /errObs)2, with the confidence levels indicated by grey colours: 1σ level agreement (dark grey) where  , 2σ level (intermediate grey) where
  , and 3σ level (light grey) where
  . Many orientations of the spin axis can be excluded with very high probability; they simply do not allow us to explain all thermal measurements simultaneously, independent of the selected thermal inertia (and size/albedo). However there are still two remaining zones for the possible spin vector: (1) longitudes 90−130° and a wide range of latitudes from −15° to −70°; (2) longitudes 290−350° combined with latitudes +10° to −60°. At the 3σ level there is even a third small zone at an approximate longitude 160° and latitude +30°. The true zones are probably slightly larger considering that we assumed a spherical shape and a fixed level of surface roughness.
4.1.2. Using Spitzer-IRAC averaged lightcurve measurements
Before investigating the full IRAC data set, we looked into the most crucial aspect for our spherical-shape analysis; namely the target’s flux increase between 10/11th Feb. and 2nd May, 2013, the epochs when full lightcurves were taken by Spitzer-IRAC. The flux increase is related to two effects: (i) The changed observing geometry: the Spitzer-centric distance decreased from approximately 0.23 AU in Feb. 2013 to approximately 0.11 AU in May 2013 (while the heliocentric distances and phase angles were very similar); (ii) The object moved on the sky by approximately 88° between February and May 2013, and depending on the orientation of the spin axis, the aspect angle (the angle under which the observer sees the rotation axis) was very different. The flux change between the two Spitzer lightcurve epochs is therefore very much related to the object’s spin-axis orientation. Table D.2 contains details of these measurements.
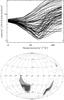 |
Fig. 1 χ2 test for the complete set of spin-vector orientations and the full range of thermal inertias. Values close to 1.0 indicate acceptable solutions. Top: reduced χ2 values as a function of thermal inertia. Bottom: 1σ- (dark grey), 2σ- (intermediate grey), and 3σ- (light grey) χ2 values as a function of spin-axis ecliptic longitude and latitude in aitoff projection. The (λ; β) ecliptic coordinates of all tested orientations are shown as diamonds. |
We use the lightcurve-averaged observed fluxes to avoid shape effects in our search for the spin vector (see entries ⟨lc1⟩ and ⟨lc2⟩ in Table D.2). We also did not convert the observed in-band fluxes into monochromatic flux densities at the reference wavelength due to unknowns in the object’s SED at these short wavelengths where reflected light starts to play a role. The SED shape at wavelengths below 5 μm is, in general, very sensitive to the highest surface temperatures and this depends on unknown surface structures, roughness and possibly also on material properties.
The flux changes between the two visits are independent of all corrections. The flux ratio between the second and the first epoch is 3.58 (±0.1) in the 3.6 μm band and 3.61 (±0.05) in the 4.5 μm band. For our calculations we used a conservative average flux ratio of 3.6 ± 0.2, independent of wavelengths.
 |
Fig. 2 Comparison between model flux ratios and the observed Spitzer-IRAC flux ratio of 3.6 ± 0.2 in the (λ; β)-space. The grey zones indicate spin-axis orientations which can reproduce the observed flux ratio on a 1σ (dark-grey), 2σ (intermediate-grey), and 3σ (light-grey) level. |
Starting out again with the spherical shape model, we determined the size, albedo and thermal inertia solution connected to the minima in the reduced-χ2 curves, for each of the 100 spin orientations (top part of Fig. 1) to guarantee in each case the optimal solution with respect to our full thermal data set. Now we can predict the model fluxes and flux ratios for the two Spitzer epochs for each spin orientation (see Table D.2). We compare the model flux ratios with the observed flux ratio of 3.6 ± 0.2 by calculating the χ2-values 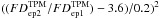 and the corresponding 1−3σ thresholds (see formula above). Figure 2 shows the result of this χ2-test on the basis of the observed IRAC flux ratio. Here again, large ranges of spin-axis orientations can be excluded because of a mismatch with the observed flux ratio. There remain, however, many possible pro- and retrograde solutions.
4.1.3. Summary spherical shape approach
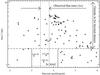 |
Fig. 3 Calculated flux ratios for the two IRAC epochs on 2nd May and 10/11th Feb., 2013, as a function of the minimum χ2 values from Fig. 1. The observed IRAC flux ratio of 3.6 ± 0.2 (and the 3σ level) is indicated by vertical lines and the acceptance level from the analysis of the thermal data set is given by the dashed horizontal line. |
Figure 3 shows the summary of both constraints with each spin-vector orientation represented by a diamond. The y-axis shows the values of the reduced χ2 minima from Fig. 1 (top), the x-axis shows the corresponding model prediction for the IRAC flux ratio. The points below the horizontal long-dashed line show all solutions which are compatible (3σ) with the thermal data set, the vertical dashed lines indicate the observed flux ratio and the solid lines indicate the 3σ range). There are only three solutions compatible with both constraints: (λ; β)ecl = (315°, -50°), (330°, −35°), and (330°, –50°), with the first two being within both 1σ levels. Due to coarse sampling of the 4π space and the various assumptions for the shape and surface roughness, we estimated that the true spin-vector solution must lie somewhere in the range 310° to 335° in ecliptic longitude and −65° to −30° in ecliptic latitude. Our analysis from Sects. 4.1.1 and 4.1.2 for this range of pole solutions points to a low-roughness surface (rms of surface slopes below 0.2) and thermal inertias of approximately 200−300 J m-2 s-0.5 K-1, but still with significant uncertainties in size (approximately 815−900 m) and albedo (between 0.04 and 0.06).
4.2. Using thermal and visual-wavelength photometric data together
To confirm the results obtained by the method described in the previous section, we tried another independent approach to determine the spin axis orientation of Ryugu, using both photometric data and all thermal data together in one inversion procedure. The thermal data are the ones previously published and presented in Sect. 2, the visual lightcurves are presented in M.-J. Kim et al. (in prep.) together with a set of ground-based observations taken with GROND mounted on the MPI 2.2 m telescope at the ESO La Silla observatory (Chile) which is described in Sect. 3 and Appendix C. The method is a modification of the standard lightcurve inversion of Kaasalainen et al. (2001) including also a thermophysical model. Its output is a convex shape model together with all relevant geometrical and physical parameters (spin axis direction, rotation period, size, thermal inertia of the surface, albedo and surface roughness) that best fit the lightcurves and thermal fluxes. It uses the Levenberg-Marquardt algorithm to minimize the χ2 difference between the data and the model by optimising the model parameters. The total χ2 of the fit is composed of two parts 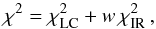 (1)where
  corresponds to the difference between the model and photometric data and
  corresponds to the difference between the model and thermal data. The relative weight w of one data source with respect to the other is set such that the best-fit model gives an acceptable fit to both data sets. Formally, the optimum weight can be found with the approach proposed by Kaasalainen (2011). Note that, overall, we use approximately 3100 data points from lightcurve measurements (Kim et al., in prep., and Appendix C) in addition to the large collection of thermal measurements (see Sect. 2), while the pole, rotation period, size, thermal inertia and shape are used as free parameters. For our calculations we used the rebinned Spitzer-IRS spectrum, 18 Subaru-COMICS measurements, 2 AKARI and 1 Herschel-PACS data points, as well as the 2 Spitzer-IRAC thermal lightcurves and the 10-epoch IRAC point-and-shoot sequence, with IRAC data always taken in two channels.
The thermo-physical part of the code is based on solving 1D heat conduction to get the temperature of each surface facet, for which the flux is computed. It is an independent implementation of the TPM code described in Sect. 4.1 based on the thermal model of Lagerros (1996, 1997, 1998). The hemispherical albedo needed for the boundary condition at the surface is computed in each step from the parameters of the Hapke’s photometric model that is also used in the photometric part. This new method has been developed by Ďurech et al. (2012) and tested on asteroid (21) Lutetia, as well as on several other asteroids. We describe the method and its results in detail in a separate paper (Ďurech et al., in prep.).
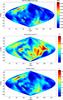 |
Fig. 4 The colour map of the goodness of fit for the lightcurves, thermal data and combined data for all possible orientations of the spin axis given in ecliptic coordinates (λ,β). The top panel shows the rms residuals between the model and observed lightcurves, the middle plot shows the reduced χ2 for the thermal data and the bottom plot shows the total χ2 (Eq. (1)). |
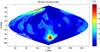 |
Fig. 5 The colour map of the ratio I3/Iz for models corresponding to all possible orientations of the spin axis given in ecliptic coordinates (λ,β). The white contour corresponds to the level 1.1. |
The results for Ryugu are shown in Fig. 4, where the fit to the lightcurves, thermal data and the combined total χ2 is plotted for a grid of pole directions with a 5° step and the rotation period P = 7.6300 h. Because the model is rather flexible and the quality of the lightcurves is poor, there is no clear minimum in χ2 that would define a unique spin direction. Moreover, even the sidereal rotation period cannot be determined unambiguosly from the current data set. There are more possible values (P = 7.6300, 7.6311, 7.6326 h, for example) that give essentially the same fit to the data and very similar χ2 maps for the pole direction. However, some solutions with low values of χ2 are not correct in the physical sense; the model fits the data well, but the corresponding shape is too elongated along the rotation axis, which does not agree with the assumption of a relaxed rotation around the principal axis with the maximum inertia. Because the inversion algorithm works with the Gaussian image of the body (see Kaasalainen & Torppa 2001), the inertia tensor cannot be constrained during the shape optimisation. The alignment of rotation and principal inertia axes has to be checked afterwards and unphysical models must be rejected. For each model, we computed the moment of inertia Iz corresponding to the rotation around the actual z axis and moment of inertia I3 corresponding to the rotation along the shortest axis (minimum energy). We plot the ratio I3/Iz for all poles in Fig. 5. The artificial boundary of 1.1 (based on our experience with models from lightcurves) divides those solutions that are formally acceptable (I3/Iz < 1.1) from those that are not.
Another constraint we used was related to thermal inertia Γ of our models that is shown in Fig. 6. According to Campins et al. 2009, thermal inertia of Ryugu is higher than 150 J m-2 s-0.5 K-1, which is also confirmed by our analysis in Sect. 5.2.1. Therefore, from all solutions in Fig. 4 (and also from similar maps for two other acceptable periods of 7.6311 and 7.6326 h), we selected only those that had I3/Iz < 1.1 and Γ > 150 J m-2 s-0.5 K-1. These are shown in Fig. 7, where the blue areas show plausible pole solutions with low total χ2. Still the pole direction is not well defined.
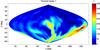 |
Fig. 6 The colour map of the thermal inertia Γ for models corresponding to all possible orientations of the spin axis given in ecliptic coordinates (λ,β). The white contour corresponds to Γ = 150 J m-2 s-0.5 K-1. |
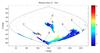 |
Fig. 7 The intersection between the total χ2 colour maps (Fig. 4) for three possible rotation periods and the conditions I3/Iz < 1.1 and Γ > 150 J m-2 s-0.5 K-1. |
Because this convex model is more flexible than the spherical model from Sects. 4.1.1 and 4.1.2, the range of possible pole directions is larger. Solutions with λ between 310 and 340° and β ~ −40° (denoted A in Fig. 7) are preferred because they not only provide the lowest χ2 but are also stable against the limit of inertia ratio, the minimum value of Γ, particular value of the weight w in Eq. (1) and the resolution of the shape model. Moreover, they show no systematic trends in the distribution of residuals for the fit of thermal data and are also consistent with the results of the previous section. The formally best-fit model for period P = 7.6311 h has the pole direction (340°,−40°), a volume-equivalent diameter of 853 m, a surface-equivalent diameter of 862 m, a thermal inertia of 220 J m-2 s-0.5 K-1 and a very smooth surface (assuming no surface roughness in the model setup). The corresponding shape model is shown in Fig. 8 and the synthetic lightcurves produced by this model are compared with the observed lightcurves in Fig. 9.
The other formally possible pole directions correspond to other blue “islands” (denoted A−E) in Fig. 7 with the approximate pole coordinates B: (100°,−70°), C: (100°,−40°), D: (180°,0°), and E: (350°,−20°) (see Table 5).
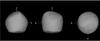 |
Fig. 8 The formally best-fit shape model of Ryugu for pole direction (340°,−40°). |
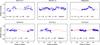 |
Fig. 9 Comparison between the model (red curves) and the data (points) for a subset of visual lightcurves. The viewing and illumination geometry for the corresponding pole (340°,−40°) is given by the latitude of sub-Earth point θ, latitude of the subsolar point θ0, and the solar phase angle α. |
5. Discussion and final thermophysical model analysis
5.1. Analysis of previously published solutions
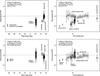 |
Fig. 10 Test of the Campins et al. (2009) solutions against our large thermal data set. Top left: observation-to-TPM flux ratios as a function of phase angle; top right: as a function of wavelength; bottom: same as top, but now calculated for the lower thermal inertia limit of 150 J m-2 s-0.5 K-1 and the extreme case of an equatorial retrograde geometry (at the time of IRS observations and as seen from Spitzer). |
Campins et al. (2009) analysed a single-epoch IRS measurement and found a thermal inertia of 700 ± 200 J m-2 s-0.5 K-1 under the assumption of the published spin-axis orientation by Abe et al. (2008). They also investigated the reliability of the IRS data and found a rigorous lower limit of 150 J m-2 s-0.5 K-1 for an extreme case of an equatorial retrograde geometry. We tested the Campins et al. (2009) solution (Γ = 700 ± 200 J m-2 s-0.5 K-1, Deff = 0.90 ± 0.14 km, pV = 0.07 ± 0.01, spherical shape, spin axis with (λ, β)ecl = (331°, +20°), Psid = 7.6272 h) against our thermal data set. Their solution explains the Spitzer-IRS measurements very well, with observation-to-model flux ratios close to one (see Fig. 10 top left/right), confirming the Campins et al. (2009) analysis. However, this solution fails to reproduce measurements at other phase angles. The high thermal inertia of 700 J m-2 s-0.5 K-1 (in combination with the spin-axis orientation) leads to model predictions which are up to a factor of two higher than the measurements, with the largest offsets being connected to the before-opposition Spitzer-IRAC measurements. Using the limiting thermal inertia of 150 J m-2 s-0.5 K-1 in combination with the extreme case of an equatorial retrograde geometry10 helps to explain part of the phase-angle-dependent offsets seen before (in combination with a radiometrically optimised size and albedo), but overestimates the IRAC lightcurves by approximately 25% and also introduces trends with wavelengths and phase angle in the ratio plots (Fig. 10 bottom left/right). We tested the full range of thermal inertias from 0−2500 J m-2 s-0.5 K-1 for smooth and rough surfaces, but it was not possible to simultaneously explain all thermal measurements with either of these two spin-axis orientations. The remaining offsets are too big to be explained by shape effects without violating the constraints from the shallow visual lightcurves. The analysis of the Campins et al. (2009) solutions in the context of our much larger data set shows that (i) the high thermal inertia of 700 J m-2 s-0.5 K-1 in combination with the spin axis by Abe et al. 2008) is not correct; (ii) the low thermal inertia of 150 J m-2 s-0.5 K-1 in combination with an extreme case of an equatorial retrograde geometry is also problematic; (iii) the thermal data include crucial information about thermal inertia and the orientation of the spin axis; (iv) a single-epoch measurement, even if covering a wide wavelength range, is not sufficient to determine the object’s thermal inertia; (v) offsets and trends between measurements and model predictions are clearly connected to incorrect assumptions in the model surface temperature distribution and not due to shape effects which could possibly explain offsets of 10%, but not the huge discrepancies seen in Fig. 10.
It is also worth taking a closer look at the three proposed solutions by Müller et al. (2011). Here, the authors used more complex shapes, but their thermal data were limited to a phase angle range between +20° and +55° and the focus of the TPM analysis was on high-roughness surfaces. We tested all three shape-spin settings against our much larger thermal data set (including the IRAC point-and-shoot measurements), and now considering much smoother surfaces with rms surface slopes below 0.4. The calculations show the following: (i) all solutions seem to point to a much smoother surface than what was assumed in Müller et al. (2011); (ii) their best solution (λ, β) = (73.1°, –62.3°) in ecliptic coordinates leads to a thermal inertia of 200 J m-2 s-0.5 K-1, and their solutions #2 and #3 would require lower thermal inertias below the Campins et al. limit of 150 J m-2 s-0.5 K-1; (iii) solution #1 is close to our solutions in zone B (see Fig. 7 and Table 5) and explains most of the observational data within the given observational error bars. Only the PACS measurement and one of the IRAC lightcurve measurements are off by approximately 15−20%. This model also fails to explain part of the IRAC point-and-shoot sequence and produces observation-to-model flux ratios ranging from 0.78 to 1.55, some ratios even being well outside the 3σ error bars. Interestingly, the point-and-shoot measurements in early 2013, when the phase angle was changing from –70° to –90°, are nicely matched, while some of the measured fluxes in May 2013 are up to 55% higher than the corresponding model predictions. In this time period, the phase angle was in the range –90° to –55° and the object had its closest approach to Spitzer (≈0.11 AU). Overall, solution #1 from Müller et al. (2011) might still be acceptable from a statistical point of view (depending on the weight of the short-wavelength IRAC data in the radiometric analysis), but the mismatch to some IRAC measurements is obvious and we exclude that solution.
Yu et al. (2014) calculated a shape solution from MPC (Minor Planet Center) lightcurves, but their shape solution is not publically available. Looking at the MPC data, we doubt that a reliable shape can be reconstructed for the existing data. Also, the effective diameter of 1.13 ± 0.03 km (pV = 0.042 ± 0.003) is unrealistically large. Using the Yu et al. (2014) solution (in combination with a spherical shape) produces observation-to-model flux ratios in the range 0.43 to 0.88, that is, the model predictions are far too high.
5.2. New solutions and constraints on Ryugu’s properties
5.2.1. Thermal inertia
The χ2 analysis in the Sects. 4.1 and 4.2 point towards a pole direction close to (310°,−40°), but it cannot completely rule out other solutions from a statistical point of view. This can also be seen in Fig. 11 where we show χ2 curves as a function of thermal inertia for all remaining 11 shape and spin-pole solutions (Table 5). The corresponding spherical shape solutions are shown as dashed lines. The most striking thing is that the lowest χ2 values are all connected to thermal inertias of 200−300 J m-2 s-0.5 K-1. There is another group of solutions with higher χ2 values close to our thermal-inertia boundary of 150 J m-2 s-0.5 K-1 (see analysis by Campins et al. (2009) of the Spitzer-IRS data), but no acceptable solutions anymore at Itokawa-like and higher values for the thermal inertia.
Our combined thermal data set, including the IRAC measurements, constrains the thermal inertia very well: we can confirm the thermal-inertia boundary of 150 J m-2 s-0.5 K-1 (see analysis by Campins et al. (2009)) and starting at approximately 300 J m-2 s-0.5 K-1 the models cannot explain the IRAC measurement sequences anymore.
5.2.2. Surface roughness
The statistical analysis in Sect. 4.2 led to a formally best solution for smooth surfaces. If we introduce roughness at a low level, we still find the best solutions connected to zone A, but now the best spin pole seems to move towards a higher longitude approaching the solution at (340°,−40°). However, as soon as the rms of the surface slopes goes above 0.1 there are problems in fitting the IRAC point-and-shoot sequence, and also in fitting the two IRAC thermal lightcurves. Overall, higher levels of roughness are connected to size-albedo solutions with higher thermal inertias and vice versa. This degeneracy problem is present in most radiometric solutions (see also Rozitis & Green 2011 for a discussion on the degeneracy between roughness and thermal inertia), but here the low-roughness solutions are clearly favoured.
5.2.3. Size and albedo
Radiometric size and albedo constraints depend heavily on the shape-spin solution. In the central part of zone A (solution #2 in Table 5) we find sizes (of an equal volume sphere) of 850 to 880 m, and albedos of 0.044 to 0.050 (connected to HV = 19.25 ± 0.03 mag). Including the zone-A boundaries and considering the full thermal inertia and roughness range, as well as the corresponding shape solutions, we estimate a size range of approximately 810 to 900 m (of an equal-volume sphere) and geometric V-band albedos of approximately 0.042 to 0.055. However, all the solutions (#1 and #3 in Table 5) have issues with fitting part of the thermal data (see Sect. 5) and we restrict our size-albedo values to solution #2 in the central zone A.
5.2.4. Grain sizes
We use a well-established method (Gundlach & Blum 2013) to determine the grain size of the surface regolith of Ryugu. First, the thermal inertia Γ can be translated into a possible range of thermal conductivities λ with  (2)where c is the specific heat capacity, ρ the material density, and φ the regolith volume-filling factor, which is typically unknown. This last parameter is varied between 0.6 (close to the densest packing or “random close pack (RCP)” of equal-sized particles) and 0.1 (extremely fluffy packing or “random ballistic deposition (RBD)”, plausible only for small regolith particles where the van-der-Waals forces are larger than local gravity). For the calculation, we used the CM2 meteoritic sample properties from Opeil et al. (2010), with a density ρ = 1700 kg m-3, and a specific heat capacity of the regolith particles c = 500 J kg-1 K-1. This leads to heat conductivities λ in the range 0.1 W K-1 m-1 (average thermal inertia combined with the highest volume-filling factor) to 0.6 W K-1 m-1 assuming the lowest filling factor (also considering the full thermal inertia range would result in a λ range of 0.04 to 1.06 W K-1 m-1).
We combine this information with the heat conductivity model by Gundlach & Blum (2013), again by using properties of CM2 meteorites, to estimate possible grain sizes on the surface. First, we calculated maximum surface temperatures in the range ≈320 to 375 K, considering the derived object properties and heliocentric distances (rhelio: 1.00−1.41 AU) of our observational (thermal) data set. At the object’s semi-major axis distance (a = 1.18 AU) we find a reference maximum temperature of 350 K. It is worth noting that changing the surface temperature by a few tens of degrees does not significantly affect the results. In a second step, we determine the mean free path of the photons, the Hertzian dilution factor for granular packing for the specified regolith volume-filling factors. Our estimated grain sizes are in the range 1 to 10 mm, in excellent agreement with indpendent calculations by Gundlach (priv. comm.) which led to 0.7 to approximately 7 mm grain sizes. We note that our value is different than values given in Gundlach & Blum (2013), mainly due to different assumptions for the thermal inertia. At the derived grain-size level, the heat transport on the surface is still dominated by radiation, with increasing heat conduction for lower thermal inertias.
5.2.5. Reference solution
Figures 12−15, inform us on the quality of our TPM predictions and the thermal IR data, in combination with wavelengths, phase angle and time of the individual measurements. For these figures we calculated the TPM predictions for each data point using the true observing and illumination geometry as seen from the specific observatory. The TPM fluxes are used in terms of absolute times and absolute fluxes; no shifting or scaling was applied. The model has the following settings:
-
shape solution with (λ, β) = (340°, –40°) in ecliptic coordinates; Psid = 7.63109 h (#2 in Table 5) from inversion technique using visual and thermal lightcurves and infrared photometric data points;
-
thermal inertia (top layer) of 200 J m-2 s-0.5 K-1;
-
low surface roughness with rms of surface slopes of 0.05;
-
size (of an equal-volume sphere): 856 m;
-
geometric V-band albedo: 0.049 (connected to HV = 19.25 mag);
-
emissivity of 0.9.
This TPM solution matches the different thermal observational data sets very well over wide ranges of phase angles, times, wavelengths and rotational phases. For the IRAC data (very short thermal wavelengths at the Wien-part of the SED) there are still small residuals, but here individual shape facets and local temperature anomalies can easily change the total fluxes and significantly influence the interpretation. At longer wavelengths, that is, in the Rayleigh-Jeans part of the spectrum, these small-scale shape and temperature features are less relevant. Here, the shape of the SED is connected to the disk-averaged temperatue on the surface. The observed long-wavelength fluxes are therefore crucial for the determination of the object’s size.
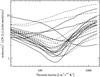 |
Fig. 11 Reduced χ2 values as a function of thermal inertia for all 11 shape and spin-pole solutions. True shape solutions are shown as solid lines, spherical shapes as dashed lines. Acceptable solutions should have reduced χ2 values close to 1. |
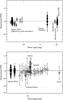 |
Fig. 12 All thermal observations divided by the corresponding TPM prediction based on solution #2 in Table 5 as a function of phase angle (top), and as a function of wavelengths (bottom). No trend in observation-to-model flux ratios is visible over the very wide phase angle range from −89° to + 53°, nor over the wide range of wavelengths from 3.55 to 70 μm. The rebinned IRS data are shown as triangles together with the absolute flux error of each individual data point. |
The observation-to-model plots in Fig. 12 are very sensitive to changes in thermal inertia. Smaller thermal inertias lead to a peaked temperature distribution (close to the sub-solar point) and the corresponding disk-integrated object flux is dominated by the hottest surface temperature; at least at short wavelengths below 5 μm. Larger thermal inertias “transport” the surface heat to the “evening” parts of the surface which are not directly illuminated by the Sun. This redistribution leads to a slightly different shape of the spectral energy distribution since the warm regions at the evening terminator contribute noticably to the total flux. As a result, the slope in observation-to-model flux ratios changes (best visible in Fig. 10, right side).
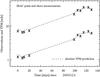 |
Fig. 13 Absolutely calibrated Spitzer-IRAC point-and-shoot fluxes at 3.550 and 4.493 μm taken between 20th Jan., and 30th May, 2013 (phase angles go from –71.6° to –88.9° and back to –54.5° during that period. The absolute TPM predictions (#2 in Table 5) for both channels are shown as dashed lines. |
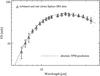 |
Fig. 14 Absolutely calibrated Spitzer-IRS spectrum from 2nd May, 2008 (see Campins et al. 2009), rebinned data are shown as triangles, the full data set as dots. The absolute TPM prediction (#2 in Table 5) is shown as a dashed line. |
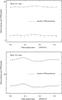 |
Fig. 15 Absolutely calibrated Spitzer-IRAC lightcurves in both channels from 10/11th Feb., 2013 (phase angle: –83.6°, aspect angle: 137.8°; top), and from 2nd May, 2013 (phase angle: –85.0°, aspect angle: 129.5°; bottom). The absolute TPM predictions (#2 in Table 5) are shown as dashed lines. |
The difference between a warm evening side and a cold morning side is largest for large phase angles and at wavelengths close to or beyond the thermal emission peak at approximately 20 μm (see also figures and discussion in Müller 2002). Our thermal data set has observations taken before and after opposition, covering a wide range of phase angles, but the data are very diverse in wavelength and quality. The Spitzer IRAC data are all taken before opposition (negative phase angles, leading the Sun) and, in addition, these very short wavelengths are less sensitive to the morning-evening effects. All crucial data sets (AKARI, Subaru, Herschel) for constraining the thermal inertia via before-after-opposition asymmetries are taken either at a very limited phase angle range (AKARI-IRC, Herschel-PACS) or have substantial error bars (Subaru-COMICS, Herschel-PACS).
The most direct thermal inertia influence can be seen in the Spitzer-IRS spectrum (see Fig. 10, right side). The ratios between observed fluxes and the corresponding model prediction show a clear trend with wavelengths at low (and also at high) values of thermal inertia. The mismatch between observed and modeled fluxes is evident, and would be even larger in cases of higher thermal inertias. From a statistical point of view, both cases are still acceptable, but there are two reasons why we have higher confidence in #2 of Table 5 which is connected to a thermal inertia of around 200 J m-2 s-0.5 K-1: (1) TPM predictions with lower or higher thermal inertias produce wavelength-dependent ratios increasing or decreasing with wavelength, respectively; these trends can be attributed to unrealistic model temperature distributions on the surface; (2) for a comparison of model SED slopes with the observed IRS slope, it is more appropriate to use only the IRS measurement errors without adding an absolute calibration error. In this case, the low/high thermal inertia trends are statistically significant with many flux ratios at short and long wavelengths being outside the 3-sigma limit. However, for a realistic comparison with all other data sets we also used absolute flux errors for IRS data in Figs. 10, 12, and 14.
6. Conclusions
Despite our extensive experience in reconstructing rotational and physical properties of many small bodies and the large observational data set for Ryugu, this case remains challenging. The visual lightcurves have very low amplitudes and the data quality is not sufficient to find unique shape and spin properties in a standard way by lightcurve inversion techniques.
We have collected all available data sets, published and unpublished, and obtained a large data set of new visual and thermal measurements from ground and space, including Herschel, Spitzer, and AKARI measurements, with multi-epoch, multi-phase angle and wavelength coverage. We also re-reduced previously published data (Subaru, AKARI) with improved methods.
We combined all data and analysed them using different methods and thermophysical model codes with the goal being to determine the object’s size, albedo, shape, surface, thermal and spin properties. In addition to standard (visual) lightcurve inversion techniques, we applied TPM radiometric techniques assuming spherical and more complex shapes, and also a new radiometric-inversion technique using all data simultaneously. Our results are thus summarised: This C-class asteroid has a retrograde rotation with the most likely axis orientation of (λ, β)ecl = (340°, –40°), a rotation period of Psid = 7.63109 h and a very low surface roughness (rms of surface slopes <0.1). The object’s spin-axis orientation has an obliquity of 136° with respect to Ryugu’s orbital plane normal (full possible range: 114° to 136°). We find a thermal inertia of the top-surface layer of 150−300 J m-2 s-0.5 K-1, and, based on estimated heat conductivities in the range 0.1 to 0.6 W K-1 m-1, we find grain sizes of ≈1−10 mm on the top-layer surface. We derived a radiometric size (of an equal-volume sphere) of approximately 850 to 880 m (connected to the above rotational and thermal properties). Considering also the less-likely solutions from zones B and C in Table 5 would widen the size range to approximately 810 to 905 m. The convex shape model has approximate axis ratios of a/b = 1.025 and b/c = 1.014. Some of the solutions in Table 5 have more elongated shapes with a/b rising to approximately 1.06, and b/c axis ratios ranging from 1.01 to 1.07; one of the solutions (#5 in Table 5) shows a more extreme b/c ratio of 1.21. Using an absolute magnitude in V-band of HV = 19.25 ± 0.03 mag we find a geometric V-band albedo of pV = 0.044−0.050. Less probably, solutions from Table 5 would result in an albedo maximum of 0.06. A radiometric analysis using a simple spherical shape points to a very similar spin-vector solution lying somewhere in the range 310° to 335° in ecliptic longitude and –65° to –30° in ecliptic latitude, connected to a low-roughness surface (rms of surface slopes below 0.2), thermal inertias of approximately 200 to 300 J m-2 s-0.5 K-1, but still with significant uncertainties in size (approximately 815−900 m) and albedo (between 0.04 and 0.06), but in excellent agreement with our final solution. Automatic procedures using radiometric and lightcurve inversion techniques simultaneously led to a range of possible spin solutions (from the statistical point of view), grouped into five different zones (see Fig. 7). A more careful (manual) testing of all solutions within the five zones was required to find the most likely axis orientation in the context of our large, but complex thermal data set.
Our analysis shows that thermal data can help to reconstruct an object’s rotational properties, in addition to its physical and thermal characteristics. But the Ryugu case also shows that: (i) high-quality multi-aspect visual lightcurves are crucial for reconstructing shape and spin properties, and even more for cases with low-amplitude lightcurves; (ii) thermal data can help to reconstruct the spin properties, also in cases of low-amplitude lightcurve objects; (iii) there are many ways of combining visual (originating from the illuminated surface only) and thermal data (related to the warm surface areas) in a single inversion technique, and the outcome depends strongly on the quality of individual data sets and the weights given to each data set; (iv) thermal data are very important for constraining size, albedo, and thermal inertia, but one must consider the degeneracy between thermal inertia and surface roughness: often low-roughness combined with low-inertia solutions fit the data equally well as high-roughness combined with high-inertia settings; (v) thermal data also carry information about the object’s spin-axis orientation, but the interpretation is not straight forward: first of all, shape features can be misleading, secondly, short-wavelength fluxes (such as the short-wavelenth Spitzer-IRAC data) are originating from the hottest terrains on the surface and global shape and spin properties have weaker influences; (vi) long-wavelength thermal data (beyond the thermal emission peak) are crucial for constraining size, albedo and thermal inertia, and they are important for reconstructing spin properties (if error bars are not too large); (vii) single-epoch thermal observations, even in cases with a full thermal emission spectrum as obtained by Spitzer-IRS, can lead to incorrect thermal inertias.
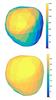 |
Fig. 16 Ryugu as seen from Earth on 1st July, 2018, close to the arrival time of the Hayabusa-2 mission at the asteroid (r = 0.988 AU, Δ = 1.903 AU, α = 18.6°), calculated using our reference shape, spin (#2 in Table 5), size, thermal solution, with the z-axis pointing in the direction of the spin axis (along the insolation/temperature colour bars). Top: solar insolation in W/m2, with the sub-solar point located at the peak insolation. Bottom: the TPM-calculated temperatures (in Kelvin). |
Our favoured solution (#2 in Table 5) can now be used to make visual and thermal predictions for future observations. This solution is also the “design reference model” for the preparation and conduction of the Hayabusa-2 mission. Figure 16 shows the thermal picture of Ryugu close to the arrival time of the Hayabusa-2 mission in July 2018.
AKARI IRC imaging toolkit version 20150331.
The full reprocessed data catalogue can be found at http://www.ir.isas.jaxa.jp/AKARI/Archive/Catalogues/Asteroid_Flux_V1/
The mnemonic Spitzer IRAC channel designations are 3.6 μm and 4.5 μm.
http://irsa.ipac.caltech.edu/data/SPITZER/docs/irac/calibrationfiles/spectralresponse/; see also discussion in Hora et al. 2008
Divide in-band thermal fluxes by correction factors to obtain monochromatic fluxes.
Telescope Dither Position.
The extreme case of an equatorial retrograde geometry at the time of IRS observations and as seen from Spitzer corresponds to a spin-axis orientation of (λ, β) = (80°, –80°).
Acknowledgments
The work of C.K. has been supported by the PECS-98073 contract of the European Space Agency and the Hungarian Space Office, the K-104607 grant of the Hungarian Research Fund (OTKA), the Bolyai Research Fellowship of the Hungarian Academy of Sciences, and the NKFIH grant GINOP-2.3.2-15-2016-00003. E.V. acknowledges the support of the German DLR project number 50 OR 1108. Part of the funding for GROND (both hardware as well as personnel) was generously granted by the Leibniz-Prize to Prof. G. Hasinger (DFG grant HA 1850/28-1). The work of J.Ď. was supported by the grant 15-04816S of the Czech Science Foundation. M.J.K. and Y.J.C. were partially supported by the National Research Council of Fundamental Science & Technology through a National Agenda Project “Development of Electro-optic Space Surveillance System” and by matching funds from the Korea Astronomy and Space Science Institute. The work of S.H. was supported by the Hypervelocity Impact Facility, ISAS, JAXA. The work of M.I. and H.Y. was supported by research programs through the National Research Foundation of Korea (NRF) funded by the Korean government (MEST; Nos. 2012R1A4A1028713 and 2015R1D1A1A01060025). P.S. acknowledges support through the Sofja Kovalevskaja Award from the Alexander von Humboldt Foundation of Germany. The work of M.D. was performed in the context of the NEOShield-2 project, which has received funding from the European Union’s Horizon 2020 research and innovation programme under grant agreement No. 640351. M.D. was also supported by the project 11-BS56-008 (SHOCKS) of the French Agence National de la Recherche (ANR). We thank to M. Yoshikawa (ISAS) who offered his continuous advice and encouragement, and B. Gundlach for support in calculating grain sizes. We thank J. Elliott for the GROND test observations on May 27/28, 2012 and S. Larson for providing additional lightcurve observations. The research leading to these results has received funding from the European Union’s Horizon 2020 Research and Innovation Programme, under Grant Agreement No. 687378.
References
- Abe, M., Kawakami, K., Hasegawa, S., et al. 2008, COSPAR Scientific Assembly, Conf. held 13–20 July, in Montréal, Canada, 12 [Google Scholar]
- Balog, Z., Müller, T. G., Nielbock, M., et al. 2014, Exp. Astron., 37, 129 [NASA ADS] [CrossRef] [EDP Sciences] [Google Scholar]
- Bowell, E., Hapke, B., Domingue, D., et al. 1989, in Asteroids II; Proc. Conf. (Tucson, AZ: University of Arizona Press), 524 [Google Scholar]
- Campins, H., Emery, J. P., Kelley, M., et al. 2009, A&A, 503, L17 [NASA ADS] [CrossRef] [EDP Sciences] [Google Scholar]
- Cohen, M., Walker, R. G., Carter, B., et al., 1999, AJ, 117, 1864 [NASA ADS] [CrossRef] [Google Scholar]
- Ďurech, J., Delbo, M., & Carry, B. 2012, Proc. Conf. on Asteroids, Comets, Meteors, LPI Contributions, 1667, 6118 [NASA ADS] [Google Scholar]
- Egusa, F., Usui, F., Murata, K., et al. 2016, PASJ, 68, 19 [NASA ADS] [CrossRef] [Google Scholar]
- Fazio, G. G., Hora, J. L., Allen, L. E., et al. 2004, ApJS, 154, 10 [NASA ADS] [CrossRef] [Google Scholar]
- Greiner, J., Bornemann, W., Clemens, C., et al. 2008, PASP, 120, 405 [NASA ADS] [CrossRef] [Google Scholar]
- Gundlach, B., & Blum, J. 2013, Icarus, 223, 479 [NASA ADS] [CrossRef] [Google Scholar]
- Hasegawa, S., Müller, T. G., Kawakami, K., et al. 2008, PASJ, 60, 399 [Google Scholar]
- Hora, J. L., Carey, S., Surace, J., et al. 2008, PASP, 120, 1233 [NASA ADS] [CrossRef] [Google Scholar]
- Ishiguro, M., Kuroda, D., Hasegawa, S., et al. 2014, ApJ, 792, 74 [NASA ADS] [CrossRef] [Google Scholar]
- Kaasalainen, M. 2011, Inverse Problems and Imaging, 5, 37 [CrossRef] [Google Scholar]
- Kaasalainen, M., & Torppa, J. 2001, Icarus, 153, 24 [NASA ADS] [CrossRef] [Google Scholar]
- Kaasalainen, M., Torppa, J., & Muinonen, K. 2001, Icarus, 153, 37 [NASA ADS] [CrossRef] [Google Scholar]
- Kiss, C., Müller, T. G., Vilenius, E., et al. 2014, Exp. Astron., 37, 161 [NASA ADS] [CrossRef] [Google Scholar]
- Krühler, T., Küpcü, Y. A., Greiner, J., et al. 2008, ApJ, 685, 376 [NASA ADS] [CrossRef] [Google Scholar]
- Lagerros, J. S. V. 1996, A&A, 310, 1011 [NASA ADS] [Google Scholar]
- Lagerros, J. S. V. 1997, A&A, 325, 1226 [NASA ADS] [Google Scholar]
- Lagerros, J. S. V. 1998, A&A, 332, 1123 [NASA ADS] [Google Scholar]
- Lazzaro, D., Barucci, M. A., Perna, D., et al. 2013, A&A, 549, L2 [NASA ADS] [CrossRef] [EDP Sciences] [Google Scholar]
- Moskovitz, N. A., Abe, S., Pan, K.-S., et al. 2013, Icarus, 224, 24 [NASA ADS] [CrossRef] [Google Scholar]
- Müller, T. G. 2002, Met. Planet. Sci, 37, 1919 [Google Scholar]
- Müller, T. G., & Lagerros, J. S. V. 1998, A&A, 338, 340 [NASA ADS] [Google Scholar]
- Müller, T. G., Sterzik, M. F., Schütz, O., et al. 2004, A&A, 424, 1075 [NASA ADS] [CrossRef] [EDP Sciences] [Google Scholar]
- Müller, T. G., Sekiguchi, T., Kaasalainen, M., et al. 2005, A&A, 443, 347 [NASA ADS] [CrossRef] [EDP Sciences] [Google Scholar]
- Müller, T. G., Ďurech, J., Hasegawa, S., et al. 2011, A&A, 525, A145 [NASA ADS] [CrossRef] [EDP Sciences] [Google Scholar]
- Müller, T. G., O’Rourke, L., Barucci, A. M., et al. 2012, A&A, 548, A36 [NASA ADS] [CrossRef] [EDP Sciences] [Google Scholar]
- Müller, T. G., Hasegawa, S., & Usui, F. 2014, PASJ, 66, 52 [NASA ADS] [CrossRef] [Google Scholar]
- Mueller, M., Emery, J., Rivkin, A., et al. 2012, Spitzer Proposal ID #90145 [Google Scholar]
- Mueller, M., Emery, J., Rivkin, A., et al. 2013, AAS DPS Meeting #45, 304.01 [Google Scholar]
- Nolan, M. C., Magri, C., Howell, E. S., et al. 2013, Icarus, 226, 629 [Google Scholar]
- Opeil, C. P., Consolmagno, G. J., Britt, D. T. 2010, Icarus, 208, 449 [NASA ADS] [CrossRef] [Google Scholar]
- O’Rourke, L., Müller, T., Valtchanov, I., et al. 2012, Planet. Space Sci., 66, 192 [NASA ADS] [CrossRef] [EDP Sciences] [Google Scholar]
- O’Rourke, L., Müller, T., Altieri, B., et al. 2014, Asteroids, Comets, Meteors 2014. Proc. Conf. held 30 June–4 July, in Helsinki, Finland, eds. K. Muinonen, et al., 400 [Google Scholar]
- Pilbratt, G. L., Riedinger, J. R., Passvogel, T., et al. 2010, A&A, 518, L1 [CrossRef] [EDP Sciences] [Google Scholar]
- Pinilla-Alonso, N., Lorenzi, V., Campins, H., et al. 2013, A&A, 552, A79 [NASA ADS] [CrossRef] [EDP Sciences] [Google Scholar]
- Poglitsch, A., Waelkens, C., Geis, N., et al. 2010, A&A, 518, L2 [NASA ADS] [CrossRef] [EDP Sciences] [Google Scholar]
- Rozitis, B., & Green, S. F. 2011, MNRAS, 415, 2042 [NASA ADS] [CrossRef] [Google Scholar]
- Tanabe, T., Sakon, I., Cohen, M., et al. 2008, PASJ, 60, 375 [NASA ADS] [CrossRef] [Google Scholar]
- Trilling, D. E., Mueller, M., Hora, J. L., et al. 2010, AJ, 140, 770 [NASA ADS] [CrossRef] [Google Scholar]
- Werner, M., Roellig, T., Low, F., et al. 2004, ApJS, 154, 1 [Google Scholar]
- Yu, L.-L., Ji, J.-H, & Wang, S. 2014, Chin. Astron. Astrophys., 38, 317 [NASA ADS] [CrossRef] [Google Scholar]
Appendix A: Spitzer-IRAC point-and-shoot observations of 162173 (1999 JU3)
The Spitzer-IRAC point-and-shoot fluxes of Ryugu from Spitzer PID 90145 (PI: M. Mueller) are given in Table A.1.
All fluxes given below are absolutely calibrated in-band IRAC fluxes, the solar reflection is not subtracted, and the thermal flux component not colour-corrected. The times given are AOR start time as measured onboard Spitzer (UTC), that is, not corrected for light travel time between asteroid and spacecraft.
Spitzer-IRAC point-and-shoot observation of 162173 Ryugu from January to May 2013.
Appendix B: Spitzer-IRAC lightcurve observations of 162173 Ryugu
The Spitzer-IRAC lightcurve fluxes of Ryugu from Spitzer PID 90145 (PI: M. Mueller) are given in Tables B.1−B.4.
All fluxes given below are absolutely calibrated in-band IRAC fluxes, the solar reflection is not subtracted and the thermal flux component is not colour corrected. The times given are AOR start time as measured onboard Spitzer (UTC), that is, not corrected for light travel time between asteroid and spacecraft.
Spitzer-IRAC lightcurve observation of 162173 Ryugu from 10/11th February, 2013, channel 1.
Spitzer-IRAC lightcurve observation of 162173 Ryugu from 10/11th February, 2013, channel 2.
Spitzer-IRAC lightcurve observation of 162173 Ryugu from 2nd May, 2013, channel 1.
Spitzer-IRAC lightcurve observation of 162173 Ryugu from 2nd May, 2013, channel 2.
Appendix C: Ground-based observations of 162173 Ryugu with GROND
The GROND data are explained in Sect. 3. The reduced and calibrated data are presented in Tables C.1 and C.2.
GROND r′ magnitudes and errors of 162173 Ryugu.
GROND g′, r′, i′ magnitudes and errors of 162173 Ryugu.
Appendix D: Additional tables
Subaru-COMICS colour-corrected flux densities FD at reference wavelength λc of 162173 Ryugu after our new reduction and calibration scheme (including 5% error for the absolute flux calibration).
Spitzer/IRAC “Map PC” 3.6 μm and 4.5 μm observations of 162173 Ryugu as part of the Spitzer Proposal ID #90145.
GROND data set of observations 162173 Ryugu.
All Tables
Herschel PACS observations of 162173 Ryugu as part of the GT1_lorourke programme executed on operational day OD 1057 under the observation identifier OBSID 1342243716 & 1342243717.
AKARI-IRC observations of 162173 Ryugu: the colour-corrected flux densities FD at reference wavelengths λc, together with the observational error (σ) and the absolute flux error (σabs).
Spitzer-IRAC point-and-shoot observation of 162173 Ryugu from January to May 2013.
Spitzer-IRAC lightcurve observation of 162173 Ryugu from 10/11th February, 2013, channel 1.
Spitzer-IRAC lightcurve observation of 162173 Ryugu from 10/11th February, 2013, channel 2.
Spitzer-IRAC lightcurve observation of 162173 Ryugu from 2nd May, 2013, channel 1.
Spitzer-IRAC lightcurve observation of 162173 Ryugu from 2nd May, 2013, channel 2.
Subaru-COMICS colour-corrected flux densities FD at reference wavelength λc of 162173 Ryugu after our new reduction and calibration scheme (including 5% error for the absolute flux calibration).
Spitzer/IRAC “Map PC” 3.6 μm and 4.5 μm observations of 162173 Ryugu as part of the Spitzer Proposal ID #90145.
All Figures
|
Fig. 1 χ2 test for the complete set of spin-vector orientations and the full range of thermal inertias. Values close to 1.0 indicate acceptable solutions. Top: reduced χ2 values as a function of thermal inertia. Bottom: 1σ- (dark grey), 2σ- (intermediate grey), and 3σ- (light grey) χ2 values as a function of spin-axis ecliptic longitude and latitude in aitoff projection. The (λ; β) ecliptic coordinates of all tested orientations are shown as diamonds. |
| In the text | |
|
Fig. 2 Comparison between model flux ratios and the observed Spitzer-IRAC flux ratio of 3.6 ± 0.2 in the (λ; β)-space. The grey zones indicate spin-axis orientations which can reproduce the observed flux ratio on a 1σ (dark-grey), 2σ (intermediate-grey), and 3σ (light-grey) level. |
| In the text | |
|
Fig. 3 Calculated flux ratios for the two IRAC epochs on 2nd May and 10/11th Feb., 2013, as a function of the minimum χ2 values from Fig. 1. The observed IRAC flux ratio of 3.6 ± 0.2 (and the 3σ level) is indicated by vertical lines and the acceptance level from the analysis of the thermal data set is given by the dashed horizontal line. |
| In the text | |
|
Fig. 4 The colour map of the goodness of fit for the lightcurves, thermal data and combined data for all possible orientations of the spin axis given in ecliptic coordinates (λ,β). The top panel shows the rms residuals between the model and observed lightcurves, the middle plot shows the reduced χ2 for the thermal data and the bottom plot shows the total χ2 (Eq. (1)). |
| In the text | |
|
Fig. 5 The colour map of the ratio I3/Iz for models corresponding to all possible orientations of the spin axis given in ecliptic coordinates (λ,β). The white contour corresponds to the level 1.1. |
| In the text | |
|
Fig. 6 The colour map of the thermal inertia Γ for models corresponding to all possible orientations of the spin axis given in ecliptic coordinates (λ,β). The white contour corresponds to Γ = 150 J m-2 s-0.5 K-1. |
| In the text | |
|
Fig. 7 The intersection between the total χ2 colour maps (Fig. 4) for three possible rotation periods and the conditions I3/Iz < 1.1 and Γ > 150 J m-2 s-0.5 K-1. |
| In the text | |
|
Fig. 8 The formally best-fit shape model of Ryugu for pole direction (340°,−40°). |
| In the text | |
|
Fig. 9 Comparison between the model (red curves) and the data (points) for a subset of visual lightcurves. The viewing and illumination geometry for the corresponding pole (340°,−40°) is given by the latitude of sub-Earth point θ, latitude of the subsolar point θ0, and the solar phase angle α. |
| In the text | |
|
Fig. 10 Test of the Campins et al. (2009) solutions against our large thermal data set. Top left: observation-to-TPM flux ratios as a function of phase angle; top right: as a function of wavelength; bottom: same as top, but now calculated for the lower thermal inertia limit of 150 J m-2 s-0.5 K-1 and the extreme case of an equatorial retrograde geometry (at the time of IRS observations and as seen from Spitzer). |
| In the text | |
|
Fig. 11 Reduced χ2 values as a function of thermal inertia for all 11 shape and spin-pole solutions. True shape solutions are shown as solid lines, spherical shapes as dashed lines. Acceptable solutions should have reduced χ2 values close to 1. |
| In the text | |
|
Fig. 12 All thermal observations divided by the corresponding TPM prediction based on solution #2 in Table 5 as a function of phase angle (top), and as a function of wavelengths (bottom). No trend in observation-to-model flux ratios is visible over the very wide phase angle range from −89° to + 53°, nor over the wide range of wavelengths from 3.55 to 70 μm. The rebinned IRS data are shown as triangles together with the absolute flux error of each individual data point. |
| In the text | |
|
Fig. 13 Absolutely calibrated Spitzer-IRAC point-and-shoot fluxes at 3.550 and 4.493 μm taken between 20th Jan., and 30th May, 2013 (phase angles go from –71.6° to –88.9° and back to –54.5° during that period. The absolute TPM predictions (#2 in Table 5) for both channels are shown as dashed lines. |
| In the text | |
|
Fig. 14 Absolutely calibrated Spitzer-IRS spectrum from 2nd May, 2008 (see Campins et al. 2009), rebinned data are shown as triangles, the full data set as dots. The absolute TPM prediction (#2 in Table 5) is shown as a dashed line. |
| In the text | |
|
Fig. 15 Absolutely calibrated Spitzer-IRAC lightcurves in both channels from 10/11th Feb., 2013 (phase angle: –83.6°, aspect angle: 137.8°; top), and from 2nd May, 2013 (phase angle: –85.0°, aspect angle: 129.5°; bottom). The absolute TPM predictions (#2 in Table 5) are shown as dashed lines. |
| In the text | |
|
Fig. 16 Ryugu as seen from Earth on 1st July, 2018, close to the arrival time of the Hayabusa-2 mission at the asteroid (r = 0.988 AU, Δ = 1.903 AU, α = 18.6°), calculated using our reference shape, spin (#2 in Table 5), size, thermal solution, with the z-axis pointing in the direction of the spin axis (along the insolation/temperature colour bars). Top: solar insolation in W/m2, with the sub-solar point located at the peak insolation. Bottom: the TPM-calculated temperatures (in Kelvin). |
| In the text | |
Current usage metrics show cumulative count of Article Views (full-text article views including HTML views, PDF and ePub downloads, according to the available data) and Abstracts Views on Vision4Press platform.
Data correspond to usage on the plateform after 2015. The current usage metrics is available 48-96 hours after online publication and is updated daily on week days.
Initial download of the metrics may take a while.