Fig. 3
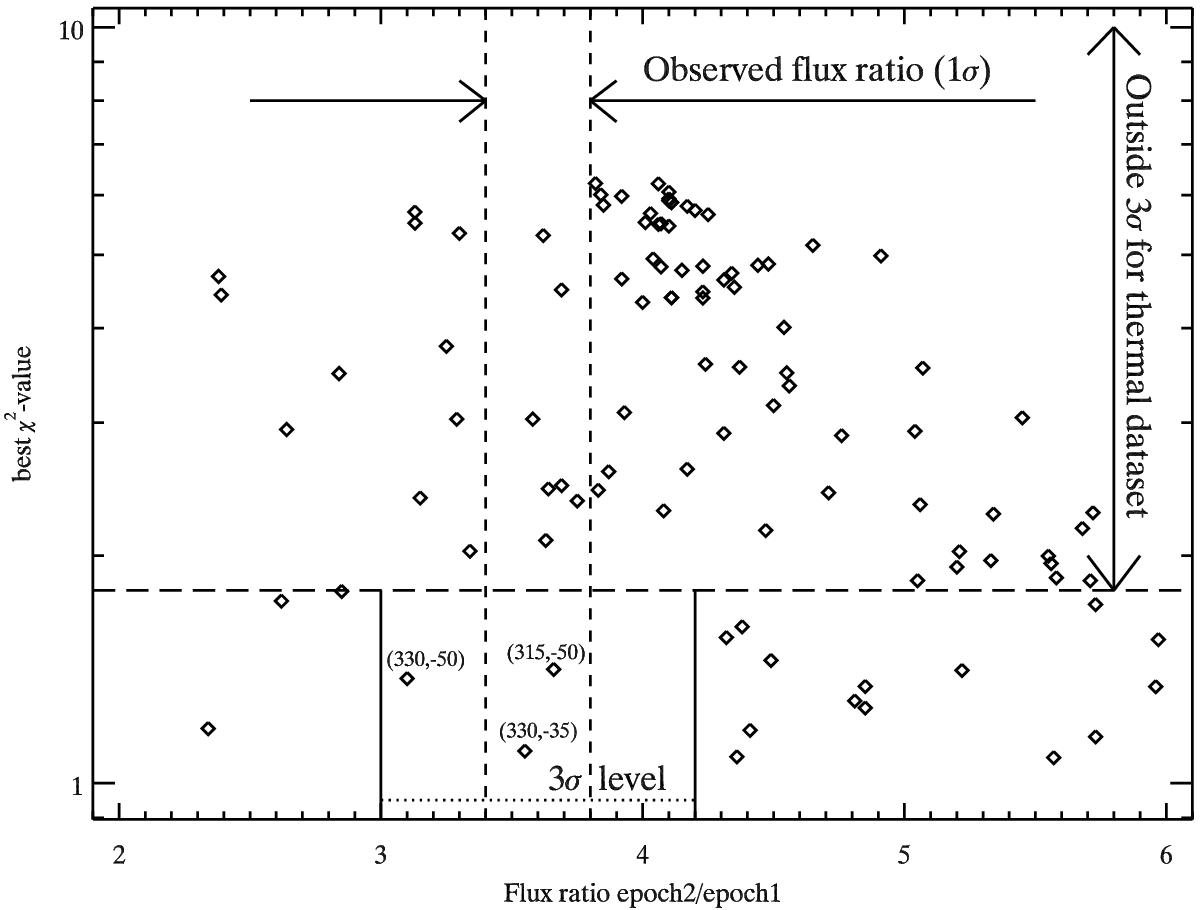
Calculated flux ratios for the two IRAC epochs on 2nd May and 10/11th Feb., 2013, as a function of the minimum χ2 values from Fig. 1. The observed IRAC flux ratio of 3.6 ± 0.2 (and the 3σ level) is indicated by vertical lines and the acceptance level from the analysis of the thermal data set is given by the dashed horizontal line.
Current usage metrics show cumulative count of Article Views (full-text article views including HTML views, PDF and ePub downloads, according to the available data) and Abstracts Views on Vision4Press platform.
Data correspond to usage on the plateform after 2015. The current usage metrics is available 48-96 hours after online publication and is updated daily on week days.
Initial download of the metrics may take a while.