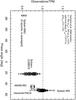
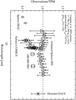
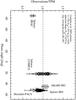
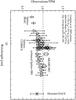
Fig. 10

Test of the Campins et al. (2009) solutions against our large thermal data set. Top left: observation-to-TPM flux ratios as a function of phase angle; top right: as a function of wavelength; bottom: same as top, but now calculated for the lower thermal inertia limit of 150 J m-2 s-0.5 K-1 and the extreme case of an equatorial retrograde geometry (at the time of IRS observations and as seen from Spitzer).
Current usage metrics show cumulative count of Article Views (full-text article views including HTML views, PDF and ePub downloads, according to the available data) and Abstracts Views on Vision4Press platform.
Data correspond to usage on the plateform after 2015. The current usage metrics is available 48-96 hours after online publication and is updated daily on week days.
Initial download of the metrics may take a while.