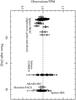
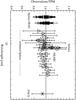
Fig. 12
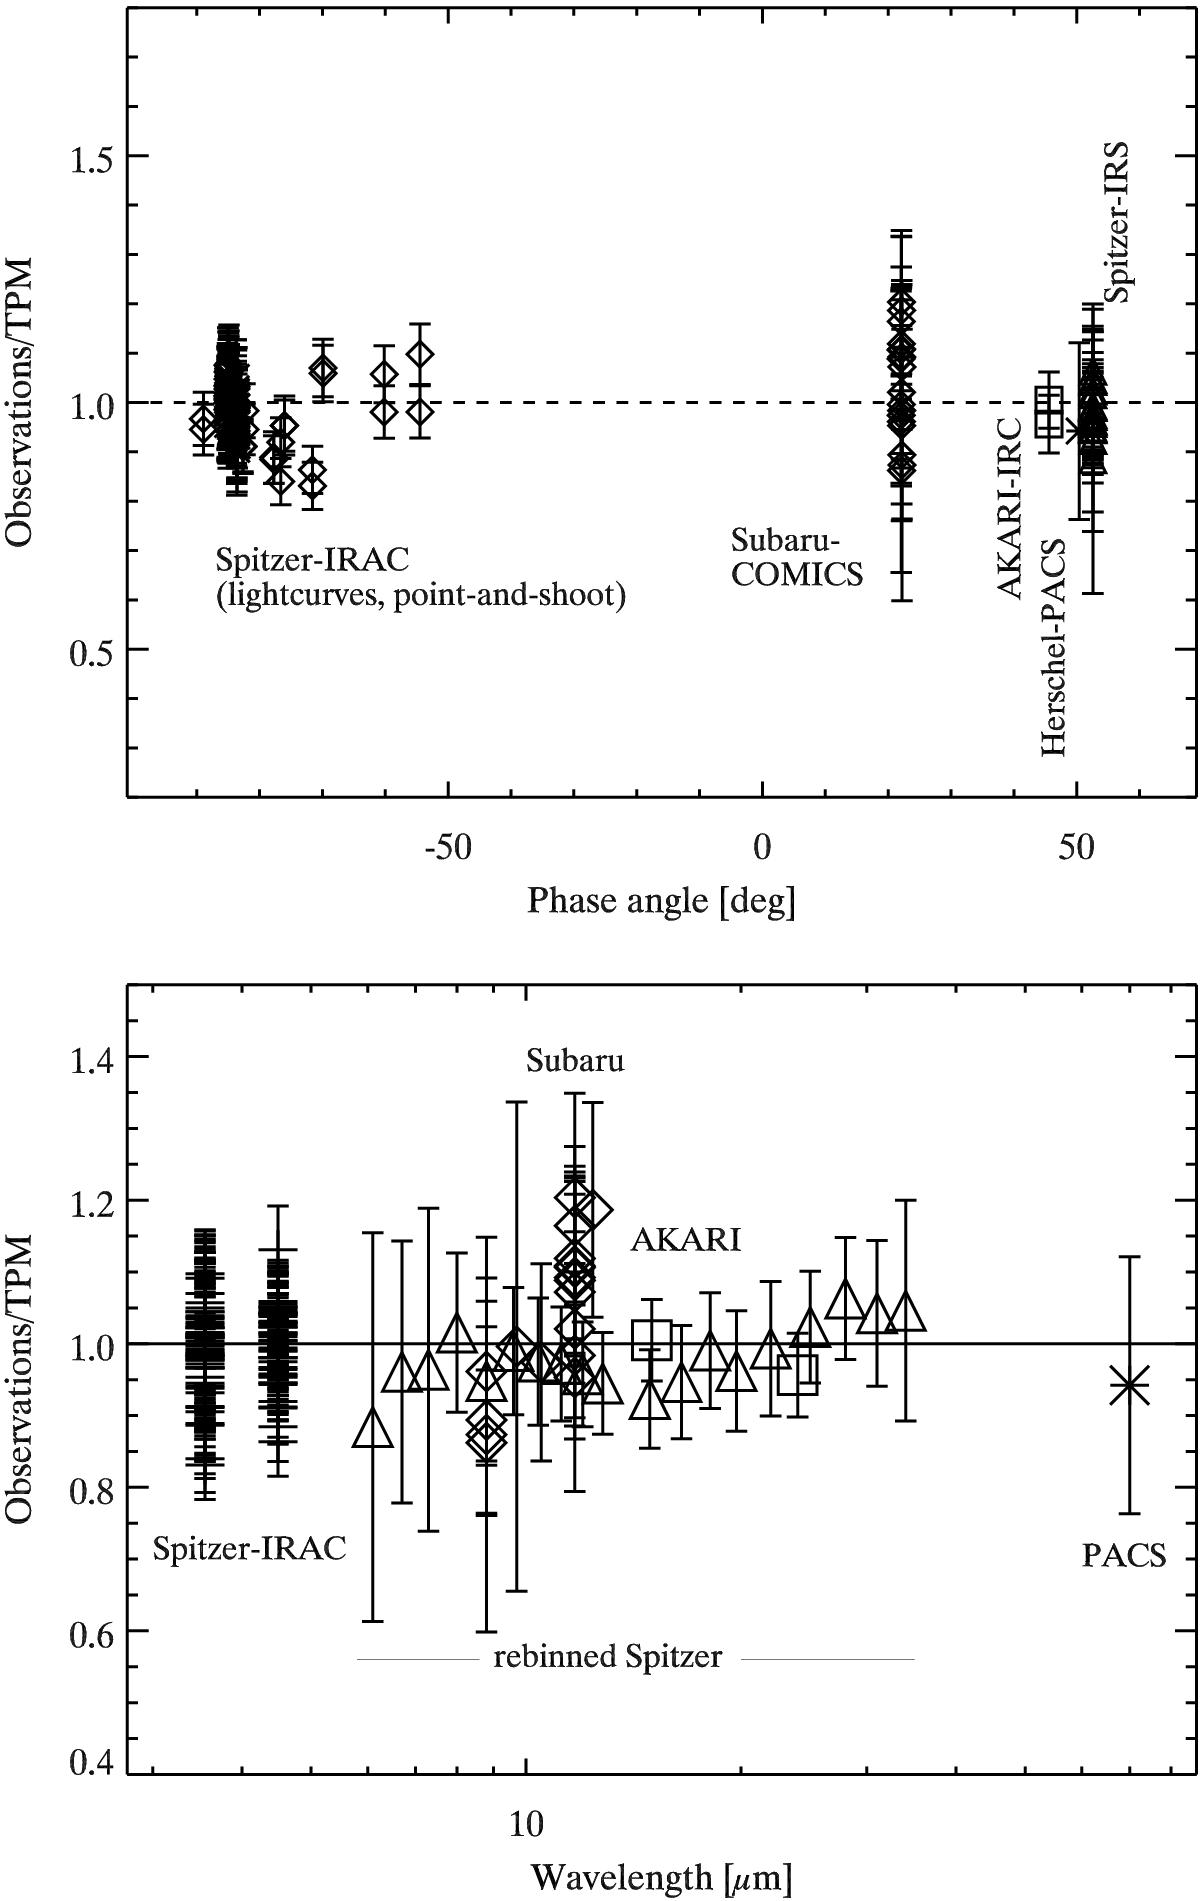
All thermal observations divided by the corresponding TPM prediction based on solution #2 in Table 5 as a function of phase angle (top), and as a function of wavelengths (bottom). No trend in observation-to-model flux ratios is visible over the very wide phase angle range from −89° to + 53°, nor over the wide range of wavelengths from 3.55 to 70 μm. The rebinned IRS data are shown as triangles together with the absolute flux error of each individual data point.
Current usage metrics show cumulative count of Article Views (full-text article views including HTML views, PDF and ePub downloads, according to the available data) and Abstracts Views on Vision4Press platform.
Data correspond to usage on the plateform after 2015. The current usage metrics is available 48-96 hours after online publication and is updated daily on week days.
Initial download of the metrics may take a while.