| Issue |
A&A
Volume 597, January 2017
|
|
|---|---|---|
| Article Number | A33 | |
| Number of page(s) | 25 | |
| Section | Stellar atmospheres | |
| DOI | https://doi.org/10.1051/0004-6361/201322526 | |
| Published online | 19 December 2016 | |
Chemical tagging of the Ursa Major moving group
A northern selection of FGK stars⋆,⋆⋆
1 Dpto. Astrofísica, Facultad de CC. Físicas, Universidad Complutense de Madrid, 28040 Madrid, Spain
e-mail: This email address is being protected from spambots. You need JavaScript enabled to view it.
2 Instituto de Astrofísica de Canarias, 38205 La Laguna, Tenerife, Spain
3 Universidad de La Laguna, Dept. Astrofísica, 38206 La Laguna, Tenerife, Spain
4 Thüringer Landessternwarte Tautenburg, Sternwarte 5, 07778 Tautenburg, Germany
5 Max-Planck-Institut für Sonnensystemforschung, Justus-von-Liebig-Weg 3, 37077 Göttingen, Germany
Received: 22 August 2013
Accepted: 4 September 2014
Abstract
Context. Stellar kinematic groups are kinematically coherent groups of stars that might have a common origin. These groups spread through the Galaxy over time owing to tidal effects caused by Galactic rotation and disk heating. However, the chemical information survives these processes.
Aims. The information provided by analysis of chemical elements can reveal the origin of these kinematic groups. Here we investigate the origin of the stars that belong to the Ursa Major (UMa) moving group (MG).
Methods. We present high-resolution spectroscopic observations obtained from three different spectrographs of kinematically selected FGK stars of the Ursa Major moving group. Stellar atmospheric parameters (Teff, log g, ξ, and [Fe/H]) were determined using our own automatic code (StePar), which makes use of the sensitivity of iron equivalent widths (EWs) measured in the spectra. We critically compared the StePar results with other methods (Teff values derived using the infrared flux method (IRFM) and log g values based on Hipparcos parallaxes). We derived the chemical abundances of 20 elements and their [X/Fe] ratios for all stars in the sample. We performed a differential abundance analysis with respect to a reference star of the UMa MG (HD 115043). We also carried out a systematic comparison of the abundance pattern of the Ursa Major MG and the Hyades SC with the thin disk stellar abundances.
Results. Our chemical tagging analysis indicates that the Ursa Major MG is less affected by field star contamination than other moving groups (such as the Hyades SC). We find a roughly solar iron composition [Fe/H] = 0.03 ± 0.07 dex for the finally selected stars, whereas the [X/Fe] ratios are roughly subsolar except for super-solar Barium abundance.
Conclusions. We conclude that 29 out of 44 (i.e., 66%) candidate stars have similar chemical compositions. In addition, we find that the abundance pattern of the Ursa Major MG might be marginally different from that of the Hyades SC.
Key words: open clusters and associations: individual: Ursa Major moving group / stars: fundamental parameters / stars: abundances / stars: kinematics and dynamics / stars: late-type
Based on observations obtained with the HERMES spectrograph at the Observatorio del Roque de los Muchachos (La Palma), the FOCES spectrograph at Calar Alto, and with the Coudé-Échelle spectrograph of the Alfred-Jensch-Teleskop at the Thüringer Landessternwarte Tautenburg.
The reduced spectra (FITS files) are only available at the CDS via anonymous ftp to cdsarc.u-strasbg.fr (130.79.128.5) or via http://cdsarc.u-strasbg.fr/viz-bin/qcat?J/A+A/597/A33
© ESO, 2016
1. Introduction
Stellar kinematic groups (SKGs) – superclusters (SCs) and moving groups (MGs) – are groups of kinematically-related stars (Eggen 1994) that might have a common origin. Among them, the youngest SKGs are (see Montes et al. 2001a) the Hyades SC (600 Myr), the Ursa Major MG (Sirius SC, 300 Myr), the Local Association or Pleiades MG (20 to 150 Myr), the IC 2391 SC (35–55 Myr), and the Castor MG (200 Myr).
Ever since Olin Eggen introduced the concept of MGs and because stars can maintain a kinematic signature over long periods of time, their existence (mainly in the case of the old MGs) has been disputed. The disruption of MGs is caused by the Galactic differential rotation. Furthermore, disk heating causes the velocity dispersion of disk stars to increase gradually with age (Wielen 1971).
The overdensity of stars in some regions of the Galactic velocity UV plane may be the result of global dynamical mechanisms linked with the non-axisymmetry of the Galaxy (Famaey et al. 2005), namely the presence of a rotating central bar (e.g., Dehnen 1998; Fux 2001; Minchev et al. 2010) and spiral arms (e.g., Quillen & Minchev 2005; Antoja et al. 2009, 2011), or both (see Quillen 2003; Minchev & Famaey 2010).
Previous works show that different age subgroups are located in the same region of the velocity plane as the classical MGs (Asiain et al. 1999), suggesting that both field stars and young coeval subgroups can coexist in MGs (Famaey et al. 2007, 2008; Antoja et al. 2008; Klement et al. 2008; De Silva et al. 2008; Francis & Anderson 2009a,b; Zhao et al. 2009).
When using different age indicators (e.g., the lithium line Li i at 6707.8 Å, chromospheric activity), it is possible to quantify the contamination by younger or older field stars among late-type candidate members of a SKG (e.g., Montes et al. 2001b; Martínez-Arnáiz et al. 2010; López-Santiago et al. 2006, 2009; López-Santiago et al. 2010; Maldonado et al. 2010).
However, the detailed analysis of the chemical content (chemical tagging) is another powerful and complementary approach that provides clear constraints on the membership (Freeman & Bland-Hawthorn 2002; Mitschang et al. 2013). Unfortunately, chemical composition alone cannot provide the answers to the common origin unless previous information is available beforehand (i.e., information on kinematics). Regarding this approach, studies usually start from already known information (see Mitschang et al. 2013, and references therein), in order to fully exploit the chemical tagging approach.
Studies of open clusters such as the Hyades and Collinder 261 (Paulson et al. 2003; De Silva et al. 2006, 2007a, 2009) have found high levels of chemical homogeneity, showing that chemical information is preserved within the stars and that the possible effects of any external sources of pollution are negligible. Since chemical homogeneity is found among open clusters, it is possible to trace back dispersed clusters based on their chemical composition. In this sense chemical tagging was applied to the HR 1614 (De Silva et al. 2007b), to the Hercules stream (Bensby et al. 2007), Wolf 360 MG (Bubar & King 2010), and to the Hyades SC (Pompéia et al. 2011; De Silva et al. 2011; Tabernero et al. 2012). These studies proved or disproved the common origin of these structures by using chemical abundance information. In particular, the Hyades SC is an interesting case. This MG is supposed to originate in the Hyades cluster and was an excellent test, since there is a whole cluster for choosing a reference star for the differential analysis. Tabernero et al. (2012) found that 46% of Hyades SC members share abundances similar to the original Hyades cluster. Pompéia et al. (2011) and De Silva et al. (2011) found that 10–15% of the stars seem to originate in the Hyades cluster. These differences arise from the different sizes of the samples employed, ~60 stars were analysed in Tabernero et al. (2012), whereas in Pompéia et al. (2011) and De Silva et al. (2011) analyse ~20 stars. The comparison of these three studies shows that it is not possible to constrain the contamination level in moving groups until more complete samples have been analysed. However, it would be still possible to find stars that may originate in a single cluster using the chemical tagging approach. The Hyades SC is not a unique case, since De Silva et al. (2013) linked the open cluster IC 2391 and the Argus association using chemical analysis.
In this paper, we apply the chemical tagging technique to a homogeneous sample of kinematically selected northern FGK Ursa Major MG candidates. This group has been prev- iously investigated by Soderblom & Mayor (1993), King et al. (2003), King & Schuler (2005), Monier (2005), Ammler-von Eiff & Guenther (2009), Biazzo et al. (2012), and D’Orazi et al. (2012). These studies demonstrate that their candidate members are consistent with a true MG of marginally subsolar composition. Soderblom & Mayor (1993) find [Fe/H] = −0.08 ± 0.09 dex, whereas Ammler-von Eiff & Guenther (2009) get a slightly higher value [Fe/H] = −0.03 ± 0.05 dex. Finally, Biazzo et al. (2012) obtain [Fe/H] = 0.01 ± 0.03, which is higher but consistent with previous measurements within the uncertainties. The study of individual abundances in Ammler-von Eiff & Guenther (2009) covers Fe and Mg. Biazzo et al. (2012) analysed 11 different chemical elements, whereas D’Orazi et al. (2012) also treat some s-process elements.
More importantly, the age of the Ursa Major MG is close to the time scale for the dissolution of open clusters (Wielen 1971). Therefore, this is an important case for studying some aspects of the open cluster evolution and applying the chemical tagging approach. In Sect. 2, we give details on the sample selection. Observations and data reduction are described in Sect. 3. Descriptions of the derivation of the stellar parameters and chemical abundances are provided in Sect. 4. Chemical abundances are given in Sect. 5, together with the discussion of the results. Finally in Sect. 6, we summarize our conclusions about UMa MG membership extracted from the chemical tagging approach.
2. Sample selection
The sample analysed in this paper (see Table A.10) was selected using kinematical criteria based on U, V, and W Galactic velocities of a given target being approximately within 10 km s-1 of the mean velocity of the Ursa Major nucleus (King et al. 2003). We selected our kinematic candidates from Ammler-von Eiff & Guenther (2009), Holmberg et al. (2009), López-Santiago et al. (2010), Martínez-Arnáiz et al. (2010), and Maldonado et al. (2010). This candidate selection was later verified once more with the radial velocities coming from the spectroscopic data presented here (see Sect. 3).
After the first stage of selection based on kinematical criteria, we then discarded those stars that were unsuitable for our standard abundance analysis, namely stars cooler than K4 and hotter than F6, because for these stars we would have been unable to measure the spectral lines required for our particular abundance analysis. Stars with high rotational velocities (namely those greater than 15 km s-1) were also discarded. In addition, we also removed spectroscopic binaries (SB2) to avoid confusion between the spectral lines of the two components during the analysis. After these considerations, we were left with 45 stars suitable for the present analysis.
We recalculated the Galactic velocities of our selected targets by employing the radial velocities and uncertainties derived by the HERMES spectrograph automated pipeline (Raskin et al. 2011). However, for stars observed with the FOCES and TLS spectrographs, we applied the cross-correlation technique using the routine fxcor in IRAF1, by adopting a solar spectrum as radial velocity template (the Kurucz solar ATLAS Kurucz et al. 1984). Those radial velocities were derived after applying the heliocentric correction to the observed velocity. Uncertainties were computed by FXCOR based on the fitted peak height and the antisymmetric noise, as described in Tonry & Davis (1979). The obtained radial velocities and their associated errors are given in Table A.10. Proper motions and parallaxes were taken from the Hipparcos and Tycho catalogues (ESA 1997), the Tycho-2 catalog (Høg et al. 2000), and the new reduction of the Hipparcos catalog (van Leeuwen 2007).
Following the method described in Montes et al. (2001a), we determine the U, V, and W velocities. The Galactic velocities are in a right-handed coordinate system (positive in the directions of the Galactic centre, Galactic rotation, and the north Galactic pole, respectively). Montes et al. (2001a) modified the procedures in Johnson & Soderblom (1987) to perform the velocity calculation and associated errors.
This modified program uses coordinates adapted to the epoch J2000 in the International Celestial Reference System (ICRS). The calculated velocities are given in Table A.10. As some stars are observed with two or more spectrographs, we decided to run an internal consistency check to verify whether significant differences exist for different spectrographs. We find there is a small scatter of about 0.14 km s-1. For these stars, final values of U, V, and W velocities were derived from the weighted average of their radial velocities, since the parallaxes and proper motion data are the same (see Table A.10).
3. Observations
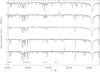 |
Fig. 1 High-resolution spectra for some representative stars from our sample (from top to bottom): HD 4048 (F8 V), HD 13829 (F8 V), HD 115043 (a G2 V reference star known to be a member of the Ursa Major nucleus), HD 76218 (G5 V), and HD 56168 (K0 V). Some lines used in the abundance analysis are highlighted in the bottom part of the diagram. |
Spectroscopic observations (see Fig. 1) were obtained at the 1.2-m Mercator Telescope2 at the Observatorio del Roque de los Muchachos (La Palma, Spain) in 2011–2012 with HERMES (High Efficiency and Resolution Mercator Echelle Spectrograph, Raskin et al. 2011) with the high-resolution mode. Additional spectra were taken in 2002 and 2004 with the 2.2-m telescope of the Centro Astronómico Hispano Alemán (CAHA) at Calar Alto with FOCES (operated by the Max-Planck-Institut für Astronomie Heidelberg and the Instituto de Astrofísica de Andalucía, CSIC), and the Coudé-Echelle spectrograph at 2 m-the Alfred-Jensch-Teleskop at the Thüringer Landessternwarte in Tautenburg (TLS thereafter). Resolutions are 86 000 for HERMES, 40 000 for FOCES, and 67 000 for TLS. The wavelength range covered by the three spectrographs includes the range needed for our purposes: λ3600 Å to λ9000 Å approximately for HERMES and FOCES, λ4700 Å to λ7400 Å for TLS.
The typical signal-to-noise ratio (S/N) of the analysed spectra is approximately 150 in the V band (at λ6070 Å). We analysed single main-sequence stars (from F6 to K4), which are 45 candidates in total. Among them, there are 27 HERMES, 13 FOCES, and 17 TLS spectra (ten of them are observed with more than one spectrograph). Our observations also include the reference star used in the differential abundance analysis (with respect to HD 115043). We also took three solar spectra, one of the asteroid Vesta with HERMES, and two Moon spectra with FOCES and TLS.
The HERMES echelle spectra were reduced with the automatic pipeline (Raskin et al. 2011) at the Mercator Telescope. Additionally, the FOCES and TLS data comprise spectroscopic observations presented in Ammler-von Eiff & Guenther (2009). The IDL – based FOCES EDRS data reduction suite was adapted by Klaus Fuhrmann for use with the Tautenburg Coudé-Echelle spectrograph. The common steps of data reduction were followed (Horne 1986; McLean 1997) including bias subtraction, scattered light removal, order extraction, wavelength calibration using ThAr exposures, and division by flat-field exposures.
We later used several IRAF tasks to transform the observed spectra into a unique one-dimensional spectrum and applied the Doppler correction required to account for the radial velocity. In case several exposures were taken for the same star, we combined all of the individual spectra to obtain a unique spectrum at higher S/N.
4. Spectroscopic analysis
4.1. Stellar parameters
Stellar atmospheric parameters (Teff, log g, ξ, and [Fe/H]) were computed using the automatic code StePar (Tabernero et al. 2012). This automatic code employs a 2002 version of the MOOG code (Sneden 1973) and a grid of Kurucz ATLAS9 plane-parallel model atmospheres (Kurucz 1993). As damping prescription, we used the Uns ld approximation multiplied by a factor recommended by the Blackwell group (option 2 within MOOG). As line list we employed 300 Fe i-Fe ii lines from Sousa et al. (2008). A typical star in our sample has 230−250 measurable Fe i and 20–25 Fe ii lines. The StePar code iterates within the parameter space until the slopes of χ versus (vs.) log ϵ(Fe i) and log (EW/λ) vs. log ϵ(Fe i) are zero (excitation equilibrium). In addition, it imposes the ionization equilibrium, such that log ϵ(Fe i) = log ϵ(Fe ii). We also imposed that the [Fe/H] average of the MOOG output is equal to the metallicity of the atmospheric model. Tolerance values for these conditions are needed, thus reasonable limits must be defined. In StePar, we have chosen to iterate until the absolute value of the slope χ vs. log ϵ(Fe i) was ≤ 0.001 dex eV-1, whereas the absolute value of the slope of log (EW/λ) vs. log ϵ(Fe i) was ≤0.002. For the ionization balance we chose | log ϵ(Fe i)–log ϵ(Fe ii) |≤ 0.005.
StePar employs a downhill simplex method (Press et al. 1992), and the problem function to minimize is a quadratic form composed of the excitation and ionization equilibrium conditions. Thus, StePar convergence toward the best solution in the stellar parameter space takes only a few minutes. We tested that the obtained solution for a given star is independent of the initial set of parameters employed. We therefore used the canonical solar values as initial input values (Teff = 5777 K, log g = 4.44 dex, ξ = 1 km s-1). In addition, we performed a 3σ rejection of the deviant Fe i and Fe ii lines after a first determination of the stellar parameters. Therefore, we reran the StePar program again without the rejected lines.
The EW determination of Fe lines was carried out with the ARES3 code (Sousa et al. 2007). We followed the approach of Sousa et al. (2008) to adjust the rejt parameter of ARES according to the S/N of each spectrum – the rejt parameter allows ARES to determine the stellar pseudocontinuum to fit the aimed EWs. The other ARES parameters we employed are smoother = 4 (the recommended parameter for smoothing the derivatives used for line identification), space = 3 (the wavelength interval (in Å) from each side of the central line to perform the EW computation), lineresol = 0.07 (the minimum distance for ARES to resolve lines), and miniline = 2 (minimum EW that will be printed in the ARES output). Details regarding the ARES parameters can be found in Sousa et al. (2007). In addition, ARES is able to automatically measure weak Gaussian lines giving negligible systematic differences about 1−2 mÅ when compared against “manual” EW measurements (i.e., estimated with the IRAF splot task, see Sousa et al. 2007; Ghezzi et al. 2010).
The uncertainties on the stellar parameters were computed taking one or more error sources for uncertainty into account for each parameter that will be added quadratically. The uncertainty on ξ is obtained using the slope of log ϵ(Fe i) vs. log (EW/λ). The uncertainty on Teff is inferred by propagating two error sources added in quadrature: the slope log ϵ(Fe i) vs. χ and the variation introduced by the uncertainty of ξ.
We considered three error sources for log g: the standard deviation of Fe ii and the previous uncertainties on ξ and Teff. Finally, to determine the error in the Fe i,ii abundance, we propagated the previously derived uncertainty on each stellar parameter plus the standard deviation of the Fe i,ii abundances.
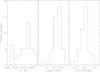 |
Fig. 2 Histograms for the determined values of Teff, log g, and [Fe/H] of the candidate stars. |
We have also performed the parameter determination of the solar spectra taken with the three different instruments. We are able to reproduce the solar parameters (see Table 1). Solar values for each chemical abundance, also given in Table 1, represent the zero-point for the solar abundance values. Ideally, abundance measurements in each solar reference spectrum should provide the same solar photospheric abundances for each spectrograph. However, small differences are noticed probably due to systematic effects, due to the different instrumental configurations, in the data taken with a specific instrument. These effects will likely apply to all candidate spectra of the UMa MG. Since our analysis is fully differential, the solar references are only used to convert the individual abundances (in a line-by-line basis) from log ϵ(X) to [X/H]. Thus, the obtained chemical abundances will be referred to a solar spectrum corresponding to the instrument in which they were taken.
The obtained stellar parameters Teff, log g, ξ, log ϵ(Fe i), log ϵ(Fe ii), and [Fe/H] (using our solar references) are given in Table A.11, together with the internal uncertainties in the stellar parameters. In Fig. 2, we show the histogram distributions of Teff, log g, and [Fe/H] values. The effective temperature ranges approximately from 4800 K to 6500 K. The surface gravities of all stars in the sample are those typical of main sequence stars.
We also verify that systematic errors of the stellar parameters are small when we use different spectrographs for the same object. We find that differences between Teff are less than 100 K, with a dispersion of 30 K. log g and [Fe/H] show differences of less than 0.15 and 0.05 dex respectively. The dispersion is approximately 0.05 dex for surface gravity and 0.02 for [Fe/H]. These differences are quite small and they do not represent any significant difference when we derive stellar parameters from spectra taken with different echelle spectrographs. For these repeated spectra we employed an error-weighted average for their final stellar parameters. Then, the uncertainties are given as the mean value of the individual ones.
Stellar parameters for our solar spectra (Moon and Vesta).
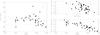 |
Fig. 3 Left panel: comparison plot of TIRFM–Teff vs. Teff. Right panel: comparison plots of log gHip–log gspec vs. log gspec (top right), and log gHip–log gspec vs. Teff (bottom right). In all panels, dashed-dotted lines represent the mean difference value and the standard deviation. Dashed-lines represent the ordinary least squares fit through the points. |
4.2. IRFM based effective temperatures
We have applied the infrared flux method (hereafter IRFM; Blackwell et al. 1990, and references therein) to the stellar sample presented in this work to also determine IRFM based effective temperatures, TIRFM, as in González Hernández & Bonifacio (2009). We collected Johnson V photometric data from the General Catalogue of Photometric Data (GCPD Mermilliod et al. 1997). We also use the Johnson V photometric data of Hipparcos-selected nearby stars from Koen et al. (2010). The TIRFM and its uncertainty (ΔTIRFM) were derived as the weighted average of the three individual temperatures and uncertainties derived from J, H, and K. For some stars of the sample we use the Tycho V magnitudes from the Tycho-2 catalogue (Høg et al. 2000), transformed into Johnson V using the expression given in Mamajek et al. (2002).
We also collected 2MASS infrared JHKS photometry (Skrutskie et al. 2006) for the stars of the stellar sample. The extinction in each photometric band, Ai, is derived using the relation Ai = RiE(B−V), where Ri is given by the coefficients provided in McCall (2004). Reddening corrections, E(B−V), were estimated from the dust maps of Schlegel et al. (1998), and corrected using the expressions given in Bonifacio et al. (2000a,b). Parallaxes are the same as those used in Sect. 2.
The photometric data and TIRFM values are given in Table A.1. The stars γ Lep A/B and ξ Boo are perhaps too bright for 2MASS and thus the error on JHKS magnitudes is too large to provide an accurate determination of TIRFM. In addition, we estimated TIRFM values assuming E(B−V) = 0 for comparison, TIRFM,0, although the effect is typically well within the uncertainties of TIRFM. In Fig. 3 we compare the TIRFM values with the spectroscopic Teff values. We found a mean difference, alongside its standard deviation, of TIRFM–Teff = −67 ± 84 K. The average error bar on TIRFM is ~76 K. These differences may be slightly correlated with our Teff, especially for the hottest stars of Teff above 6000 K, a problem that has been addressed in several studies (see Sousa et al. 2008; Ammler-von Eiff et al. 2009; Ammler-von Eiff & Guenther 2009; Mortier et al. 2013; Tsantaki et al. 2013), but it seems to be inherent to the differences between the IRFM method and the iron EW approach. We verify that the correlation between TIRFM–Teff and Teff is not significant. We find a correlation coefficient of r = −0.21 ± 0.15 (illustrated by an ordinary least squares fit in Fig. 3). The goodness of fit is represented by the determination coefficient (given by r2 = 0.04 ± 0.06). We also performed a t-test to assess the significance of the correlation coefficient (40 degrees of freedom). Thus, with a significance of 95%, we find that the correlation is not significant for our spectroscopic Teff. Also, the overall offset and scatter is small enough, possibly indicating that the TIRFM is really similar to our spectroscopic Teff. Thus, we decided to adopt the spectroscopic Teff for our abundance analysis.
4.3. HIPPARCOS-based gravities
We derived Hipparcos gravities based on the obtained spectroscopic Teff for the stellar sample in this study. This alternative gravity derivation requires the Johnson V photometric data discussed in Sect. 4.2, as well as the parallaxes discussed in Sect. 2. We use the web interface4 of the PARSEC5 isochrones (see Bressan et al. 2012) to derive the Hipparcos surface gravity (as in Sousa et al. 2008). The web interface only requires Teff, VJohnson, [Fe/H], and the parallax, as well as their uncertainties to compute the desired Hipparcos surface gravities.
The photometric data and Hipparcos gravity values are given in Table A.1. In Fig. 3 we compare the log gspec values with the spectroscopic log gHip values and find a mean difference of log gHip–log gspec = −0.07 ± 0.13 dex. We find a correlation coefficient, for log gHip vs. log gspec, r = −0.49 ± 0.15 (r2 = 0.24 ± 0.21). To assess the significance of this correlation value we performed a t-test. As in Sect. 4.2 we used a confidence level of 95% and 43 degrees of freedom. On the other hand for, log gHip vs. Tspec, the correlation coefficient results in r = −0.74 ± 0.07 (r2 = 0.55 ± 0.10). In both cases the correlation seems to be significant, with a 95% confidence level, as shown in the right hand panels of Fig. 3. Since the correlation is significant in the case of surface gravities, the effect on the chemical abundances must be considered (we refer the reader to the next section for further detail).
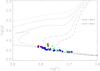 |
Fig. 4 Spectroscopic log Teff vs. log gHip for the candidate stars. We have employed the Yonsei-Yale isochrones (Demarque et al. 2004) for Z = 0.0 and age = 0.1, 0.3, 0.5, 1, 4, and 13 Gyr (from left to right). Mean error bars are represented in the middle right. Blue squares represent stars selected as members by the chemical tagging approach; red diamonds represent those stars that have similar Fe abundances, but different values of other elements. The orange circle represents the reference star HD 115043. Inverted green triangles represent those stars that do not have similar Fe abundances (as well as dissimilar values of other elements). For the membership criterion we refer the reader to Sect. 5. |
On average, the stars tend to show lower log gHip than log gspec. The spectroscopic methodology we employ to derive surface gravities gives reliable Teff estimates, but it is rather inefficient at estimating the surface gravity (see Sousa et al. 2008; Tsantaki et al. 2013; Mortier et al. 2013). For the cooler stars, the EWs of the Fe ii get weaker as Teff drops. The hottest stars may also pose a problem in this sense, possibly because of the arising difficulty measuring the EW of the Fe ii lines, thus losing sensitivity to surface gravity as these lines get weaker and less reliable with increasing temperatures (see bottom panel in Fig. 3).
As a complementary stellar parameter test, we created a log gHip−log Teff in Fig. 4. The selected stars fit within the depicted isochrones, because they are consistent with the isochrone for 0.3 Gyr (for a Ursa Major age reference, see King et al. 2003).
4.4. Chemical abundances
The selection of the chemical elements in this study is the same as in Tabernero et al. (2012; see Table A.2), whose line list comes from a combination of atomic line data from González Hernández et al. (2010), Pompéia et al. (2011), and Sousa et al. (2008). A total of 20 elements were analysed: Fe, the α-elements (Mg, Si, Ca, and Ti), the Fe-peak elements (Cr, Mn, Co, and Ni), the odd-Z elements (Na, Al, Sc, and V), Cu, Zn, and the s-process elements (Y, Zr, Ba, Ce, and Nd), see Tables A.3 and A.4. Chemical abundances were calculated using the EW method. The EWs were determined using the ARES code (Sousa et al. 2007), following the approach described in Sect. 4.1.
Once the EWs are measured, the analysis is carried out with the LTE MOOG code (2002 version, see Sneden 1973) using the ATLAS model corresponding to the derived atmospheric parameters. We determine chemical abundances (see Tables A.3 and A.4) relative to solar values using the spectrum of the asteroid Vesta and two lunar spectra acting as solar reference for each instrument. We compute the mean of the line-by-line differences of each chemical element and candidate star with respect to our solar references (one for each spectrograph, see Table 1 for the solar reference elemental abundances). However, to avoid incorrect EW measurements (e.g., caused by a wrong continuum placement), we rejected those lines separated by more than a factor of two of the standard deviation (σ) from the median differential abundance derived for each line. Finally, in case of stars observed with two or three spectrographs, we simply took the average value of the available results. We compared the solar abundances obtained with different instruments, and the differences seem to be very small (0.10 dex or better) for the majority of the elements treated in this study (see Table 1).
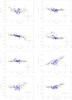 |
Fig. 5 [X/Fe] vs. [Fe/H] for the α-elements (Mg, Si, Ca, and Ti), and the Fe-peak elements (Cr, Mn, Co, and Ni): open diamonds represent the thin-disk data (González Hernández et al. 2010, 2013); red diamonds are our stars compatible to within 1 rms with the Fe abundance but not for all elements; blue squares are the candidates selected to become members of the Ursa Major MG. Inverted green triangles show incompatible stars. The reference star, HD 115043, known to be a member of the Ursa Major nucleus, is marked with an orange circle. Also, representative error bars are displayed in each graph. |
The differential abundances were also determined to establish the membership of each stellar candidate using the star HD 115043 as reference (see Tables A.5 and A.6). The internal uncertainties of the derived stellar parameters (using StePar, see Sect. 4.1) are 28 K for Teff, 0.07 dex for log g, 0.05 km s-1 for ξ, and 0.03 dex for [Fe/H]. These average errors are in fact quite small, reflecting the relative internal precision of the obtained parameters. However, using these average values to assess the error bar on element abundance would be too optimistic. We found that systematic errors for Teff and log g are 67 K and 0.07 dex, respectively (see Sects. 4.2 and 4.3). Combining these systematic errors with our internal uncertainties, we obtained a total uncertainty of 72 K for Teff and 0.10 dex for log g.
For stars at Teff> 6000 K, these combined uncertainties can rise to 115 K and 0.27 dex. Therefore, to work with more conservative and reliable uncertainties, we used the values given by Neves et al. (2009), i.e.: ΔTeff=± 100 K, Δlog g=± 0.30 dex, Δξ= 0.50 km s-1, and Δ[Fe/H] =± 0.30 dex. Using these uncertainties we derived the abundance sensitivities to changes in the stellar atmospheric parameters (see Tables A.7 and A.9). Then, we combined the sensitivities to give an estimation of the error bar for [X/H] and [X/Fe]. The final errors are usually driven by Teff. However, some are dominated by ξ (e.g., for Ba) or by log g (e.g., for Ce and Nd).
We performed a careful evaluation of the impact of systematic errors on stellar atmospheric parameters derived with StePar. From Sects. 4.2 and 4.3 the parameter most severly affected appears to be surface gravity. Thus, one might wonder whether its spectroscopic derivation may have an effect on the derived abundances. Therefore, we computed the differential abundances again (with respect to HD 115043) with the Hipparcos surface gravities to verify possible differences. We find small differences at about hundredths of dex. For example, Ba and Ni remain nearly unaltered (with mean differences of 0.00 ± 0.02 and 0.01 ± 0.01dex), whereas for Ca and Ce we find variations of −0.01 ± 0.03 dex and 0.02 ± 0.05 dex, respectively. As an additional check for systematic deviations, we compared two stars in common with Biazzo et al. (2012) and D’Orazi et al. (2012; γ Lep A/B). Their abundances differ from ours by up to 0.11 dex in the worst case (i.e., for [Al/Fe]). In the best case, i.e., for [Ni/Fe], they differ only by 0.01 dex. The above differences are similar to those due to the internal scatter (typically 0.01–0.10 dex). Finally, to be consistent with the previous study from Tabernero et al. (2012), we decided to use the stellar atmospheric parameters coming from StePar.
5. Discussion
We now compare our derived element abundances with those of thin-disk stars (González Hernández et al. 2010, 2013) to determine whether our values follow Galactic trends. We will also verify the chemical homogeneity of the Ursa Major MG and check that some of the stars indeed have homogeneous abundances of all the considered elements.
5.1. Element abundances
The element abundances were determined in a fully differential way by comparing them with those derived for a solar spectrum (as stated in Sect. 4.1). The choice of elements is taken from Tabernero et al. (2012, see also Table A.2), as explained in Sect. 4.4.
In the case of the α-elements (see Fig. 5) Si and Ca seem to follow the Galactic trends (see Bensby et al. 2005; Reddy et al. 2006; González Hernández et al. 2010, 2013). Mg is slightly subsolar for stars around solar metallicity. Ti seems to follow the trends, but the scatter tends to increase as [Fe/H] decreases for this narrow metallicity range. It has been suggested that Ti may suffer from NLTE effects, especially for cool stars. Therefore, to check this issue further, we have derived the difference log Ti ii–log Ti i. For the coolest stars (Teff ≤ 5500 K), we obtain log Ti ii–log Ti i = 0.14 ± 0.09. For the hottest stars (Teff ≥ 5500 K), we obtain 0.06 ± 0.06 dex. At 1σ level the difference is significant for the coolest stars (Teff ≤ 5500 K). Other studies have attributed that difference to Ti overionization (Lai et al. 2008; D’Orazi & Randich 2009; Biazzo et al. 2012; Adibekyan et al. 2012; De Silva et al. 2013); however, the total error bar for log Ti i is 0.21 dex (see Table A.7), maybe implying that the Ti abundance difference is not significant for the coolest stars, even if an observable offset is present. This difference may be connected to deviations either from excitation or ionization equilibrium (Adibekyan et al. 2012). Another possible explanation for the observed over-ionization could be an incorrect T–τ relationship in the adopted model atmospheres (Lai et al. 2008). Whereas this effect can be compensated for [Fe/H] by changing ξ, it does not necessarily apply to other elements (Adibekyan et al. 2012).
For the iron peak elements (Cr, Mn, Co, and Ni, see Fig. 5), we find a small scatter in Ni and Cr. We note that most of the stars lie below the Galactic trend and that Mn has a larger scatter. Ni, Mn, and Co show on average subsolar values.
For the odd-Z elements (Na, Al, Sc, and V, see Figs. A.1), Na and Al seem to be sub-solar in composition as it happens for some Fe-peak elements. A high dispersion is observed for Sc, however it seems compatible with the Galactic trend. We confirm a large dispersion for V, which some authors interpret as an NLTE effect (e.g., Bodaghee et al. 2003; Gilli et al. 2006; Neves et al. 2009) affecting mostly the coolest stars. Vanadium lines are indeed difficult to measure and may require very high S/N data.
Cu, Zn, and the s-process elements (Y, Zr, Ba, Ce, and Nd, see Figs. A.1) follow similar trends to those seen in solar analogs (González Hernández et al. 2010). We find some enhancement for Ba above the solar level as observed in open clusters and moving groups with ages below 1 Gyr. D’Orazi et al. (2009) and D’Orazi et al. (2012) show that for 0.3 Gyr (the Ursa Major attributed age, see King et al. 2003; Ammler-von Eiff & Guenther 2009), one might expect to find 0.2–0.3 dex for [Ba/Fe]. In our sample, we find similar values for a majority of Ursa Major MG stars (see Fig. A.1). The Ba overabundance is not reflected for Y, Zr, and Ce. Although the scatter is relatively large the average abundance values are not enhanced. Cu and Zn seem to be solar in spite of the high scatter found for these elements. Nd seems to be really high compared to the Galactic abundance pattern, although there are some stars following the Galactic trend. At solar metallicities, however, it rises to 0.2 dex. The higher-than-solar Nd abundance of many Ursa Major candidate stars does not endanger the subsequent differential analysis, since the reference star HD 115043 is also enhanced ([Nd/Fe] = 0.15 ± 0.03, see Table A.4).
Median differential abundances (with respect to HD 115043), and both initial and final rms values for all considered elements.
Percentage analysis based on the rejection level of the differential abundances (with respect to HD 115043).
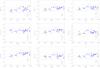 |
Fig. 6 Δ[X/H] differential abundances (with respect to HD 115043) for the α-elements (Mg, Si, Ca, and Ti), Fe, and the Fe-peak elements (Cr, Mn, Co, and Ni) vs. Teff. Dashed-dotted lines represent 1 rms over and below the median for our sample, whereas dotted lines represent the 1.5 rms level. Dashed lines represent the mean differential abundance. The meaning of the symbols is the same as in Fig. 5. |
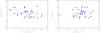 |
Fig. 7 U, V, and W recalculated velocities for the possible members of the Ursa Major MG. For a full explanation on the final selection criterion, we refer the reader to Sect. 5. The big black cross indicates the U, V, and W central location of the Ursa Major MG (see King et al. 2003). Dashed lines show the region where the majority of the young disk stars tend to be according to Eggen (1984, 1989). The meaning of the symbols is the same as in Fig. 5. |
5.2. Differential abundances with respect to HD 115043
We determine differential abundances Δ[X/H] by comparing our measured abundances with those of a reference star known to be a member of the Ursa Major nucleus (HD 115043, see King et al. 2003) on a line-by-line basis. The candidate selection within the sample was determined by applying a one root-mean-squared (rms, thereafter) rejection over the median for almost every chemical element studied. The rejection process considers the rms in the abundances of the sample for each element. At first, we discarded every star that deviates by more than 1 rms from the median abundance shown in Figs. 6 and A.2. The initial rms values considered during the candidate selection are given in Table 2.
The initial 1 rms rejections lead to the identification of 15 candidate members. We subsequently apply a more flexible criterion that allows stars to become members when their abundances were within the 1 rms interval for 90% of the elements considered and the remaining 10% within the 1.5 rms interval (i.e., 18 elements and 2 elements, respectively). The final rms refers to the selected candidates of the Ursa Major moving group. The error analysis considers only the standard deviation in the line-by-line differences. Using this flexible approach allows us to find 29 members that may share similar abundances among the whole sample containing 44 stars (i.e., a 66%).
This more flexible rms-based analysis was made in order to identify the degree at which the sample is homogeneous and to account for the likely contamination of the sample by field stars. Therefore, to assess this degree of homogeneity one must therefore take the number of stars that lie within 1 rms, 1.5 rms, 2 rms, and 3 rms intervals into account (see Table 3). The last three columns of Table A.11 give information about membership based on the differential abundances (with respect to HD 115043) of Fe and the other elements following these criteria. Combining the pure 1 rms rejection and the more flexible criteria, we find that from 34% to 66% of the candidates are members of UMa, for a pure 1 rms rejection and the flexible criterion, respectively. The rms of the final selection for different elements ranges about 0.1 dex to 0.05 dex. We find that Si, Ca, Cr, Fe, and Ce exhibit an internal dispersion equal or better than 0.08 dex. On the other hand, Na, Mg, Ti, Ni, Zn, Zr, and Nd display a disperssion of less than 0.1 dex. The remaining elements have an rms scatter around 0.1 dex (see Table 2). Interestingly, the present chemical analysis can eliminate some outliers in the space velocity diagram (see Fig. 7). In addition, our final set of selected candidates tends to concentrate nearby the mean velocity of the Ursa Major MG.
As a final test, we compared the Hyades SC abundances (Tabernero et al. 2012) and thin-disk (González Hernández et al. 2010) with those of UMa (see Fig. 8). For the thin-disk, each value is derived from the average of those stars within one σ around the [Fe/H] of each MG. It is interesting to check whether the two moving groups have different abundance patterns. Some of the 20 individual abundances seem to be marginally distinguishable, with a few noticeable exceptions, namely Ca, V, Y, Ba, and Zr. The other elements might behave differently for the two groups, the Ursa Major MG being less metallic (nearly solar) than the Hyades SC (supersolar composition).
Different abundance patterns can indicate a different formation site (Freeman & Bland-Hawthorn 2002). Therefore, it would be possible to distinguish different stars from different moving groups when using the chemical tagging approach. even though the abundances seem to be different from those of field stars, the internal dispersion does not give a clear hint of any palpable difference. We also note that a detailed treatment of several different elements is important for a good picture of the composition of moving groups. In conclusion, the two MGs might behave differently in the abundance space.
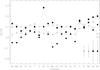 |
Fig. 8 Elemental abundances for the Hyades SC (filled diamonds, see Tabernero et al. 2012) and the Ursa Major MG (filled circles). Thin-disk abundance values for field solar analogs (González Hernández et al. 2010) are represented by open triangles (at Ursa Major MG [Fe/H]) and open squares (at the Hyades SC [Fe/H]). Right bottom error bars represent the standard deviation. Dotted lines simply join the points for each moving group. |
6. Conclusions
We have computed the stellar parameters and their uncertainties for 45 Ursa Major MG candidate stars and obtained their chemical abundances for 20 elements (Fe, Na, Mg, Al, Si, Ca, Ti, V, Cr, Mn, Co, Fe, Ni, Cu, Zn, Y, Zr, Ba, Ce, and Nd), using a fully differential abundance approach with solar spectra of Vesta and the Moon as solar references.
We derived the Galactic space velocity components for each star and use them to check the original selection based on Galactic velocities (Montes et al. 2001a; López-Santiago et al. 2010), which was then improved using the radial velocities derived from our data. We employed the new Hipparcos proper motions and parallaxes (Høg et al. 2000; van Leeuwen 2007) using the procedures described in Montes et al. (2001a). To perform a preliminary consistency check, we analysed the U, V, and W Galactic velocities (see Fig. 7) of the final selected stars to not include any outliers in V.
As a complementary test of the stellar parameters, we compiled a log g vs. log Teff diagram to verify the consistency of the method employed to determine the stellar parameters. This diagram shows that most of the stars fall on the isochrone for the Ursa Major attributed age (0.3 Gyr, see King et al. 2003; Ammler-von Eiff & Guenther 2009). This is an important but insufficient condition for ascertaing that they have a common origin. The differential abundance analysis (chemical tagging) shows that the finally 29 selected stars are compatible with the accepted age isochrone, as expected if they have evaporated from a single star-forming event. The membership percentage that we find in this work (66%) may indicate that the Ursa Major MG is likely to originate in a dispersing cluster. This result was also pointed out by other studies (such as King et al. 2003; King & Schuler 2005; Ammler-von Eiff & Guenther 2009, and references therein). Furthermore, we also verified that different moving groups (Hyades SC and Ursa Major) might be distinguished by the individual element abundances (see Fig. 8).
A still more detailed analysis of different age indicators and chemical homogeneity is in progress and will be presented in future publications. This analysis will lead to a more consistent means of confirming a list of candidate members from the abundance analysis.
IRAF is distributed by the National Optical Observatory, which is operated by the Association of Universities for Research in Astronomy, Inc., under contract with the National Science Foundation.
Supported by the Fund for Scientific Research of Flanders (FWO), Belgium, the Research Council of K.U. Leuven, Belgium, the Fonds National Recherches Scientific (FNRS), Belgium, the Royal Observatory of Belgium, the Observatoire de Genève, Switzerland, and the Thüringer Landessternwarte Tautenburg, Germany.
The ARES code can be downloaded at http://www.astro.up.pt/
Acknowledgments
H.M.T. and D.M. acknowledge financial support from the Universidad Complutense de Madrid (UCM), the Spanish Ministry of Economy and Competitiveness (MINECO) from pojects AYA2011-30147-C03-02, and The Comunidad de Madrid under PRICIT project S2009/ESP-1496 (AstroMadrid). H.M.T. also acknowledges the financial support of the Spanish Ministry of Economy and Competitiveness (MINECO) under grants BES-2009-012182 and EEBB-I-12-04038. J.I.G.H. acknowledges financial support from the Spanish Ministry project MINECO AYA2011-29060, and also from the Spanish Ministry of Economy and Competitiveness (MINECO) under the 2011 Severo Ochoa Program MINECO SEV-2011-0187. M.A. acknowledges help by Klaus Fuhrmann who adapted the FOCES reduction pipeline for use with the Tautenburg Coudé-Echelle spectrograph. In addition, M.A. thanks Eike W. Guenther for providing observing time with the 2 m telescope in Tautenburg. Furthermore, M.A. would like to thank the staff at the Calar Alto and Tautenburg observatories. M.A. is supported by DLR (Deutsches Zentrum für Luft-und Raumfahrt) under the project 50 OW 0204. We would like to thank the anonymous referee for helpful comments and corrections. This publication makes use of data products from the Two Micron All Sky Survey, which is a joint project of the University of Massachusetts and the Infrared Processing and Analysis Center/California Institute of Technology, funded by the National Aeronautics and Space Administration and the National Science Foundation. This research made use of the SIMBAD database, operated at the CDS, Strasbourg, France.
References
- Adibekyan, V. Z., Sousa, S. G., Santos, N. C., et al. 2012, A&A, 545, A32 [NASA ADS] [CrossRef] [EDP Sciences] [Google Scholar]
- Ammler-von Eiff, M., & Guenther, E. W. 2009, A&A, 508, 677 [NASA ADS] [CrossRef] [EDP Sciences] [Google Scholar]
- Ammler-von Eiff, M., Santos, N. C., Sousa, S. G., et al. 2009, A&A, 507, 523 [NASA ADS] [CrossRef] [EDP Sciences] [Google Scholar]
- Antoja, T., Figueras, F., Fernández, D., & Torra, J. 2008, A&A, 490, 135 [NASA ADS] [CrossRef] [EDP Sciences] [Google Scholar]
- Antoja, T., Valenzuela, O., Pichardo, B., et al. 2009, ApJ, 700, L78 [NASA ADS] [CrossRef] [Google Scholar]
- Antoja, T., Figueras, F., Romero-Gómez, M., et al. 2011, MNRAS, 418, 1423 [NASA ADS] [CrossRef] [Google Scholar]
- Asiain, R., Figueras, F., Torra, J., & Chen, B. 1999, A&A, 341, 427 [NASA ADS] [Google Scholar]
- Bensby, T., Feltzing, S., Lundström, I., & Ilyin, I. 2005, A&A, 433, 185 [NASA ADS] [CrossRef] [EDP Sciences] [Google Scholar]
- Bensby, T., Oey, M. S., Feltzing, S., & Gustafsson, B. 2007, ApJ, 655, L89 [NASA ADS] [CrossRef] [Google Scholar]
- Biazzo, K., D’Orazi, V., Desidera, S., et al. 2012, MNRAS, 427, 2905 [NASA ADS] [CrossRef] [Google Scholar]
- Blackwell, D. E., Petford, A. D., Arribas, S., Haddock, D. J., & Selby, M. J. 1990, A&A, 232, 396 [NASA ADS] [Google Scholar]
- Bodaghee, A., Santos, N. C., Israelian, G., & Mayor, M. 2003, A&A, 404, 715 [NASA ADS] [CrossRef] [EDP Sciences] [Google Scholar]
- Bonifacio, P., Caffau, E., & Molaro, P. 2000a, A&AS, 145, 473 [NASA ADS] [CrossRef] [EDP Sciences] [Google Scholar]
- Bonifacio, P., Monai, S., & Beers, T. C. 2000b, AJ, 120, 2065 [NASA ADS] [CrossRef] [Google Scholar]
- Bressan, A., Marigo, P., Girardi, L., et al. 2012, MNRAS, 427, 127 [NASA ADS] [CrossRef] [Google Scholar]
- Bubar, E. J., & King, J. R. 2010, AJ, 140, 293 [NASA ADS] [CrossRef] [Google Scholar]
- Dehnen, W. 1998, AJ, 115, 2384 [NASA ADS] [CrossRef] [Google Scholar]
- Demarque, P., Woo, J.-H., Kim, Y.-C., & Yi, S. K. 2004, ApJS, 155, 667 [NASA ADS] [CrossRef] [Google Scholar]
- De Silva, G. M., Sneden, C., Paulson, D. B., et al. 2006, AJ, 131, 455 [NASA ADS] [CrossRef] [Google Scholar]
- De Silva, G. M., Freeman, K. C., Asplund, M., et al. 2007a, AJ, 133, 1161 [NASA ADS] [CrossRef] [Google Scholar]
- De Silva, G. M., Freeman, K. C., Bland-Hawthorn, J., Asplund, M., & Bessell, M. S. 2007b, AJ, 133, 694 [NASA ADS] [CrossRef] [Google Scholar]
- De Silva, G. M., Freeman, K. C., Bland-Hawthorn, J., & Asplund, M. 2008, ASP Conf. Ser. 396, eds., J. G. Funes, S. J., E. M. Corsini, [arXiv:0810.3346] [Google Scholar]
- De Silva, G. M., Freeman, K. C., & Bland-Hawthorn, J. 2009, PASA, 26, 11 [NASA ADS] [CrossRef] [Google Scholar]
- De Silva, G. M., Freeman, K. C., Bland-Hawthorn, J., et al. 2011, MNRAS, 415, 563 [NASA ADS] [CrossRef] [Google Scholar]
- De Silva, G. M., D’Orazi, V., Melo, C., et al. 2013, MNRAS, 431, 1005 [NASA ADS] [CrossRef] [Google Scholar]
- D’Orazi, V., & Randich, S. 2009, A&A, 501, 553 [NASA ADS] [CrossRef] [EDP Sciences] [Google Scholar]
- D’Orazi, V., Magrini, L., Randich, S., et al. 2009, ApJ, 693, L31 [NASA ADS] [CrossRef] [Google Scholar]
- D’Orazi, V., Biazzo, K., Desidera, S., et al. 2012, MNRAS, 423, 2789 [NASA ADS] [CrossRef] [Google Scholar]
- Eggen, O. J. 1984, ApJS, 55, 597 [NASA ADS] [CrossRef] [Google Scholar]
- Eggen, O. J. 1989, PASP, 101, 366 [NASA ADS] [CrossRef] [Google Scholar]
- Eggen, O. J. 1994, Galactic and Solar System Optical Astrometry, 191 [Google Scholar]
- ESA 1997, The Hipparcos and Tycho Catalogues, ESA SP, 1200 [Google Scholar]
- Famaey, B., Jorissen, A., Luri, X., et al. 2005, A&A, 430, 165 [NASA ADS] [CrossRef] [EDP Sciences] [Google Scholar]
- Famaey, B., Pont, F., Luri, X., et al. 2007, A&A, 461, 957 [NASA ADS] [CrossRef] [EDP Sciences] [Google Scholar]
- Famaey, B., Siebert, A., & Jorissen, A. 2008, A&A, 483, 453 [NASA ADS] [CrossRef] [EDP Sciences] [Google Scholar]
- Francis, C., & Anderson, E. 2009a, Proc. Roy. Soc. Lond. Astron., 465, 3425 [NASA ADS] [CrossRef] [Google Scholar]
- Francis, C., & Anderson, E. 2009b, New Astron., 14, 615 [NASA ADS] [CrossRef] [Google Scholar]
- Freeman, K., & Bland-Hawthorn, J. 2002, ARA&A, 40, 487 [NASA ADS] [CrossRef] [Google Scholar]
- Fux, R. 2001, A&A, 373, 511 [NASA ADS] [CrossRef] [EDP Sciences] [Google Scholar]
- Ghezzi, L., Cunha, K., Schuler, S. C., & Smith, V. V. 2010, ApJ, 725, 721 [NASA ADS] [CrossRef] [Google Scholar]
- Gilli, G., Israelian, G., Ecuvillon, A., Santos, N. C., & Mayor, M. 2006, A&A, 449, 723 [NASA ADS] [CrossRef] [EDP Sciences] [Google Scholar]
- González Hernández, J. I., & Bonifacio, P. 2009, A&A, 497, 497 [NASA ADS] [CrossRef] [EDP Sciences] [Google Scholar]
- González Hernández, J. I., Israelian, G., Santos, N. C., et al. 2010, ApJ, 720, 1592 [NASA ADS] [CrossRef] [Google Scholar]
- González Hernández, J. I., Delgado-Mena, E., Sousa, S. G., et al. 2013, A&A, 552, A6 [NASA ADS] [CrossRef] [EDP Sciences] [Google Scholar]
- Høg, E., Fabricius, C., Makarov, V. V., et al. 2000, A&A, 355, L27 [NASA ADS] [Google Scholar]
- Holmberg, J., Nordström, B., & Andersen, J. 2009, A&A, 501, 941 [NASA ADS] [CrossRef] [EDP Sciences] [Google Scholar]
- Horne, K. 1986, PASP, 98, 609 [NASA ADS] [CrossRef] [EDP Sciences] [Google Scholar]
- Johnson, D. R. H., & Soderblom, D. R. 1987, AJ, 93, 864 [NASA ADS] [CrossRef] [Google Scholar]
- King, J. R., & Schuler, S. C. 2005, PASP, 117, 911 [NASA ADS] [CrossRef] [Google Scholar]
- King, J. R., Villarreal, A. R., Soderblom, D. R., Gulliver, A. F., & Adelman, S. J. 2003, AJ, 125, 1980 [NASA ADS] [CrossRef] [Google Scholar]
- Klement, R., Fuchs, B., & Rix, H.-W. 2008, ApJ, 685, 261 [NASA ADS] [CrossRef] [Google Scholar]
- Koen, C., Kilkenny, D., van Wyk, F., & Marang, F. 2010, MNRAS, 403, 1949 [Google Scholar]
- Kurucz, R. L. 1993, ATLAS9 Stellar Atmosphere Programs and 2 km s-1 grid, Kurucz CD-ROM (Cambridge, Mass.: Smithsonian Astrophysical Observatory), 13 [Google Scholar]
- Kurucz, R. L., Furenlid, I., Brault, J., & Testerman, L. 1984, National Solar Observatory Atlas, Sunspot (New Mexico: National Solar Observatory) [Google Scholar]
- Lai, D. K., Bolte, M., Johnson, J. A., et al. 2008, ApJ, 681, 1524 [NASA ADS] [CrossRef] [Google Scholar]
- López-Santiago, J., Montes, D., Crespo-Chacón, I., & Fernández-Figueroa, M. J. 2006, ApJ, 643, 1160 [NASA ADS] [CrossRef] [Google Scholar]
- López-Santiago, J., Micela, G., & Montes, D. 2009, A&A, 499, 129 [NASA ADS] [CrossRef] [EDP Sciences] [Google Scholar]
- López-Santiago, J., Montes, D., Gálvez-Ortiz, M. C., et al. 2010, A&A, 514, A97 [NASA ADS] [CrossRef] [EDP Sciences] [Google Scholar]
- Maldonado, J., Martínez-Arnáiz, R. M., Eiroa, C., Montes, D., & Montesinos, B. 2010, A&A, 521, A12 [NASA ADS] [CrossRef] [EDP Sciences] [Google Scholar]
- Mamajek, E. E., Meyer, M. R., & Liebert, J. 2002, AJ, 124, 1670 [NASA ADS] [CrossRef] [Google Scholar]
- Martínez-Arnáiz, R., Maldonado, J., Montes, D., Eiroa, C., & Montesinos, B. 2010, A&A, 520, A79 [NASA ADS] [CrossRef] [EDP Sciences] [Google Scholar]
- McCall, M. L. 2004, AJ, 128, 2144 [NASA ADS] [CrossRef] [Google Scholar]
- McLean, I. S. 1997, Electronic imaging in astronomy, Detectors and instrumentation (Chichester, UK: Wiley) [Google Scholar]
- Mermilliod, J.-C., Mermilliod, M., & Hauck, B. 1997, A&AS, 124, 349 [NASA ADS] [CrossRef] [EDP Sciences] [Google Scholar]
- Minchev, I., & Famaey, B. 2010, ApJ, 722, 112 [NASA ADS] [CrossRef] [Google Scholar]
- Minchev, I., Boily, C., Siebert, A., & Bienayme, O. 2010, MNRAS, 407, 2122 [NASA ADS] [CrossRef] [MathSciNet] [Google Scholar]
- Mitschang, A. W., De Silva, G., Sharma, S., & Zucker, D. B. 2013, MNRAS, 428, 2321 [NASA ADS] [CrossRef] [Google Scholar]
- Montes, D., López-Santiago, J., Gálvez, M. C., et al. 2001a, MNRAS, 328, 45 [NASA ADS] [CrossRef] [MathSciNet] [Google Scholar]
- Montes, D., López-Santiago, J., Fernández-Figueroa, M. J., & Gálvez, M. C. 2001b, A&A, 379, 976 [NASA ADS] [CrossRef] [EDP Sciences] [Google Scholar]
- Monier, R. 2005, A&A, 442, 563 [NASA ADS] [CrossRef] [EDP Sciences] [Google Scholar]
- Mortier, A., Santos, N. C., Sousa, S. G., et al. 2013, A&A, 557, A70 [NASA ADS] [CrossRef] [EDP Sciences] [Google Scholar]
- Neves, V., Santos, N. C., Sousa, S. G., Correia, A. C. M., & Israelian, G. 2009, A&A, 497, 563 [NASA ADS] [CrossRef] [EDP Sciences] [Google Scholar]
- Paulson, D. B., Sneden, C., & Cochran, W. D. 2003, AJ, 125, 3185 [NASA ADS] [CrossRef] [Google Scholar]
- Pompéia, L., Masseron, T., Famaey, B., et al. 2011, MNRAS, 415, 1138 [NASA ADS] [CrossRef] [Google Scholar]
- Press, W. H., Teukolsky, S. A., Vetterling, W. T., & Flannery, B. P. 1992 (Cambridge: University Press), 2nd edn. [Google Scholar]
- Quillen, A. C. 2003, AJ, 125, 785 [Google Scholar]
- Quillen, A. C., & Minchev, I. 2005, AJ, 130, 576 [NASA ADS] [CrossRef] [Google Scholar]
- Raskin, G., van Winckel, H., Hensberge, H., et al. 2011, A&A, 526, A69 [NASA ADS] [CrossRef] [EDP Sciences] [Google Scholar]
- Reddy, B. E., Lambert, D. L., & Allen de Prieto, C. 2006, MNRAS, 367, 1329 [NASA ADS] [CrossRef] [Google Scholar]
- Schlegel, D. J., Finkbeiner, D. P., & Davis, M. 1998, ApJ, 500, 525 [NASA ADS] [CrossRef] [Google Scholar]
- Skrutskie, M. F., Cutri, R. M., Stiening, R., et al. 2006, AJ, 131, 1163 [NASA ADS] [CrossRef] [Google Scholar]
- Sneden, C. A. 1973, Ph.D. Thesis [Google Scholar]
- Soderblom, D. R., & Mayor, M. 1993, AJ, 105, 226 [NASA ADS] [CrossRef] [EDP Sciences] [Google Scholar]
- Sousa, S. G., Santos, N. C., Israelian, G., Mayor, M., & Monteiro, M. J. P. F. G. 2007, A&A, 469, 783 [NASA ADS] [CrossRef] [EDP Sciences] [Google Scholar]
- Sousa, S. G., Santos, N. C., Mayor, M., et al. 2008, A&A, 487, 373 [NASA ADS] [CrossRef] [EDP Sciences] [MathSciNet] [Google Scholar]
- Tabernero, H. M., Montes, D., & González Hernández, J. I. 2012, A&A, 547, A13 [NASA ADS] [CrossRef] [EDP Sciences] [Google Scholar]
- Tsantaki, M., Sousa, S. G., Adibekyan, V. Z., et al. 2013, A&A, 555, A150 [NASA ADS] [CrossRef] [EDP Sciences] [Google Scholar]
- Tonry, J., & Davis, M. 1979, AJ, 84, 1511 [NASA ADS] [CrossRef] [Google Scholar]
- van Leeuwen, F. 2007, A&A, 474, 653 [NASA ADS] [CrossRef] [EDP Sciences] [Google Scholar]
- Wielen, R. 1971, Ap&SS, 13, 300 [NASA ADS] [CrossRef] [Google Scholar]
- Williams, M. E. K., Freeman, K. C., Helmi, A., & the RAVE Collaboration 2009, IAU Symp., 254, 139 [Google Scholar]
- Zhao, J., Zhao, G., & Chen, Y. 2009, ApJ, 692, L113 [NASA ADS] [CrossRef] [Google Scholar]
Appendix A: Additional data
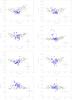 |
Fig. A.1 Same as Fig. 5 but for the odd-Z elements (Na, Al, Sc, and V), Cu, Zn, and the s-process elements (Y, Zr, Ba, Ce, and Nd). |
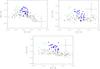 |
Fig. A.1 continued. |
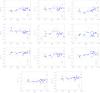 |
Fig. A.2 Same as Fig. 6 but for the odd-Z elements (Na, Al, Sc, and V), Cu, Zn, and the s-process elements (Y, Zr, Ba, Ce, and Nd). |
V magnitude, JHK 2MASS photometry, color excess, spectroscopic Teff, reddening-uncorrected TIRFM,0, reddening-corrected TIRFM, angular diameter θ, spectroscopic and Hipparcos log g, iron abundance [Fe/H], and bolometric flux for the sample stars.
Wavelength, elements, excitation potential, oscillator strengths for the spectral lines used in the present work.
[X/Fe] ratios for the α-, Fe-peak, and odd-Z elements: Na, Mg, Al, Si, Ca, Sc, Ti, V, Cr, Mn, Co, and Ni.
Differential abundances (Δ[X/H]) with respect to HD 115043 for the s-process elements: Cu, Zn, Y, Zr, Ba, Ce, and Nd.
Differential abundances (Δ[X/H]) with respect to HD 115043 for the α-, Fe-peak, and odd-Z elements: Na, Mg, Al, Si, Ca, Sc, Ti, V, Cr, Mn, Co, and Ni.
Differential abundances (Δ[X/H]) with respect to HD 115043 for the s-process elements: Cu, Zn, Y, Zr, Ba, Ce, and Nd.
Differential abundance average sensitivities for Fe, Na, Mg, Al, Si, Ca, Sc, Ti, V, Cr, Mn, Co, and Ni.
Differential abundance sensitivities for Cu, Zn, Y, Zr, Ba, Ce, and Nd.
Differential abundance average sensitivities for Cu, Zn, Y, Zr, Ba, Ce, and Nd.
Properties of the sample, including radial velocities and derived kinematics.
Stellar parameters for the whole sample, Fe differential abundance (Δ[Fe/H]), and the resulting membership based on the abundance homogeneity criterium.
All Tables
Median differential abundances (with respect to HD 115043), and both initial and final rms values for all considered elements.
Percentage analysis based on the rejection level of the differential abundances (with respect to HD 115043).
V magnitude, JHK 2MASS photometry, color excess, spectroscopic Teff, reddening-uncorrected TIRFM,0, reddening-corrected TIRFM, angular diameter θ, spectroscopic and Hipparcos log g, iron abundance [Fe/H], and bolometric flux for the sample stars.
Wavelength, elements, excitation potential, oscillator strengths for the spectral lines used in the present work.
[X/Fe] ratios for the α-, Fe-peak, and odd-Z elements: Na, Mg, Al, Si, Ca, Sc, Ti, V, Cr, Mn, Co, and Ni.
Differential abundances (Δ[X/H]) with respect to HD 115043 for the s-process elements: Cu, Zn, Y, Zr, Ba, Ce, and Nd.
Differential abundances (Δ[X/H]) with respect to HD 115043 for the α-, Fe-peak, and odd-Z elements: Na, Mg, Al, Si, Ca, Sc, Ti, V, Cr, Mn, Co, and Ni.
Differential abundances (Δ[X/H]) with respect to HD 115043 for the s-process elements: Cu, Zn, Y, Zr, Ba, Ce, and Nd.
Differential abundance average sensitivities for Fe, Na, Mg, Al, Si, Ca, Sc, Ti, V, Cr, Mn, Co, and Ni.
Differential abundance average sensitivities for Cu, Zn, Y, Zr, Ba, Ce, and Nd.
Stellar parameters for the whole sample, Fe differential abundance (Δ[Fe/H]), and the resulting membership based on the abundance homogeneity criterium.
All Figures
|
Fig. 1 High-resolution spectra for some representative stars from our sample (from top to bottom): HD 4048 (F8 V), HD 13829 (F8 V), HD 115043 (a G2 V reference star known to be a member of the Ursa Major nucleus), HD 76218 (G5 V), and HD 56168 (K0 V). Some lines used in the abundance analysis are highlighted in the bottom part of the diagram. |
| In the text | |
|
Fig. 2 Histograms for the determined values of Teff, log g, and [Fe/H] of the candidate stars. |
| In the text | |
|
Fig. 3 Left panel: comparison plot of TIRFM–Teff vs. Teff. Right panel: comparison plots of log gHip–log gspec vs. log gspec (top right), and log gHip–log gspec vs. Teff (bottom right). In all panels, dashed-dotted lines represent the mean difference value and the standard deviation. Dashed-lines represent the ordinary least squares fit through the points. |
| In the text | |
|
Fig. 4 Spectroscopic log Teff vs. log gHip for the candidate stars. We have employed the Yonsei-Yale isochrones (Demarque et al. 2004) for Z = 0.0 and age = 0.1, 0.3, 0.5, 1, 4, and 13 Gyr (from left to right). Mean error bars are represented in the middle right. Blue squares represent stars selected as members by the chemical tagging approach; red diamonds represent those stars that have similar Fe abundances, but different values of other elements. The orange circle represents the reference star HD 115043. Inverted green triangles represent those stars that do not have similar Fe abundances (as well as dissimilar values of other elements). For the membership criterion we refer the reader to Sect. 5. |
| In the text | |
|
Fig. 5 [X/Fe] vs. [Fe/H] for the α-elements (Mg, Si, Ca, and Ti), and the Fe-peak elements (Cr, Mn, Co, and Ni): open diamonds represent the thin-disk data (González Hernández et al. 2010, 2013); red diamonds are our stars compatible to within 1 rms with the Fe abundance but not for all elements; blue squares are the candidates selected to become members of the Ursa Major MG. Inverted green triangles show incompatible stars. The reference star, HD 115043, known to be a member of the Ursa Major nucleus, is marked with an orange circle. Also, representative error bars are displayed in each graph. |
| In the text | |
|
Fig. 6 Δ[X/H] differential abundances (with respect to HD 115043) for the α-elements (Mg, Si, Ca, and Ti), Fe, and the Fe-peak elements (Cr, Mn, Co, and Ni) vs. Teff. Dashed-dotted lines represent 1 rms over and below the median for our sample, whereas dotted lines represent the 1.5 rms level. Dashed lines represent the mean differential abundance. The meaning of the symbols is the same as in Fig. 5. |
| In the text | |
|
Fig. 7 U, V, and W recalculated velocities for the possible members of the Ursa Major MG. For a full explanation on the final selection criterion, we refer the reader to Sect. 5. The big black cross indicates the U, V, and W central location of the Ursa Major MG (see King et al. 2003). Dashed lines show the region where the majority of the young disk stars tend to be according to Eggen (1984, 1989). The meaning of the symbols is the same as in Fig. 5. |
| In the text | |
|
Fig. 8 Elemental abundances for the Hyades SC (filled diamonds, see Tabernero et al. 2012) and the Ursa Major MG (filled circles). Thin-disk abundance values for field solar analogs (González Hernández et al. 2010) are represented by open triangles (at Ursa Major MG [Fe/H]) and open squares (at the Hyades SC [Fe/H]). Right bottom error bars represent the standard deviation. Dotted lines simply join the points for each moving group. |
| In the text | |
|
Fig. A.1 Same as Fig. 5 but for the odd-Z elements (Na, Al, Sc, and V), Cu, Zn, and the s-process elements (Y, Zr, Ba, Ce, and Nd). |
| In the text | |
|
Fig. A.1 continued. |
| In the text | |
|
Fig. A.2 Same as Fig. 6 but for the odd-Z elements (Na, Al, Sc, and V), Cu, Zn, and the s-process elements (Y, Zr, Ba, Ce, and Nd). |
| In the text | |
Current usage metrics show cumulative count of Article Views (full-text article views including HTML views, PDF and ePub downloads, according to the available data) and Abstracts Views on Vision4Press platform.
Data correspond to usage on the plateform after 2015. The current usage metrics is available 48-96 hours after online publication and is updated daily on week days.
Initial download of the metrics may take a while.