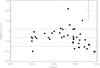
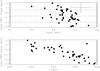
Fig. 3

Left panel: comparison plot of TIRFM–Teff vs. Teff. Right panel: comparison plots of log gHip–log gspec vs. log gspec (top right), and log gHip–log gspec vs. Teff (bottom right). In all panels, dashed-dotted lines represent the mean difference value and the standard deviation. Dashed-lines represent the ordinary least squares fit through the points.
Current usage metrics show cumulative count of Article Views (full-text article views including HTML views, PDF and ePub downloads, according to the available data) and Abstracts Views on Vision4Press platform.
Data correspond to usage on the plateform after 2015. The current usage metrics is available 48-96 hours after online publication and is updated daily on week days.
Initial download of the metrics may take a while.