| Issue |
A&A
Volume 595, November 2016
|
|
|---|---|---|
| Article Number | L2 | |
| Number of page(s) | 5 | |
| Section | Letters | |
| DOI | https://doi.org/10.1051/0004-6361/201629336 | |
| Published online | 24 October 2016 | |
Astrometry with MCAO: HST-GeMS proper motions in the globular cluster NGC 6681⋆
1 INAF–Osservatorio Astronomico di Bologna, via Ranzani 1, 40127 Bologna, Italy
e-mail: This email address is being protected from spambots. You need JavaScript enabled to view it.
2 University of Groningen, Kapteyn Astronomical Institute, 9747 AD Groningen, The Netherlands
3 Herzberg Astronomy and Astrophysics, National Research Council Canada, 5071 West Saanich Road, Victoria, BC V9E 2E7, Canada
4 Space Telescope Science Institute, 3700 San Martin Drive, Baltimore, MD 21218, USA
5 Department of Physics and Astronomy, University of Victoria, 3800 Finnerty Road, Victoria, BC V8P 5C2, Canada
6 Dipartimento di Fisica, Università di Roma Tor Vergata, via della Ricerca Scientifca 1, 00133 Roma, Italy
7 INAF–Osservatorio Astronomico di Roma, via Frascati 33, 00040 Monteporzio Catone, Italy
Received: 18 July 2016
Accepted: 19 September 2016
Abstract
Aims. For the first time the astrometric capabilities of the Gemini Multi-Conjugate Adaptive Optics System (GeMS) facility at the Gemini South Adaptive Optics Imager (GSAOI) camera on Gemini-South are tested to quantify the accuracy in determining stellar proper motions in the Galactic globular cluster NGC 6681.
Methods. Proper motions from the Hubble Space Telescope (HST) for a sample of its stars are already available, allowing us to construct a distortion-free reference at the epoch of GeMS observations that is used to measure and correct the temporally changing distortions for each GeMS exposure. In this way, we are able to compare the corrected GeMS images with a first-epoch of HST-Advanced Camera for Survey (ACS) images to recover the relative proper motion of the Sagittarius dwarf spheroidal galaxy with respect to NGC 6681.
Results. We find this to be (μαcosδ,μδ) = (4.09,−3.41)mas yr-1, which matches previous HST/ACS measurements with a very good accuracy of 0.03 mas yr-1 and with a comparable precision (rms of 0.43 mas yr-1).
Conclusions. This study successfully demonstrates that high-quality proper motions can be measured for relatively large fields of view (85′′× 85′′) with MCAO-assisted, ground-based cameras and provides a first, successful test of the performances of GeMS on multi-epoch data.
Key words: astrometry / proper motions / instrumentation: adaptive optics / globular clusters: individual: NGC 6681 / galaxies: individual: Sagittarius dSph
The final reduced data (FITS files) are only available at the CDS via anonymous ftp to cdsarc.u-strasbg.fr (130.79.128.5) or via http://cdsarc.u-strasbg.fr/viz-bin/qcat?J/A+A/595/L2
© ESO, 2016
1. Introduction
Proper motions (PMs) are an extremely powerful tool to investigate the kinematics and dynamics of stellar systems. However, since their size depends on the distance of the objects under study and on the temporal baseline between the observations, PMs can be very small and difficult to measure. For example an object moving at 100 km s-1 at a distance of 100 kpc, has a PM of only ~ 0.2mas yr-1. This is why the internal kinematics of stellar systems have only been studied for the closest of them, such as Galactic Globular Clusters (GCs). The most reliable examples available in literature (see e.g. McLaughlin et al. 2006; Anderson & van der Marel 2010; McNamara et al. 2012; Bellini et al. 2014; Watkins et al. 2015) exploit the exceptional astrometric performance of the Hubble Space Telescope (HST), whose diffraction-limited point spread function (PSF) and geometric distortions proved to be well determined and extremely stable over more than 20 yr of operations (e.g. Anderson 2007; Bellini et al. 2011).
Recently, diffraction limited observations have also been possible for ground-based telescopes and over relatively large fields of view (FoV), thanks to the Multi-Conjugate Adaptive Optics (MCAO) technique (Ragazzoni et al. 2000). This was first successfully tested on sky with the Multi-conjugate Adaptive optics Demonstrator (MAD, Marchetti et al. 2008) at the Very Large Telescope. Because of the size of the telescope, ground-based diffraction-limited observations provide higher spatial resolution than those coming from HST and the related astrometric measurements are thus potentially more precise. This will be especially true in the future, with the advent of Extremely Large Telescopes (ELTs), which will be larger by more than a factor of five than any future space telescope. In preparation for this future leap in telescope size available to ground-based astrometry, it is important to explore the technical requirements that will lead to the full exploitation of MCAO for PM measurements on an ELT.
Currently, the only operational MCAO facility is the Gemini Multi-Conjugate Adaptive Optics System (GeMS, Rigaut et al. 2014; Neichel et al. 2014b) mounted at the Gemini-South telescope. GeMS has been shown to be able to reach a good astrometric precision of ~ 0.2 mas for bright stars and exposure times exceeding one minute on single-epoch observations (Neichel et al. 2014a). However, GeMS performance on multi-epoch data, even if separated by only few hours, has turned out to be a more complicated matter. In general, several distortion effects contribute to move a star around on the detector of a MCAO-assisted camera (e.g. Trippe et al. 2010). One of the biggest problems is the time variablity of the distortions which makes their calibration and/or modelling complex. This explains why only one previous PM study of a GC exists using MCAO data (Ortolani et al. 2011, using MAD observations of the cluster HP1). Moreover, in the particular case of GeMS, the distortions have also an extra component that varies quickly, possibly due to gravity flexure or to the movement of the AO-bench (Neichel et al. 2014a; Lu et al. 2014; Ammons et al. 2014). This component makes the measurement of PMs with GeMS even more complex.
Here, we present the first multi-epoch astrometric study from our Gemini/GSAOI campaign targeting Galactic GCs using GeMS (Turri et al. 2014, 2015; Massari et al. 2016a). In this work, we present a method that is able to correct MCAO distortions by exploiting previously measured distortion-free stellar positions and PMs. This allows us to test the GeMS astrometric performance for the first time on PM measurements obtained from multi-epoch data separated by a few years. The initial test case that we present in this Letter is the GC NGC 6681, whose stars’ PMs have already been measured with HST by Massari et al. (2013; hereafter Ma13).
In Sect. 2 we describe in detail the data analysis and the method we used to model GeMS distortions. In Sect. 3 we verify our PMs for systematic errors and compare them to the previous HST measurements. Finally, we summarise our conclusions in Sect. 4.
2. Data analysis and camera distortions
When measuring stellar proper motions (PMs), it is fundamental to first disentangle the effect that distortions have on the observed positions of the stars.
The GeMS facility is an extremely powerful instrument to investigate the kinematical properties of GCs via PMs, since it provides diffraction-limited observations across a large field of view (FoV) of 85′′× 85′′ with a pixel scale of 0.02′′ pixel-1. However, GeMS suffers from distortions that vary significantly with time (Neichel et al. 2014a), due in part to variable seeing conditions and field-to-field differences in asterisms. This makes it difficult to determine a stable, generic distortion model using previous GeMS observations with already well established self-calibration techniques (e.g. Libralato et al. 2014). Moreover, it also means that each GeMS exposure requires its own distortion solution. In the following, we provide a possible solution to this problem which relies on a priori knowledge of distortion-free positions and accurate PMs for a sample of stars well-distributed over the FoV.
We selected GeMS images of the Galactic GC NGC 66811, for which we have already measured accurate PMs in the context of the HSTPROMO collaboration (Ma13). These frames are particularly interesting because they also include stars from the Sagittarius dwarf spheroidal galaxy (Sgr dSph). This will allow us to test the accuracy and precision on the relative proper motions between NGC 6681 and Sgr dSph. The GeMS data consists of 8 × 160 s exposures in both the J and the Ks filters, dithered by a few non-integer pixel steps to cover the inter-chip gaps of the camera.
The pre-reduction of each raw image followed the procedure described in Massari et al. (2016a), where we use both sky- and dome-flats for the flat-fielding. The photometry was then performed using DAOPHOT (Stetson 1987). Each of the four chips of the camera were treated separately. The PSF modelling involved fitting the light profile of a few hundred bright, isolated and non-saturated stars with a Moffat function and allowing the residuals of such a fit to be described with a look-up table that varies cubically across the FoV. The best-fit model has then been applied using ALLSTAR to all of the sources found 3σ above the background, and each raw star position ( ,
,  ) was obtained as output.
To obtain distortion-free positions ( ,
,  ), we considered that for evolved stars NGC 6681 has a central velocity dispersion of σ0 = 0.15mas yr-1 that at the half-light radius diminishes to σhr = 0.12mas yr-1 (Watkins et al. 2015). Main-sequence stars show even larger dispersion; up to ~ 0.2mas yr-1. This means that stars with a PM error smaller than this value should be representative of the internal kinematics of the cluster itself. To be conservative, we only selected stars with errors smaller than 0.03mas yr-1 that belong to the cluster according to their location in the Vector Point Diagram (VPD) from the PM catalogue of Ma13. The positions of these 7770 stars on the HST distortion free reference frame adopted in Ma13 (already corrected for geometric distortions using the solution provided by Anderson 2007, and aligned to Right Ascension and Declination by construction) were then moved according to their PM to construct a distortion-free reference frame at the epoch of the GeMS dataset, 6.914 yr later. At this point, each chip of each GeMS exposure has been transformed onto this reference using a high-order polynomial (the best choice turned out to be a fifth order polynomial, see Massari et al. 2016b, for details). Since the reference and GeMS exposures are at the same epoch, the stars should be aligned and the polynomial only should determine the distortion terms. The accuracy achieved with this distortion correction is ~ 1 mas across the majority of the FoV, degrading to ~ 2 mas only in its corners and near the edges (where less stars are available). This budget includes ~ 0.2 mas due to the propagation of the PM uncertainty (0.03mas yr-1) for the temporal baseline of 6.914 yr.
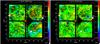 |
Fig. 1 Distortion maps for the first exposure in the J (left panels) and Ks filter (right panels), overplotted to the corresponding FWHM maps. Vectors lengths are multiplied by a factor of 40 to highlight the distortion structures. The adopted natural guide stars asterism is shown as a white triangle, while the LGS constellation is marked with orange star-like symbols. The R magnitude of the natural guide stars is also labelled. |
To visualise how the GeMS distortions affect the position of stars across the FoV, in Fig. 1 we show an example of a distortion map (computed in this case for the first of the available exposures) in the J and Ks filters, overplotted to the corresponding FWHM map. Each single exposure distortion map is the difference between the positions corrected with the fifth order polynomial (,  ), and the positions corrected using only conformal linear transformations. We point out that in the upper-left corner of the chip 3, the polynomial solution is extrapolated since there are no stars in common with the HST FoV of Ma13, and may not be accurate. The distortions do not seem to follow the geometry described by the adopted asterism of the natural guide stars (white stars in Fig. 1), nor that of the laser guide stars (orange stars in Fig. 1). Also, no correlation is evident between the distortion pattern and that described by the FWHM (or Strehl ratio) maps, as the latter is well-behaved and uniform across the entire FoV.
The following analysis refers to the mean distortion maps, computed by averaging the displacement vectors for all the stars common to all of the eight exposures per filter. We refer the reader to Massari et al. (2016b) for their visualisation, but we underline that the general trend is very similar to that shown here in Fig. 1. Several structures in the distortions are seen in all of the chips and both filters. The comparison between the coefficients of the fifth order polynomials used to model the J- and K-band distortions revealed that their mean difference is only 2 × 10⁻⁷ (with a dispersion of 2 × 10⁻⁶), thus demonstrating how strongly correlated the two solutions are. The amplitude of the distortions in the X-component (corresponding to right ascension) is significantly larger than that in the Y-component (declination). In fact the former spans an interval ranging from −1.64 pixels to 4.83 pixels, while the latter varies only from −0.49 pixels to 0.35 pixels. In addition, a circular structure is seen roughly at the centre of each chip (which does not move from exposure to exposure) where the X-component distortion is minimal and then changes its direction. The same overall structure has been found using an independent method on GeMS observations of the GC NGC 1851 by S. Mark Ammons (priv. comm., a detailed analysis of the distortions is beyond the aim of this paper and is provided in Massari et al. 2016b), and consistent results were obtained by Dalessandro (2016) using GeMS observations of NGC 6624. Finally, the average variation of the single-exposure maps with respect to the mean models shown in Fig. 1 is ~ 0.05 pixels, while the total variation ranges from −1.1 pixels to 1.3 pixels. The exclusion of the corners significantly limits the range between −0.02 to 0.03 pixels.
Now, the distortion-corrected GeMS positions ( , ) can be used as second epoch and matched using linear transformations to the HST first epoch positions to measure the PMs for all of the sources that were not used to build the distortion-free reference frame.
3. Proper motions results
Proper motions were measured following the procedure described in detail in Ma13. Briefly, once all of the 8 first-epoch and 16 second-epoch exposures had been transformed onto the same reference frame as described in the previous section, we computed first- and second-epoch median positions adopting a 3σ-rejection algorithm. Then, after discarding all of the sources with less than three single-epoch measurements, we computed the PM for each star as the displacement between its two median positions in Δt = 6.914 yr. We did not need to re-iterate the process of discarding non-member stars because the list of stars used to compute the transformations is made up of only NGC 6681 members by construction, since we used the information coming from the previous HST PM measurements. The PM errors were then computed as the sum in quadrature of each single epoch positional error. In turn, these were defined as the rms of the positional residuals about the median value, divided by the square root of the number of measurements.
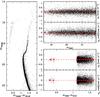 |
Fig. 2 Systematic trends of the two components of PMs with mF555W-mF814W colour (bottom-right panels) and mF555W magnitude (upper-right panels). PM values rejected by the clipping algorithm are shown in grey. In both cases, the results are consistent with no trend. The HST optical CMD from Ma13 is also shown in the left panel for the sake of comparison. |
Next, we performed several tests to check the consistency of our measurements. Following the analysis of systematic effects adopted by Bellini et al. (2014) and Massari et al. (2015), we checked for any possible trend in each PM component with star colours and magnitudes. The results of these tests are shown in the bottom- and upper-right panels of Fig. 2, respectively. To check for any colour trends, we computed 3σ-clipped mean PM values for bins of 0.06 mag in (mF555W-mF814W) colour (taken from Ma13, see the corresponding CMD in the left panel of Fig. 2) and plotted them as red filled circles, with associated error bars. All of the binned mean values turned out to be consistent with 0 within 1σ, thus excluding the presence of systematic errors with colour. We repeated the same procedure using mF555W magnitude bins of 0.1 mag, to find again that no trend exists between each PM component and stellar magnitude within 1σ uncertainty.
In Fig. 3 we compared the VPDs as obtained from HST PMs (left panel, Ma13) with VPDs from this study (right panel). Ma13 kinematically distinguished three different populations in the FoV of NGC 6681: the cluster (blue dots), the Sgr dSph (red dots) and the field, mostly composed of bulge stars (green dots). Plotting the PMs of the same stars in the two panels (keeping the same colour code), we were able to retrieve the same separation with our new PMs. This is the first important finding, since only cluster stars have been used to build the distortion-free reference at the GeMS epoch, and no PM was given as input to the stars belonging either to the Sgr dSph or to the field. This means that the method used is effective in correcting the distortions at least to the level of kinematically distinguishing the three populations. By comparing the relative PM between NGC 6681 and the Sgr dSph, we can test for the first time the accuracy of GeMS in providing a new epoch separated by several years for PM measurement.
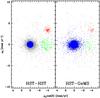 |
Fig. 3 Comparison between the VPDs as obtained from Ma13 PMs and the PMs measured with the method proposed in this Letter. The kinematical distinction of the three populations (cluster stars in blue, Sgr dSph stars in red, field stars in green) is recovered on average. The few outliers are either very close to the image edges or are beyond the photometric regime of non-linearity. |
Ma13 found a PM of the cluster relative to the Sgr dSph of (μαcosδ,μδ) = (4.12 ± 0.03,−3.38 ± 0.03)mas yr-1. By using all of the Ma13 Sgr dSph stars that we also found in the GeMS exposures (red dots in Fig. 3), we found such a relative PM value to be of (μαcosδ,μδ) = (4.09 ± 0.06,−3.41 ± 0.06)mas yr-1. This means that our newly found HST-GeMS PMs are as accurate as those coming from HST observations within only 0.03 mas yr-1.
The precision achieved is also comparable. The PM dispersions for Sgr dSph stars found with HST are (σPMX,Sgr,σPMY,Sgr) = (0.23,0.23)mas yr-1. This is given by the sum in quadrature between the PM errors at the magnitude of Sgr dSph stars (~ 0.16mas yr-1 at mF555W> 22 mag, see the upper panel of Fig. 4) and the Sgr dSph internal velocity dispersion (~ 0.1mas yr-1, Frinchaboy et al. 2012). The dispersions found in this work are about a factor of two larger, being (σPMX,Sgr,σPMY,Sgr) = (0.43,0.43)mas yr-1. This is due to the larger PM errors (~ 0.36mas yr-1at mF555W> 22 mag, see the upper panel of Fig. 4) and to the contribution coming from the error on the distortion correction, discussed in Massari et al. (2016b), amounting to ~ 0.14mas yr-1. The sum in quadrature of these two contributions and the Sgr dSph internal motions gives the total dispersion. However, we point out that, for relatively faint stars (mF555W> 21.5, i.e. the range where Sgr dSph stars fall), our PM precision becomes worse than that from HST only, while the precisions are similar for brighter stars (~ 0.05mas yr-1). This is clearly shown in the upper panel of Fig. 4, where the cyan continuous and dashed lines describe the 3σ-clipped mean trends for the HST-HST and HST-GeMS PMs, respectively. Finally, the same dispersion quoted above is also found when computing the scatter around the 1:1 relation that describes the comparison between the PMs of Ma13 and those measured in this work, shown in the bottom panels of Fig. 4.
For sake of comparison, the only other previous PM measurements obtained with an MCAO facility (Ortolani et al. 2011) reached a precision lower by a factor of ~ 2.5, after combining their MAD observations of the globular cluster HP1 (at a distance of 6.8 kpc, that is ~ 3.2 kpc closer than NGC 6681, Ferraro et al. 1999) with seeing-limited data obtained 14.25 yr before with the ESO New Technology Telescope. In that case the authors did not correct the MAD data for the camera distortions, but estimated a contribution of ~ 0.2mas yr-1. This value is significantly smaller than the error term that would come from GeMS distortions without their correction (~ 4mas yr-1, see Massari et al. 2016b). One difference between GeMS and MAD is that the former is Cassegrain mounted, while the latter is mounted at Nasmyth. Therefore it is plausible that the MAD dataset suffered from smaller distortions, but since a detailed treatment of MAD distortions is not available in that paper, we cannot exclude the possibility that they have been underestimated. This statement is further supported by the findings of Meyer et al. (2011), where the authors estimated the distortions affecting MAD observations of the GC NGC 6388 to be in the range of ~ 3 to ~ 40 mas. A further investigation on MAD distortions found corner to corner values of ~ 100 mas (A. Bellini, unpublished work).
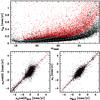 |
Fig. 4 PM errors in the right ascension and declination components as found combining two HST epochs (black dots) or the corrected GeMS images with the first epoch of HST data (red dots). Cyan lines describe the 3σ-clipped mean trends in the two cases (continuous and dashed lines corresponding to the HST-HST and the HST-GeMS cases, respectively). From the comparison it is evident that the performance is similar until mF555W ≃ 21.5 mag, where our new PM precision becomes approximately a factor of two larger than that coming from HST. |
4. Conclusions
In this work we present the first PM measurements obtained from exploiting the potential of the MCAO GeMS/GSAOI camera. We used the a priori knowledge of independently measured PMs for stars in the FoV of interest to model the distortions affecting the camera, finding a different distortion solution for each of the GeMS exposures. After combining the corrected GeMS images with observations coming from HST, providing a temporal baseline of Δt = 6.914 yr, we were able to determine the relative PM between the globular cluster NGC 6681 and the Sgr dSph galaxy. The value we found of (μαcosδ,μδ) = (4.09,−3.41)mas yr-1 matches the previous HST measurement with an accuracy of 0.03mas yr-1. Also the achieved precision turns out to be comparable to that of HST, and becomes worse by a factor of two at the faint magnitudes of Sgr dSph stars.
Our findings demonstrate that GeMS is potentially useful to obtain high-quality PMs from the ground when combined with space-based observations. We are waiting for two GeMS epochs sufficiently distant in time to test the astrometric performances achievable using only MCAO datasets. This work sets the stage for future PM measurements with this complex AO instrumentation, providing strong support for the need of a careful treatment of time-varying distortions.
Following the effective investigation discussed in this Letter, our group is now testing a new observational strategy to use GeMS for PM measurements without the support of previous HST data. This involves the combined use of the FLAMINGOS-2 (Eikenberry et al. 2004) and GeMS/GSAOI images. According to our strategy, distortion-corrected FLAMINGOS-2 seeing-limited observations will precede any GeMS dataset to provide an independent reference frame to be used as a corrector for the distortions of each GeMS exposure. In order to make the above procedure possible, we have obtained dedicated time to model the FLAMINGOS-2 camera distortions (PI A. McConnachie). The proposed strategy will pave the way for future astrometric MCAO observations, including those with ELTs.
Programme IDs: GS-2012B-SV-406, GS-2013A-Q-16, GS-2013B-Q-55, PI: McConnachie.
Acknowledgments
We thank the anonymous referee for her/his comments and suggestions which helped us to improve the presentation of our results. Based on observations obtained at the Gemini Observatory, acquired through the Gemini Science Archive and processed using the Gemini IRAF package. D.M. and G.F. have been supported by the FIRB 2013 (MIUR grant RBFR13J716).
References
- Ammons, S. M., Neichel, B., Lu, J., et al. 2014, in Adaptive Optics Systems IV, Proc. SPIE, 9148, 91481J [NASA ADS] [CrossRef] [Google Scholar]
- Anderson, J. 2007, Variation of the Distortion Solution, Tech. rep. [Google Scholar]
- Anderson, J., & van der Marel, R. P. 2010, ApJ, 710, 1032 [NASA ADS] [CrossRef] [Google Scholar]
- Bellini, A., Anderson, J., & Bedin, L. R. 2011, PASP, 123, 622 [NASA ADS] [CrossRef] [Google Scholar]
- Bellini, A., Anderson, J., van der Marel, R. P., et al. 2014, ApJ, 797, 115 [NASA ADS] [CrossRef] [Google Scholar]
- Dalessandro, E. 2016, ApJ, submitted [Google Scholar]
- Eikenberry, S. S., Elston, R., Raines, S. N., et al. 2004, in Ground-based Instrumentation for Astronomy, eds. A. F. M. Moorwood, & M. Iye, Proc. SPIE, 5492, 1196 [Google Scholar]
- Ferraro, F. R., Messineo, M., Fusi Pecci, F., et al. 1999, AJ, 118, 1738 [NASA ADS] [CrossRef] [Google Scholar]
- Frinchaboy, P. M., Majewski, S. R., Muñoz, R. R., et al. 2012, ApJ, 756, 74 [NASA ADS] [CrossRef] [Google Scholar]
- Libralato, M., Bellini, A., Bedin, L. R., et al. 2014, A&A, 563, A80 [NASA ADS] [CrossRef] [EDP Sciences] [Google Scholar]
- Lu, J. R., Neichel, B., Anderson, J., et al. 2014, in Adaptive Optics Systems IV, Proc. SPIE, 9148, 91480B [CrossRef] [Google Scholar]
- Marchetti, E., Brast, R., Delabre, B., et al. 2008, in Adaptive Optics Systems, Proc. SPIE, 7015, 70150F [CrossRef] [Google Scholar]
- Massari, D., Bellini, A., Ferraro, F. R., et al. 2013, ApJ, 779, 81 [NASA ADS] [CrossRef] [Google Scholar]
- Massari, D., Dalessandro, E., Ferraro, F. R., et al. 2015, ApJ, 810, 69 [NASA ADS] [CrossRef] [Google Scholar]
- Massari, D., Fiorentino, G., McConnachie, A., et al. 2016a, A&A, 586, A51 [NASA ADS] [CrossRef] [EDP Sciences] [Google Scholar]
- Massari, D., Fiorentino, G., Tolstoy, E., et al. 2016b, Proc. SPIE, 9909, 54 [Google Scholar]
- McLaughlin, D. E., Anderson, J., Meylan, G., et al. 2006, ApJS, 166, 249 [NASA ADS] [CrossRef] [Google Scholar]
- McNamara, B. J., Harrison, T. E., Baumgardt, H., & Khalaj, P. 2012, ApJ, 745, 175 [NASA ADS] [CrossRef] [Google Scholar]
- Meyer, E., Kürster, M., Arcidiacono, C., Ragazzoni, R., & Rix, H.-W. 2011, A&A, 532, A16 [NASA ADS] [EDP Sciences] [Google Scholar]
- Neichel, B., Lu, J. R., Rigaut, F., et al. 2014a, MNRAS, 445, 500 [NASA ADS] [CrossRef] [Google Scholar]
- Neichel, B., Rigaut, F., Vidal, F., et al. 2014b, MNRAS, 440, 1002 [NASA ADS] [CrossRef] [Google Scholar]
- Ortolani, S., Barbuy, B., Momany, Y., et al. 2011, ApJ, 737, 31 [NASA ADS] [CrossRef] [Google Scholar]
- Ragazzoni, R., Marchetti, E., & Valente, G. 2000, Nature, 403, 54 [NASA ADS] [CrossRef] [PubMed] [Google Scholar]
- Rigaut, F., Neichel, B., Boccas, M., et al. 2014, MNRAS, 437, 2361 [NASA ADS] [CrossRef] [Google Scholar]
- Stetson, P. B. 1987, PASP, 99, 191 [NASA ADS] [CrossRef] [Google Scholar]
- Trippe, S., Davies, R., Eisenhauer, F., et al. 2010, MNRAS, 402, 1126 [NASA ADS] [CrossRef] [Google Scholar]
- Turri, P., McConnachie, A. W., Stetson, P. B., et al. 2014, in Adaptive Optics Systems IV, Proc. SPIE, 9148, 91483V [Google Scholar]
- Turri, P., McConnachie, A. W., Stetson, P. B., et al. 2015, ApJ, 811, L15 [NASA ADS] [CrossRef] [Google Scholar]
- Watkins, L. L., van der Marel, R. P., Bellini, A., & Anderson, J. 2015, ApJ, 803, 29 [NASA ADS] [CrossRef] [Google Scholar]
All Figures
|
Fig. 1 Distortion maps for the first exposure in the J (left panels) and Ks filter (right panels), overplotted to the corresponding FWHM maps. Vectors lengths are multiplied by a factor of 40 to highlight the distortion structures. The adopted natural guide stars asterism is shown as a white triangle, while the LGS constellation is marked with orange star-like symbols. The R magnitude of the natural guide stars is also labelled. |
| In the text | |
|
Fig. 2 Systematic trends of the two components of PMs with mF555W-mF814W colour (bottom-right panels) and mF555W magnitude (upper-right panels). PM values rejected by the clipping algorithm are shown in grey. In both cases, the results are consistent with no trend. The HST optical CMD from Ma13 is also shown in the left panel for the sake of comparison. |
| In the text | |
|
Fig. 3 Comparison between the VPDs as obtained from Ma13 PMs and the PMs measured with the method proposed in this Letter. The kinematical distinction of the three populations (cluster stars in blue, Sgr dSph stars in red, field stars in green) is recovered on average. The few outliers are either very close to the image edges or are beyond the photometric regime of non-linearity. |
| In the text | |
|
Fig. 4 PM errors in the right ascension and declination components as found combining two HST epochs (black dots) or the corrected GeMS images with the first epoch of HST data (red dots). Cyan lines describe the 3σ-clipped mean trends in the two cases (continuous and dashed lines corresponding to the HST-HST and the HST-GeMS cases, respectively). From the comparison it is evident that the performance is similar until mF555W ≃ 21.5 mag, where our new PM precision becomes approximately a factor of two larger than that coming from HST. |
| In the text | |
Current usage metrics show cumulative count of Article Views (full-text article views including HTML views, PDF and ePub downloads, according to the available data) and Abstracts Views on Vision4Press platform.
Data correspond to usage on the plateform after 2015. The current usage metrics is available 48-96 hours after online publication and is updated daily on week days.
Initial download of the metrics may take a while.