| Issue |
A&A
Volume 595, November 2016
|
|
|---|---|---|
| Article Number | A128 | |
| Number of page(s) | 10 | |
| Section | Extragalactic astronomy | |
| DOI | https://doi.org/10.1051/0004-6361/201629073 | |
| Published online | 16 November 2016 | |
OH+ and H2O+ absorption toward PKS 1830–211⋆
1 Department of Earth and Space Sciences, Chalmers University of Technology, Onsala Space Observatory, 43992 Onsala, Sweden
e-mail: This email address is being protected from spambots. You need JavaScript enabled to view it.
2 I. Physikalisches Institut, Universität zu Köln, Zülpicher Str. 77, 50937 Köln, Germany
3 Institut d’Astrophysique Spatiale, Bât. 121, Université Paris-Sud, 91405 Orsay Cedex, France
4 Observatoire de Paris, LERMA, CNRS, 61 avenue de l’Observatoire, 75014 Paris, France
5 School of Chemical and Physical Sciences, Victoria University of Wellington, PO Box 600, Wellington 6140, New Zealand
6 LERMA/LRA, École Normale Supérieure, Observatoire de Paris, CNRS UMR 8112, PSL Research University, Sorbonne Universités, UPMC Université Paris, 24 rue Lhomond, 75005 Paris, France
7 Institut de Radioastronomie Millimétrique, 300 rue de la piscine, 38406 St-Martin-d’Hères, France
8 Max-Planck-Institut für Radioastonomie, Auf dem Hügel 69, 53121 Bonn, Germany
9 Astron. Dept., King Abdulaziz University, PO Box 80203, Jeddah, Saudi Arabia
10 European Southern Observatory, Alonso de Córdova 3107, Vitacura Casilla 763 0355, Santiago, Chile
11 Department of Physics, Catholic University of America, 620 Michigan Ave NE, Washington DC 20064, USA
12 European Southern Observatory, Karl-Schwarzschild-Str. 2, 85748 Garching b. München, Germany
Received: 7 June 2016
Accepted: 26 August 2016
Abstract
We report the detection of OH+ and H2O+ in the z = 0.89 absorber toward the lensed quasar PKS 1830–211. The abundance ratio of OH+ and H2O+ is used to quantify the molecular hydrogen fraction (fH2) and the cosmic-ray ionization rate of atomic hydrogen (ζH) along two lines of sight, located at ~ 2 kpc and ~ 4 kpc to either side of the absorber’s center. The molecular fraction decreases outward, from ~ 0.04 to ~ 0.02, comparable to values measured in the Milky Way at similar galactocentric radii. For ζH , we find values of ~ 2 × 10-14 s-1 and ~ 3 × 10-15 s-1, respectively, which are slightly higher than in the Milky Way at comparable galactocentric radii, possibly due to a higher average star formation activity in the z = 0.89 absorber. The ALMA observations of OH+, H2O+, and other hydrides toward PKS 1830–211reveal the multi-phase composition of the absorbing gas. Taking the column density ratios along the southwest and northeast lines of sight as a proxy of molecular fraction, we classify the species ArH+, OH+, H2Cl+, H2O+, CH, and HF as tracing gases increasingly more molecular. Incidentally, our data allow us to improve the accuracy of H2O+ rest frequencies and thus refine the spectroscopic parameters.
Key words: quasars: absorption lines / quasars: individual: PKS 1830 / 211 / galaxies: abundances / radio lines: galaxies / galaxies: ISM / ISM: molecules
The reduced spectra (FITS files) are only available at the CDS via anonymous ftp to cdsarc.u-strasbg.fr (130.79.128.5) or via http://cdsarc.u-strasbg.fr/viz-bin/qcat?J/A+A/595/A128
© ESO, 2016
1. Introduction
Hydrides, that is, molecules or molecular ions containing a single heavy element with one or more hydrogen atoms, are formed in the interstellar medium (ISM) from the initial chemical reactions starting from atomic gas, making them fundamental to interstellar chemistry. Their rotational spectrum starting at submm/FIR wavelengths (a few exceptions, such as H2S and H2Cl+, have ground-state transitions in the millimeter band) makes them difficult or even impossible to study from the ground. For this reason, many hydrides have only recently been detected in the ISM (see the review by Gérin et al. 2016).
The two species of interest here, hydroxylium (OH+) and oxidaniumyl (H2O+), were first detected in the Galactic ISM by Wyrowski et al. (2010) with the Atacama Pathfinder EXperiment (APEX) telescope, and by Ossenkopf et al. (2010) with the Herschel Space Observatory, respectively. These two species, and the third oxygen-bearing ion in the family, hydronium (H3O+), are formed from O+ by successive hydrogen abstraction reactions with H2. There can also be a significant contribution from the H +O reaction, in any place where the molecular fraction is relatively high. OH+ and H2O+ are destroyed by dissociative recombination with electrons and by reactions with H2. H3O+ does not react with H2 and is mostly destroyed by dissociative recombination. The relative abundances of these species are thus controlled by the molecular hydrogen fraction and cosmic-ray ionization rate (Hollenbach et al. 2012), providing a powerful diagnostic of these two quantities. Indriolo et al. (2015) analyzed Herschel observations of OH+, H2O+, and H3O+ in multiple lines of sight toward bright submillimeter continuum sources in the Galaxy. Their results confirm that OH+ and H2O+ are primarily tracing gases with a low molecular hydogen fraction (fH2 = 2 × N(H2)/ [N(H) + 2 × N(H2)]) of a few percent. They also determined the cosmic-ray ionization rate of atomic hydrogen (ζH) across the Galactic disk and found an average ζH ~ 2 × 10-16 s-1 that shows little variation over the disk outside of Galactocentric radii of 5 kpc. Closer to the Galactic center, ζH is found to increase by up to two orders of magnitude in the central region itself. To date, there are only a few observations of OH+ and/or H2O+ in extragalactic sources (e.g., van der Werf et al. 2010; Yang et al. 2013; González-Alfonso et al. 2013), including detections at very high redshift (Weiß et al. 2013; Riechers et al. 2013). González-Alfonso et al. (2013) report ionization rates toward Arp 220 and NGC 4418 comparable to, or possibly higher than, values in the Galactic center.
Although the Herschel Space Observatory is no longer in operation, it is now possible to extend the studies of these hydrides to other galaxies, e.g., with the Atacama Large Millimeter/submillimeter Array (ALMA). The molecular-line rich absorber at z = 0.89 located in front of the quasar PKS 1830–211 is certainly a prime target in this prospect. PKS 1830–211 is lensed by the absorber, a nearly face-on typical spiral galaxy (e.g., Wiklind & Combes 1998; Winn et al. 2002; Koopmans & de Bruyn 2005). Molecular absorption is seen along the two independent lines of sight toward the southwest and northeast images of the quasar, at galactocentric radii of ~ 2 kpc and ~ 4 kpc in opposite directions from the center of the absorbing galaxy, respectively. The apparent size of the lensed images of the quasar is a fraction of a milliarcsecond at mm wavelengths (Jin et al. 2003). The volume of gas seen in absorption in each line of sight is thus roughly enclosed in a cylinder with a base of < 1 pc in diameter and a depth of a few tens to hundreds of pc, depending on the inclination (i = 17°−32°, Koopmans & de Bruyn 2005) and the thickness of the absorber’s disk. More than forty molecular species have been detected toward the southwest image, where the H2 column density is ~ 2 × 1022 cm-2 (e.g., Muller et al. 2011, 2014a). In contrast, only about a dozen species have been detected toward the northeast image, where the molecular gas has a lower column and is more diffuse. Several submm lines of hydrides have already been observed toward PKS 1830–211 with ALMA, such as those for CH, H2O, NH2, NH3 (Muller et al. 2014a), H2Cl+ (Muller et al. 2014b), ArH+ (Müller et al. 2015), as well as HF (Kawaguchi et al. 2016).
2. Observations
We observed the OH+N = 1–0 J=1–0 line (two hyperfine components at a rest frequency near 909 GHz) redshifted into ALMA band 8 and the p-H2O+JKa,Kc = 11,0–10,1 transition (four fine-structure components at rest frequencies 604, 607, 631, and 634 GHz) redshifted into band 7. We complement this dataset with contemporary observations of some other hydrides, collected at several epochs in Cycles 1–3, between 2014 and 2016 (see Table 1). The array was always in a configuration providing a synthesized beam resolution better than 0.5′′, sufficient to resolve the two point-like lensed images of PKS 1830–211, separated by 1′′.
The correlator was set up with spectral basebands of 1.875 GHz, providing a velocity resolution of ~ 0.6–1.0 km s-1. For each epoch, the bandpass response of the antennas was calibrated from observations of the bright quasar J1924−292, with J1832−2039 being used for primary gain calibration. The data calibration was done with the CASA1 package. We further improved the data quality using self-calibration on the bright continuum of PKS 1830–211. The spectra were then extracted toward both lensed images of PKS 1830–211, using the CASA-python task UVMULTIFIT (Martí-Vidal et al. 2014) in order to fit a model of two point sources to the visibilities.
The absorption spectra of OH+ (909 GHz) and H2O+ (the strongest fine-structure transition at 607 GHz) toward PKS 1830–211 are shown in Fig. 1, together with spectra of some other species for comparison.
ALMA observations discussed in this paper.
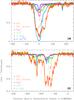 |
Fig. 1 Spectra of OH+ and H2O+ (only the 607 GHz transition is shown) toward PKS 1830–211 southwest (top) and northeast (bottom) images. The hyperfine structure (hfs) for OH+ is indicated, with the relative strengths expected when the sublevels are populated in proportion to their statistical weights. The spectra corresponding to the strongest OH+ hfs component, after hfs deconvolution, are shown in dotted lines. Spectra of other species are shown for comparison. |
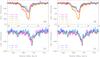 |
Fig. 2 Spectra of the four H2O+ lines toward PKS 1830–211(SW) (top) and PKS 1830–211(NE) (bottom) using current CDMS frequencies (left) and revised frequencies (right) as given in Table 3. The 607 GHz line profile has been scaled down by the ratios of relative strengths. |
3. Spectroscopy
3.1. OH+
The OH+ radical has a  ground vibronic state with two unpaired electrons. The spin-spin coupling causes fairly large fine structure splittings. The spin of the H nucleus causes additional hyperfine structure (HFS) splitting. The transition frequencies of the N = 1–0 transition were recorded by Bekooy et al. (1985) with ~ 1 MHz accuracy. The THz spectrum of OH+ has recently been revised by Markus et al. (2016) and frequencies of the N = 1–0 rotational transitions are predicted with an accuracy better than 1 MHz (i.e., <0.3 km s-1). The J = 0–1 fine structure (FS) component near 909 GHz is the weakest FS component and thus least prone to be affected by optical depth effects. Its HFS splitting (two components) is slightly larger than 100 MHz. The dipole moment, μOH+ = 2.3 D, is from a quantum chemical calculation (Werner et al. 1983). The spectroscopic details were obtained from the Cologne Database for Molecular Spectroscopy (CDMS, Müller et al. 2005)2.
3.2. H2O+
The H2O+ radical is an asymmetric top molecule with one unpaired electron which results in a  ground vibronic state. The two H nuclei give rise to HFS for rotational levels with Ka+Kc being even (Itot = 1; ortho) whereas those with Ka+Kc being odd (Itot = 0; para) do not display HFS. The dipole moment is μH2O+ = 2.4 D (Weis et al. 1989). The initial spectroscopic data were taken from the CDMS, where it was noted that existing laboratory measurements are not of microwave precision. As shown in Fig. 2 (left) and Table A.1, the frequencies provided in the CDMS agree with our observations well enough for identification, but are not adequate for detailed kinematical analysis of the line profiles. Therefore, we decided to revise the rest frequencies of the four FS components of p-H2O+ observed with ALMA (Sect. 4.2) and update the H2O+ entry in the CDMS (see Appendix A).
Results for the cross-correlations of the p-H2O+ lines observed with ALMA.
Spectroscopic parameters for OH+ and p-H2O+ lines observed in this work.
4. Results and discussion
4.1. Observed spectra
The OH+ absorption profiles are deep in both lines of sight toward PKS 1830–211. They do not seem to be saturated, as there is no sign of a flattening of the profile bottom, as is the case for H2O, for example. Toward the southwest image, a broad (~100 km s-1, full width at zero power, FWZP) and deep (optical depth, τ ≥ 3) absorption component is seen near v = 0 km s-1, and the weak and narrow velocity component at v = +170 km s-1 (see Muller et al. 2011, 2014a) is also detected. Toward the northeast image, absorption occurs in a series of narrow components throughout the velocity interval between −300 and −100 km s-1. The maximum absorption depth toward the northeast image implies that the continuum covering factor is larger than 50%. This is the deepest molecular absorption detected along this line of sight, so far.
The three FS transitions of the p-H2O+110−101 line at 604, 607, and 631 GHz (rest frame) were observed simultaneously in the same tuning for the southwest image. The northeast absorption was out of the band for the 631 GHz transition. The 634 GHz transition was observed approximately one year later (Table 1), as reported by Müller et al. (2015), with very minor variations apparent in the line profile compared to the other FS transitions observed in 2014. The optical depths of the four p-H2O+ FS lines toward the southwest image follow the relative line strengths given in Table 3, as expected when the sublevels are populated in proportion to their statistical weights (see Fig. 2).
4.2. Evaluation of H2O+ rest frequencies
The frequencies for the p-H2O+ lines in the CDMS (version 1) have uncertainties of a few MHz. Using them, we see that our four lines do not match each other precisely in velocity, see Fig.2(left). We can use our ALMA data to improve the rest frequencies of the observed p-H2O+ transitions. First, we have cross-correlated the absorption profiles of the p-H2O+ 607 GHz and o-H2O 557 GHz lines, which are both optically thin and relatively well correlated toward the NE image. The cross-correlation function has a strong peak for an offset (rest frame, taking z = 0.88582) of 50 289.80 ± 0.17 MHz between the two lines. Using the high-accuracy of 556, 935, 987.7 ± 0.3 kHz for the frequency of the o-H2O line (Cazzoli et al. 2009), we thus find a frequency of 607 225.79±0.17 MHz for the main FS component of p-H2O+. In addition, we cross-correlate the four p-H2O+ FS components to derive their relative frequency offsets, reported in Table 2. With the new frequencies in Table 3, the match of the four FS lines is clearly improved with respect to the CDMS frequencies (Fig. 2, right). We note that the relative frequency offsets between p-H2O+ FS transitions, determined from the cross-correlations, are robust, but that their absolute frequencies are limited by potential chemical segregation and velocity offsets between p-H2O+ and o-H2O. This was not taken into account in the frequency uncertainties in Table 3. More precise and accurate H2O+ frequencies would require laboratory microwave measurements.
4.3. Time variations
Time variations can be a concern for PKS 1830–211 when comparing observations taken at different epochs since the absorption line profiles are known to have variations over a timescale of a few months, related to intrinsic morphological changes in the quasar’s jet (Muller & Guélin 2008; Muller et al. 2014a; Schulz et al. 2015). For example, Very Long Baseline Array measurements at 43 GHz by Jin et al. (2003) revealed that the apparent separation between the NE and SW cores varied by up to 200 μas, that is, approximately 1.6 pc projected on the plane of the absorber, within 8 months. Nair et al. (2005) interpreted this apparent motion as possibly due to the episodic ejection of plasmons along a putative helical jet. Accordingly, the two lines of sight through the absorber could vary with time and intercept a different absorbing screen.
Between 2014 and 2016 (the time span of the observations presented here), we have obtained several spectra of the H2O 557 GHz and CH 532/536 GHz lines (Fig. 3). Toward the southwest image, the CH spectra show only minor changes of less than 6% of the total integrated opacity. The wings of the saturated line of H2O show the most significant variations in the 2016 spectrum, with an increase of approximately 50% of the integrated opacities in the velocity ranges −20 to −60 km s-1 and 20 to 80 km s-1, with respect to 2014. Those are small, however, compared to the total integrated opacity over the whole line. Toward the northeast image, the relative variations of the total integrated opacity of the water line (in the velocity interval −240 to −80 km s-1) are less than 15%. We therefore conclude that time variations do not significantly affect the results presented here.
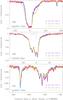 |
Fig. 3 Spectra of H2O (top: toward the southwest image of PKS 1830–211; bottom: toward the northeast image) and CH (middle: toward the southwest image) at several epochs between 2014 and 2016. |
4.4. Column densities
In order to determine the column densities from observations of a single rotational transition of OH+ and H2O+, we must first obtain their excitation temperature. For OH+, the collision rate for destructive reactions with H2 is so close to the elastic collision rate that OH+ formed from exoergic reactions O++H2 and H+O cannot be fully thermalized during its short lifetime. As a result, OH+ remains kinetically hot compared with other molecules. At a density of n(H2) ~ 1000 cm-3 (i.e., the order of magnitude estimated toward the southwest image of PKS 1830–211, Muller et al. 2013), the destruction rate of OH+ is approximately 10-6 s-1. This is equal to the rate at which OH+ absorbs background radiation in the two 909 GHz lines, 1.08 × 10⁻⁶ s-1, when the cosmic microwave background (CMB) at z = 0.89 has TCMB = 5.14 K (Muller et al. 2013). That is, OH+ is not solely excited by the CMB photons; formation and destruction processes are comparable in importance at a density of the order of 1000 cm-3. As long as the destruction rate is not dependent on the FS state, then the excitation temperature will probably closely approximate TCMB . The corresponding radiative rates in H2O+ are approximately 20 times higher than the reactive destruction rate at a density of 1000 cm-3, therefore, H2O+ is probably more strongly coupled to the CMB. Since we actually expect OH+ and H2O+ to be present in the more diffuse phase, that is, at a density of < 1000 cm-3, we will assume that their excitation temperature (Tex) is locked to the temperature of the cosmic microwave background, TCMB = 5.14 K. If Tex(OH+) > 5.14 K, the OH+ column density would rise, and the values determined here would be lower limits.
In addition, we assume an ortho/para ratio, OPR, of 3 for H2O+. Tanaka et al. (2013) looked into the ortho to para exchange from the spectroscopic point of view. They found several transitions that could facilitate such an exchange. They concluded, however, that the exchange rates are rather low such that significant alterations of the OPR are unlikely, especially at low temperatures. Schilke et al. (2013) reinvestigated the OPR of H2O+ in the diffuse ISM toward Sgr B2(M) with some new observational results and concluded that there is no evidence for an OPR different from the high temperature limit of three.
Toward the southwest image of PKS 1830–211, we measure integrated opacities ∫τdv = 122.2 ± 0.3 km s-1 and 13.61 ± 0.05 km s-1 for OH+ (both HFS components together) and p-H2O+ (only the 607 GHz line), respectively. With the assumptions discussed above, we derive total column densities of 1.6 × 1015 cm-2and 2.7 × 1014 cm-2for OH+ and H2O+, respectively. Toward the northeast image, we measure integrated opacities ∫τdv = 56.6 ± 0.2 km s-1 and 3.52 ± 0.03 km s-1 for OH+ and p-H2O+, respectively (over the same HFS/FS components), yielding column densities of a factor 2–4 lower than toward the southwest line of sight (Table 4).
Among the detected hydrides, OH+, H2O+, as well as H2Cl+ (Muller et al. 2014b) and ArH+ (Müller et al. 2015), show significantly different line profiles compared to other species, in particular broader line wings and a clear enhancement of their abundance toward the NE image (Table 4). This is consistent with the expectation that they preferentially trace a diffuse gas component, almost purely atomic in the case of ArH+ (Schilke et al. 2014). The SW/NE column density ratios for these species are between two and four, while for CH and various (non-hydride) species detected in a 7 mm spectral scan with the Australia Telescope Compact Array (ATCA), Muller et al. (2011) found an average ratio of more than one order of magnitude between the two lines of sight.
The molecular hydrogen fraction derived from the ratio of OH+ and H2O+ is fH2 ~ 0.02–0.04 in both lines of sight (see Sect. 4.5). This gas component is completely different from that traced by molecules such as HF, H2O, CH, HCN, HCO+, for which the molecular fraction is much higher. More evidence for chemical differentiation along the southwest line of sight comes from the detection of CF+ (Muller et al. 2016), which has a singular line profile compared to other species observed in the same tuning.
With these ALMA observations of hydrides, we are now starting to identify and disentangle the different gas components in the two absorbing pencil beams in the z = 0.89 galaxy. The simple comparison of the SW/NE abundance ratios in Table 4 suggests that the sequence of hydrides, ArH+, OH+, H2Cl+, H2O+, CH, and HF, traces gas with an increasing molecular fraction.
Total column densities along the SW and NE lines of sight toward PKS 1830–211.
4.5. Fraction of molecular hydrogen
With the fraction of molecular hydrogen defined as ![Mathematical equation: \begin{eqnarray*} \fH2=2 \times N({\rm H}_2)/[N({\rm H})+2 \times N({\rm H}_2)], \end{eqnarray*}](/articles/aa/full_html/2016/11/aa29073-16/aa29073-16-eq91.png) we need estimates of the total column densities of H I and H2 to get average fH2values along the absorbing sightlines. The H I spectrum toward PKS 1830–211 has been obtained by Chengalur et al. (1999) and Koopmans & de Bruyn (2005), although with the radio-cm continuum illumination (NE and SW images embedded in the pseudo-Einstein ring) unresolved. Koopmans & de Bruyn (2005) did a modeling of the H I absorption spectrum, assuming a thin axisymmetric disk in the lensing galaxy and using the quasar radio continuum resolved at higher frequencies. They estimate H I opacities of 0.064 and 0.128 toward the southwest and northeast images, respectively, that is, H I column densities of
we need estimates of the total column densities of H I and H2 to get average fH2values along the absorbing sightlines. The H I spectrum toward PKS 1830–211 has been obtained by Chengalur et al. (1999) and Koopmans & de Bruyn (2005), although with the radio-cm continuum illumination (NE and SW images embedded in the pseudo-Einstein ring) unresolved. Koopmans & de Bruyn (2005) did a modeling of the H I absorption spectrum, assuming a thin axisymmetric disk in the lensing galaxy and using the quasar radio continuum resolved at higher frequencies. They estimate H I opacities of 0.064 and 0.128 toward the southwest and northeast images, respectively, that is, H I column densities of 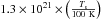 cm-2 and
  cm-2. We further adopt Ts = 100 K, although it could be marginally higher (e.g., Dickey et al. 2009; Curran et al. 2016). Concerning the H2 column densities, we take the values derived by Muller et al. (2014a) with CH as proxy of H2, assuming the Galactic value [CH]/[H2] = 3.5 × 10⁻⁸ (Sheffer et al. 2008; Gérin et al. 2010). Accordingly, we obtain fH2 ~ 0.97 and 0.44 along the SW and NE lines of sight, respectively. These values are somehow uncertain, since the H I column densities may have been underestimated. Still, they are consistent with the fact that a large number of molecules is detected toward the almost-purely-molecular v ~ 0 km s-1 velocity component along the southwest line of sight (e.g., Muller et al. 2011), in contrast to the northeast line of sight which is relatively more diffuse, as indicated by the relative enhancement of OH+, ArH+, H2O+, and H2Cl+.
Since the formation and destruction of OH+ and H2O+ are controlled by simple abstraction reactions with H2 and dissociative recombinations with electrons, their abundance ratio can be used as a local measurement of the fraction of molecular gas, as shown by Hollenbach et al. (2012). The analytical expression of fH2 (see Eq. (12) from Indriolo et al. 2015) scales linearly with the fractional abundance of electrons, xe , and also depends on the gas kinetic temperature, Tkin , via the rate coefficients for dissociative recombination of OH+ and H2O+ with electrons (taken from the UMIST Database for Astrochemistry 5th release; McElroy et al. 2013). xe cannot be constrained from our data and so, we adopt the same value as Indriolo et al. (2015), xe = 1.5 × 10⁻⁴, which comes from C+ observations in the Milky Way. A different metallicity in the z = 0.89 absorber (which is yet unknown) could potentially affect xe ; however, the chemical abundances of the molecular species observed toward PKS 1830–211 are comparable to those in Galactic diffuse and/or translucent clouds (Muller et al. 2011). For the kinetic temperature, we assume a canonical value of 100 K, close to that determined by Muller et al. (2013) toward the SW image, and identical to that taken by Indriolo et al. (2015) for all their Galactic clouds. With these assumptions for xe and Tkin and the OH+/H2O+ ratios from Table 4, we obtain fH2 = 0.04 in the southwest line of sight and fH2 = 0.02 in the northeast one. Varying the kinetic temperature in the range 30–300 K would only change fH2 between 0.02–0.07 and 0.01–0.04, for the SW and NE lines of sight, respectively.
These values are much lower than the average fH2derived above, indicating that OH+ and H2O+ are found in a gas component with a very low H2 fraction. OH+ and H2O+ provide the H2 fraction in the regions where they reach their maximum abundance, which can be the regions where H I is the main hydrogen species. The similarity (only a factor of two) between the molecular fractions fH2 derived from OH+/H2O+ along the NE and SW lines of sight, despite the known difference in their cloud type populations and in galactocentric distance, is remarkable, as well as the similarity with fH2 values obtained by Indriolo et al. (2015) in the Milky Way. It may be related to the fact that OH+ and H2O+ trace a low-fH2, diffuse gas regime which is always present along these lines of sight. The difference in mean molecular fraction appears more clearly in other tracers, more sensitive to the bulk of molecular gas, such as CH or H2O. Indeed, the difference in line profile between these species toward PKS 1830–211 shows that they are not fully mixed (see also the results of the Principal Component Analysis of the Galactic line of sight toward W31C presented by Gérin et al. 2016, their Fig. 6). The profile of the H2O+ line has broader wings than that of the H O line, which is expected to trace the densest clouds, but is narrower than the ArH+ line, which traces the almost purely atomic component. This forms a coherent scenario where multi-phase gas components have different scale heights in the disk of the lensing galaxy that is seen approximately face-on.
4.6. Cosmic-ray ionization rate of atomic hydrogen
The abundance ratio of OH+ and H2O+ can also be used to infer the cosmic-ray ionization rate of hydrogen, ζH (Hollenbach et al. 2012; Indriolo et al. 2015). The analytical expression of ζH (Eq. (15) from Indriolo et al. 2015) requires fH2 and xe , as well as the H I column density (Table 4) and the volume density of hydrogen, nH . This latter quantity cannot be constrained from our data, and so we adopt the same value as Indriolo et al. (2015), nH = 35 cm-3 (resulting from a pressure equilibrium statement) for both NE and SW lines of sight, as well as the same efficiency factor ϵ = 0.07 as Indriolo et al. (2015), which takes into account the fact that not all hydrogen ionization results in the formation of OH+.
With these values, we obtain ζH ~ 2 × 10-14 s-1 and ~ 3 × 10-15 s-1 for the southwest and northeast lines of sight, respectively, that is, a decrease by a factor of six between 2 and 4 kpc (assuming that xe and nH are the same). This gradient of ζH is consistent with that observed in the Milky Way (Indriolo et al. 2015). If we roughly interpolate between the few Galactic measurements by Indriolo et al. (2015) at galactocentric radii 0–5 kpc, we find that our values of ζH in the z = 0.89 absorber are slightly higher than in the Milky Way (Fig. 4), although this could be due to uncertainties (assumptions of xe , nH , covering factor, co-spatiality of species) and/or the small number of measurements in Galactic clouds in the inner 5 kpc. We speculate that a higher ζH in the z = 0.89 absorber could be related to a higher average star formation activity than in the Milky Way. Indeed, the differences in elemental isotopic ratios between the z = 0.89 absorber and the Milky Way (e.g., 32S/34S, Muller et al. 2006; 36Ar/38Ar, Müller et al. 2015) already implied that the former experienced phases of high mass star formation.
One possible caveat as pointed out by Hollenbach et al. (2012): when the ionization rate is extreme in Galactic terms, ζH ≥ 10-15 s-1, the electron abundance grows beyond the carbon abundance limit owing to ionization of hydrogen. As a result, OH+ and H2O+ molecules can be destroyed mainly by electrons rather than H2, favoring OH+, with less dependence on the molecular fraction. With such high ionization rates, it would no longer be appropriate to assume an electron fraction as low as 1.5 × 10⁻⁴ and the estimates of fH2 and ζH from the abundance ratio of OH+ and H2O+ may, in fact, be underestimates, as shown by Le Petit et al. (2016) using additional H data and photo-dissociation region models in the central molecular zone in the Milky Way.
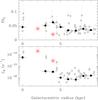 |
Fig. 4 Molecular hydrogen fraction (fH2, top) and cosmic-ray ionization rate (ζH, bottom) vs. galactocentric radius in the z = 0.89 absorber toward PKS 1830–211 (the two red stars) and in the Milky Way (light gray dots: foreground clouds only, taken from Indriolo et al. 2015; black dots: same Galactic entries, but weighted-averaged over 1 kpc bins). |
5. Summary and conclusions
We present ALMA observations of OH+ and H2O+ along two independent sight lines in the z = 0.89 absorber toward the quasar PKS 1830–211. We find:
-
OH+ and H2O+ are both detected along the two lines of sight and, by comparison with other hydrides, show evidence for a multi-phase gas composition in the absorbing gas.
-
The column density ratios between the SW and NE lines of sight increase in a sequence ArH+, OH+, H2Cl+, H2O+, CH, and HF, consistent with our understanding that these hydrides trace gas with an increasing molecular fraction.
-
The abundance ratios between OH+ and H2O+ are used to infer the fraction of molecular hydrogen and cosmic-ray ionization rate in the disk of the absorber. We find values (fH2 = 0.04 and 0.02; ζH ~ 2 × 10-14 s-1 and ~ 3 × 10-15 s-1 for the southwest and northeast lines of sight, respectively) which are comparable to those in the Milky Way at similar galactocentric radii (~ 2 kpc and ~ 4 kpc, respectively). The slightly higher ionization rates found in the z = 0.89 absorber could be related to a higher average star formation activity than in the Milky Way.
-
We revise the rest frequencies of H2O+ lines, although precise laboratory microwave measurements are required to further increase the accuracy.
The number of sources for which observations of OH+ and H2O+ have been reported and where fH2and ζH have been estimated is still limited. The ALMA observations of PKS 1830–211 presented in this paper allow us to investigate fH2and ζH in the disk of a distant z = 0.89 galaxy, and compare them to those in the Milky Way. With the discovery of new high-redshift molecular absorbers, such studies could be drastically extended with ALMA.
Acknowledgments
We thank the anonymous referee for her/his useful comments which helped us to improve the clarity of the manuscript. This paper makes use of the following ALMA data: ADS/JAO.ALMA#2012.1.00056.S, #2013.1.00020.S, and #2015.1.00075.S. ALMA is a partnership of ESO (representing its member states), NSF (USA) and NINS (Japan), together with NRC (Canada) and NSC and ASIAA (Taiwan) and KASI (Republic of Korea), in cooperation with the Republic of Chile. The Joint ALMA Observatory is operated by ESO, AUI/NRAO and NAOJ.
References
- Bekooy, J. P., Verhoeve, P., Meerts, W. L., & Dymanus, A., 1985, J. Chem. Phys., 82, 3868 [NASA ADS] [CrossRef] [Google Scholar]
- Brown, P. R., Davies, P. B., & Stickland, R. J., 1989, J. Chem. Phys., 91, 3384 [NASA ADS] [CrossRef] [Google Scholar]
- Cazzoli, G., Puzzarini, C., Harding, M. E., & Gauss, J. 2009, Chem. Phys. Lett., 473, 21 [NASA ADS] [CrossRef] [Google Scholar]
- Chengalur, J. N., de Bruyn, A. G., & Narasimha, D. 1999, A&A, 343, 79 [Google Scholar]
- Curran, S. J., Reeves, S. N., Allison, J. R., & Sadler, E. M. 2016, MNRAS, 459, 4136 [NASA ADS] [CrossRef] [Google Scholar]
- Dickey, J. M., Strasser, S., Gaensler, B. M., et al. 2009, ApJ, 693, 1250 [NASA ADS] [CrossRef] [Google Scholar]
- Dinelli, B. M., Crofton, M. W., & Oka, T. 1988, J. Mol. Spectrosc., 127, 1 [NASA ADS] [CrossRef] [Google Scholar]
- Gérin, M., de Luca, M., Goicoechea, J. R., et al. 2010, A&A, 521, A16 [NASA ADS] [CrossRef] [EDP Sciences] [Google Scholar]
- Gérin, M., Neufeld, D., & Goicoechea, J. 2016, ARA&A, 54, 181 [NASA ADS] [CrossRef] [Google Scholar]
- González-Alfonso, E., Fischer, J., Bruderer, S., et al. 2013, A&A, 550, A25 [NASA ADS] [CrossRef] [EDP Sciences] [Google Scholar]
- Hollenbach, D., Kaufman, M. J., Neufeld, D. A., et al. 2012, ApJ, 754, 105 [NASA ADS] [CrossRef] [Google Scholar]
- Huet, T. R., Pursell, C. J., Ho, W. C., Dinelli, B. M., & Oka, T. 1992, J. Chem. Phys., 97, 5977 [NASA ADS] [CrossRef] [Google Scholar]
- Huet, T. R., Hadj Bachir, I., Destombes, J.-L., & Vervloet, M. 1997, J. Chem. Phys., 107, 5645 [NASA ADS] [CrossRef] [Google Scholar]
- Indriolo, N., Neufeld, D. A., Gérin, M., et al. 2015, ApJ, 800, 40 [NASA ADS] [CrossRef] [Google Scholar]
- Jin, C., Garrett, M. A., Nair, S., et al. 2003, MNRAS, 340, 1309 [Google Scholar]
- Kawaguchi, K., Muller, S., Black, J. H., et al. 2016, ApJ, 822, 115 [Google Scholar]
- Koopmans, L. V. E., & de Bruyn, A. G. 2005, MNRAS, 360, L6 [NASA ADS] [CrossRef] [Google Scholar]
- Le Petit, F., Ruaud, M., Bron, E., et al. 2016, A&A, 585, A105 [NASA ADS] [CrossRef] [EDP Sciences] [Google Scholar]
- Lew, H. 1976, Can. J. Phys., 54, 2028 [NASA ADS] [CrossRef] [Google Scholar]
- Markus, C. R., Hodges, J. N., Perry, A. J., et al. 2016, ApJ, 817, 138 [NASA ADS] [CrossRef] [Google Scholar]
- Martí-Vidal, I., Vlemmings, W., Muller, S., & Casey, S. 2014, A&A, 563, A136 [NASA ADS] [CrossRef] [EDP Sciences] [Google Scholar]
- McElroy, D., Walsh, C., Markwick, A. J., et al. 2013, A&A, 550, A36 [NASA ADS] [CrossRef] [EDP Sciences] [Google Scholar]
- Müller, H. S. P., Schlöder, F., Stutzki, J., & Winnewisser, G. 2005, J. Mol. Struct., 742, 215 [NASA ADS] [CrossRef] [Google Scholar]
- Muller, S., & Guélin, M. 2008, A&A, 491, 739 [NASA ADS] [CrossRef] [EDP Sciences] [Google Scholar]
- Muller, S., Guélin, M., Dumke, M., et al. 2006, A&A, 458, 417 [NASA ADS] [CrossRef] [EDP Sciences] [Google Scholar]
- Muller, S., Beelen, A., Guélin, M., et al. 2011, A&A, 535, A103 [NASA ADS] [CrossRef] [EDP Sciences] [Google Scholar]
- Muller, S., Beelen, A., Black, J. H., et al. 2013, A&A, 551, A109 [NASA ADS] [CrossRef] [EDP Sciences] [Google Scholar]
- Muller, S., Combes, F., Guélin, M., et al. 2014a, A&A, 566, A112 [NASA ADS] [CrossRef] [EDP Sciences] [Google Scholar]
- Muller, S., Black, J. H., Guélin, M., et al. 2014b, A&A, 566, A6 [Google Scholar]
- Muller, S., Kawaguchi, K., Black, J. H., & Amano, T. 2016, A&A, 589, L5 [NASA ADS] [CrossRef] [EDP Sciences] [Google Scholar]
- Müller, H. S. P., Muller, S., Schilke, P., et al. 2015, A&A, 582, A4 [Google Scholar]
- Mürtz, P., Zink, L. R., Evenson, K. M., & Brown, J. M. 1998, J. Chem. Phys., 109, 9744 [NASA ADS] [CrossRef] [Google Scholar]
- Nair, S., Jin, C., & Garrett, M. A. 2005, MNRAS, 362, 1157 [NASA ADS] [CrossRef] [Google Scholar]
- Neufeld, D. A., Goicoechea, J. R., Sonnentrucker, P., et al. 2010, A&A, 521, L10 [NASA ADS] [CrossRef] [EDP Sciences] [Google Scholar]
- Ossenkopf, V., Müller, H. S. P., Lis, D. C., et al. 2010, A&A, 518, A111 [Google Scholar]
- Pickett, H. M. 1991, J. Mol. Spectr., 148, 371 [NASA ADS] [CrossRef] [Google Scholar]
- Riechers, D. A., Bradford, C. M., Clements, D. L., et al. 2013, Nature, 496, 329 [Google Scholar]
- Schilke, P., Lis, D. C., Bergin, E. A., Higgins, R., & Comito, C. 2013, J. Phys. Chem. A, 117, 9766 [CrossRef] [PubMed] [Google Scholar]
- Schilke, P., Neufeld, D. A., Müller, H. S. P., et al. 2014, A&A, 566, A29 [NASA ADS] [CrossRef] [EDP Sciences] [Google Scholar]
- Schulz, A., Henkel, C., Menten, K. M., et al. 2015, A&A, 574, A108 [NASA ADS] [CrossRef] [EDP Sciences] [Google Scholar]
- Sheffer, Y., Rogers, M., Federman, S. R., et al. 2008, ApJ, 687, 1075 [NASA ADS] [CrossRef] [Google Scholar]
- Staikova, M., Engels, B., Peric, M., & Peyerimhoff, S. D. 1993, Mol. Phys., 80, 1485 [NASA ADS] [CrossRef] [Google Scholar]
- Strahan, S. E., Mueller, R. P., & Saykally, R. J. 1986, J. Chem. Phys., 85, 1252 [NASA ADS] [CrossRef] [Google Scholar]
- Tanaka, K., Harada, K., & Oka, T. 2013, J. Phys. Chem. A, 117, 9584 [CrossRef] [Google Scholar]
- van der Werf, P. P., Isaak, K. G., Meijerink, R., et al. 2010, A&A, 518, A42 [NASA ADS] [CrossRef] [EDP Sciences] [Google Scholar]
- Weis, B., Carter, S., Rosmus, P., Werner, H.-J., & Knowles, P. J. 1989, J. Chem. Phys., 91, 2818 [NASA ADS] [CrossRef] [Google Scholar]
- Weiß, A., De Breuck, C., Marrone, D. P., et al. 2013, ApJ, 767, 88 [NASA ADS] [CrossRef] [Google Scholar]
- Werner, H.-J., Rosmus, P., & Reinsch, E.-A. 1983, J. Chem. Phys., 79, 905 [NASA ADS] [CrossRef] [Google Scholar]
- Wiklind, T., & Combes, F. 1998, ApJ, 500, 129 [NASA ADS] [CrossRef] [Google Scholar]
- Winn, J. N., Kochanek, C. S., McLeod, B. A., et al. 2002, ApJ, 575, 103 [NASA ADS] [CrossRef] [Google Scholar]
- Wyrowski, F., Menten, K. M., Güsten, R., & Belloche, A. 2010, A&A, 518, A26 [NASA ADS] [CrossRef] [EDP Sciences] [Google Scholar]
- Yang, C., Gao, Y., Omont, A., et al. 2013, ApJ, 771, 24 [Google Scholar]
- Zheng, R., Li, S., Hou, S.-Y., Huang, G.-M., & Duan, C.-X. 2008, Chin. Phys. B, 17, 4485 [NASA ADS] [CrossRef] [Google Scholar]
Appendix A: Laboratory spectroscopic details of H2O+
The initial CDMS entry (version 1) was derived using extrapolated field-free transition frequencies from the laser magnetic resonance (LMR) study of Mürtz et al. (1998). These authors also used data from the earlier LMR study of Strahan et al. (1986), but only reported the calculated frequencies for the 111–000 transitions. The data set also included infrared (IR) data from Dinelli et al. (1988) (ν3), Brown et al. (1989) (ν2), Huet et al. (1992) (ν1 and ν3), and Zheng et al. (2008) (ν2). Furthermore, it included ground state combination differences (GSCDs) from the A−X electronic spectrum in the near-infrared (Lew 1976; Huet et al. 1997). Spectroscopic parameters were determined using Pickett’s SPFIT program (Pickett 1991) which can only deal with field-free data, as is the case for most spectroscopy programs. Starting parameters were taken from Mürtz et al. (1998) for the ground vibrational state and from Huet et al. (1992) and Zheng et al. (2008) for the excited vibrational states. Using considerably more IR data than Mürtz et al. (1998), they only used GSCDs from Dinelli et al. (1988), and, in addition, extensive GSCDs derived from Huet et al. (1997), but we could only use a small part of the Strahan et al. (1986) data, as the set of spectroscopic parameters differed somewhat from the initial set of parameters. Some changes were caused by using common parameters for all or most states for some parameters which were only poorly determined (mostly parameters of a higher order).
Although our ALMA data for H2O+ can be modeled much better with the old CDMS data than with the frequencies derived from Mürtz et al. (1998), the model was not satisfactory. Furthermore, Neufeld et al. (2010) suggested from observations of the OH+ 1−0 transition and of ortho-H2O+ near 1115 GHz with Herschel that the rest frequencies of the latter cation should be shifted up in frequency by 5 MHz. We decided to use these data to refine the spectroscopic parameters of H2O+. The new or modified frequencies were accomodated quite well. Having shifted the J = 1.5–0.5 group of lines of the 111–000 transition near 1115 GHz, the question remained of how to treat the J = 0.5–0.5 group of lines near 1140 GHz. Shifting them also up by 5 MHz deteriorated the fit marginally and reproduced the ΔJ = ±1 FS lines of the 110–101 transition less well by approximately 0.6 MHz. Shifting the 1140 GHz group of lines down by 5 MHz improved the fit marginally and improved reproduction of the ΔJ = ±1 FS lines of the 110–101 transition by about 0.6 MHz. The 1140 GHz group of lines does not shift appreciably from the positions reported by Mürtz et al. (1998) if they were weighted out of the fit. Therefore, we propose tentatively that frequencies of the 1140 GHz group of lines may be somewhat lower (around 5 MHz, possibly more) than the frequencies reported by Mürtz et al. (1998). Additional data, preferably from laboratory measurements with microwave accuracy, should be able to resolve the frequency issues of these lowest energy transitions. Until then, we recommend our ALMA rest frequencies for the 110–101 transition and the newly calculated ones for all other transitions.
The number of independent spectroscopic parameters did not change with respect to those used for version 1 of the CDMS entry of H2O+. However, two ground state parameters (φK and φNK) were replaced by two others (ΦKN and LKKN). We report the resulting spectroscopic parameters in Table A.2 and will provide the line, parameter, and fit files in the CDMS catalog archive3. The intensities were calculated using the quantum chemically calculated value of the dipole moment from Weis et al. (1989) as previously.
Spectroscopic parameters (cm-1, MHz) of H2O+ in the ground and excited vibrational states.
All Tables
Spectroscopic parameters (cm-1, MHz) of H2O+ in the ground and excited vibrational states.
All Figures
|
Fig. 1 Spectra of OH+ and H2O+ (only the 607 GHz transition is shown) toward PKS 1830–211 southwest (top) and northeast (bottom) images. The hyperfine structure (hfs) for OH+ is indicated, with the relative strengths expected when the sublevels are populated in proportion to their statistical weights. The spectra corresponding to the strongest OH+ hfs component, after hfs deconvolution, are shown in dotted lines. Spectra of other species are shown for comparison. |
| In the text | |
|
Fig. 2 Spectra of the four H2O+ lines toward PKS 1830–211(SW) (top) and PKS 1830–211(NE) (bottom) using current CDMS frequencies (left) and revised frequencies (right) as given in Table 3. The 607 GHz line profile has been scaled down by the ratios of relative strengths. |
| In the text | |
|
Fig. 3 Spectra of H2O (top: toward the southwest image of PKS 1830–211; bottom: toward the northeast image) and CH (middle: toward the southwest image) at several epochs between 2014 and 2016. |
| In the text | |
|
Fig. 4 Molecular hydrogen fraction (fH2, top) and cosmic-ray ionization rate (ζH, bottom) vs. galactocentric radius in the z = 0.89 absorber toward PKS 1830–211 (the two red stars) and in the Milky Way (light gray dots: foreground clouds only, taken from Indriolo et al. 2015; black dots: same Galactic entries, but weighted-averaged over 1 kpc bins). |
| In the text | |
Current usage metrics show cumulative count of Article Views (full-text article views including HTML views, PDF and ePub downloads, according to the available data) and Abstracts Views on Vision4Press platform.
Data correspond to usage on the plateform after 2015. The current usage metrics is available 48-96 hours after online publication and is updated daily on week days.
Initial download of the metrics may take a while.