Fig. 1
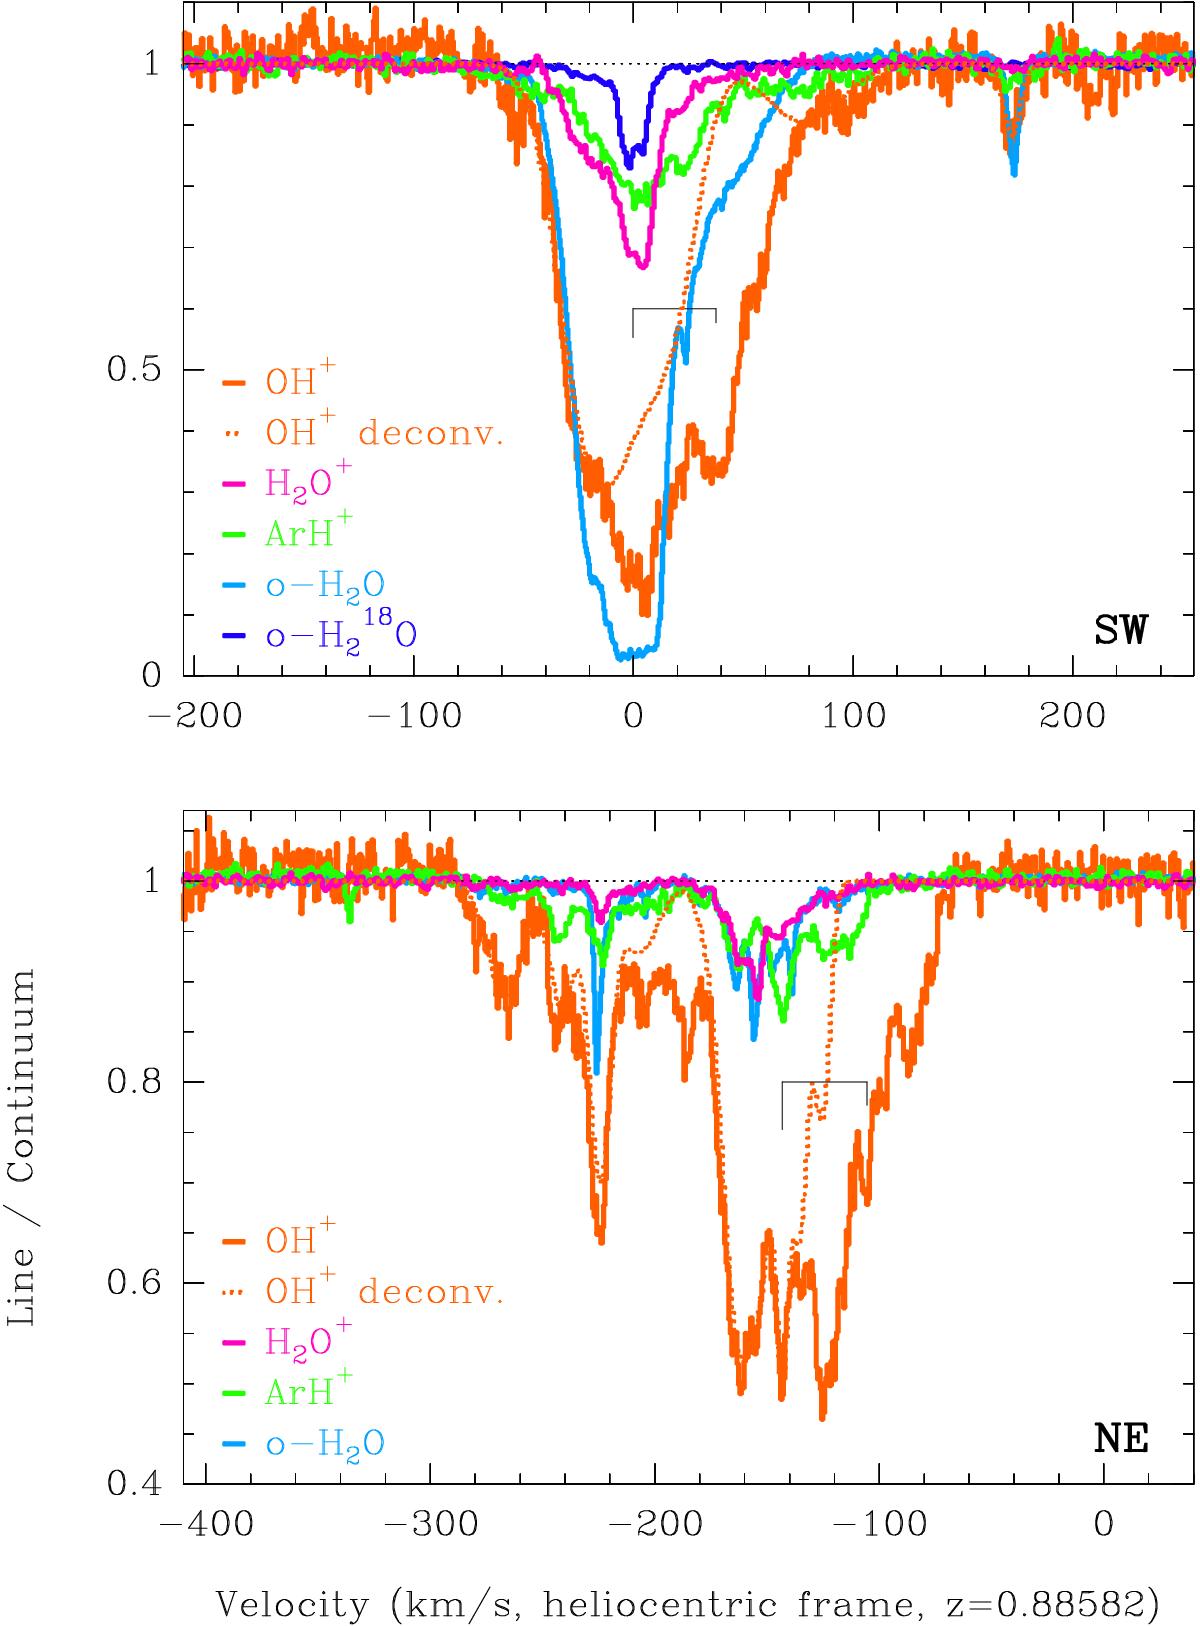
Spectra of OH+ and H2O+ (only the 607 GHz transition is shown) toward PKS 1830–211 southwest (top) and northeast (bottom) images. The hyperfine structure (hfs) for OH+ is indicated, with the relative strengths expected when the sublevels are populated in proportion to their statistical weights. The spectra corresponding to the strongest OH+ hfs component, after hfs deconvolution, are shown in dotted lines. Spectra of other species are shown for comparison.
Current usage metrics show cumulative count of Article Views (full-text article views including HTML views, PDF and ePub downloads, according to the available data) and Abstracts Views on Vision4Press platform.
Data correspond to usage on the plateform after 2015. The current usage metrics is available 48-96 hours after online publication and is updated daily on week days.
Initial download of the metrics may take a while.