Free Access
Fig. 2
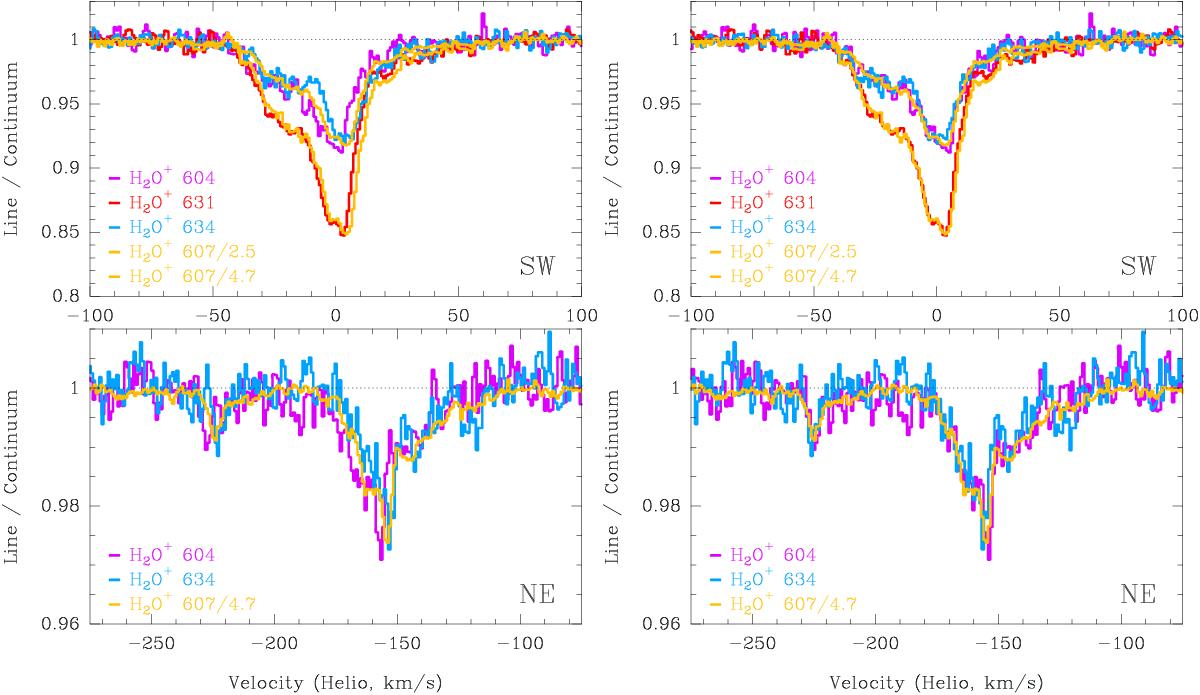
Spectra of the four H2O+ lines toward PKS 1830–211(SW) (top) and PKS 1830–211(NE) (bottom) using current CDMS frequencies (left) and revised frequencies (right) as given in Table 3. The 607 GHz line profile has been scaled down by the ratios of relative strengths.
This figure is made of several images, please see below:
Current usage metrics show cumulative count of Article Views (full-text article views including HTML views, PDF and ePub downloads, according to the available data) and Abstracts Views on Vision4Press platform.
Data correspond to usage on the plateform after 2015. The current usage metrics is available 48-96 hours after online publication and is updated daily on week days.
Initial download of the metrics may take a while.