| Issue |
A&A
Volume 591, July 2016
|
|
|---|---|---|
| Article Number | A17 | |
| Number of page(s) | 7 | |
| Section | Interstellar and circumstellar matter | |
| DOI | https://doi.org/10.1051/0004-6361/201628113 | |
| Published online | 03 June 2016 | |
Silicate condensation in Mira variables
1
Universität Heidelberg, Zentrum für Astronomie, Institut für
Theoretische Astrophysik, Albert-Ueberle-Str. 2, 69120
Heidelberg,
Germany
e-mail: This email address is being protected from spambots. You need JavaScript enabled to view it.
2
University of Sydney, Sydney Institute for
Astronomy, Sydney
NSW
2006,
Australia
3
Universität Heidelberg, Kirchhoff-Institut für
Physik, Im Neuenheimer Feld
227, 69120
Heidelberg,
Germany
Received: 12 January 2016
Accepted: 15 April 2016
Abstract
Context. The formation of dust in winds of cool and highly evolved stars and the rate of injection of dust into the interstellar medium is not yet completely understood, despite the importance of the process for the evolution of stars and galaxies. This holds in particular for oxygen-rich stars, where it is still not known which process is responsible for the formation of the necessary seed particles of their silicate dust.
Aims. We study whether the condensation of silicate dust in Mira envelopes could be caused by cluster formation by the abundant SiO molecules.
Methods. We solve the dust nucleation and growth equations in the co-moving frame of a fixed mass element for a simplified model of the pulsational motions of matter in the outer layers of a Mira variable, which is guided by a numerical model for Mira pulsations. It is assumed that seed particles form through the clustering of SiO. The calculation of the nucleation rate is based on published experimental data. The quantity of dust formed is calculated via a moment method and the calculation of radiation pressure on dusty gas is based on a dirty silicate model.
Results. Dust nucleation occurs in the model at the upper culmination of the trajectory of a gas parcel where it stays for a considerable time at low temperatures. Subsequent dust growth occurs during the descending part of the motion and continues after the next shock reversed motion. It is found that sufficient dust forms that radiation pressure exceeds the gravitational pull of the stars such that the mass element is finally driven out of the star.
Conclusions. Nucleation of dust particles by clustering of the abundant SiO molecules could be the mechanism that triggers silicate dust formation in Miras.
Key words: circumstellar matter / stars: mass-loss / stars: winds, outflows / stars: AGB and post-AGB / solid state: refractory
© ESO, 2016
1. Introduction
Outflow of matter from highly evolved stars is generally observed to be accompanied by copious dust formation. Since the gas streaming out of a stellar atmosphere is free from condensation seeds, the first step in the dust condensation process must be the formation of seed particles, followed by precipitation of condensable material on freshly created surfaces. What one directly sees in observations is the outcome of the second step, the growth of dust grains. In case of late-type M stars, one observes that the dominating dust components formed in the outflow are magnesium-iron-silicates (see Molster et al. 2010,for a review on observations). Laboratory investigations of presolar silicate dust grains from asymptotic giant branch (AGB) stars have shown that usually Mg-Fe-silicates are formed (Vollmer et al. 2009; Nguyen et al. 2010; Bose et al. 2010), which have widely varying iron content where iron-poor grains are rare.
The first step, the nucleation process, is not observable (at least for now). Among all the gas-phase species of refractory elements that could be involved in this process, SiO is one of the most abundant. For this reason, it has been often discussed whether cluster formation by this species is the starter reaction for the sequence of processes that ultimately leads to the condensation of silicate dust particles (Donn et al. 1981; Nuth & Donn1982, 1983; Gail & Sedlmayr 1986, 1998a,b; Ali & Castleman 2005; Nuth & Ferguson 2006; Reber et al. 2006; Paquette et al. 2011; Gail et al. 2013), although other possibilities have also been discussed recently (Goumans & Bromley 2012; Plane 2013; Bromley et al. 2014; Gobrecht et al. 2016).
In Gail et al. (2013), we studied nucleation of SiO as the primary dust formation stage in oxygen-rich environments on the basis of our recent measurements of the vapour pressure of solid SiO (Wetzel et al. 2012). We derived an empirical nucleation rate for SiO from a re-evaluation of the experimental data for SiO nucleation of Nuth & Donn (1982). We calculated stationary wind models with nucleation and dust growth and found that SiO nucleation as the trigger for the condensation of silicate dust in M stars is not as unlikely as previously thought. The previous calculations (Gail & Sedlmayr 1986) resulted in condensation temperatures that were far too low because they were based on a vapour pressure measurement for SiO (Schick 1960) that yielded unrealistically high values. With revised data on SiO vapour pressure, the onset of dust formation already occurs at temperatures close to dust temperatures of 800 K to 950 K at the inner edge of dust shells, as derived by fitting radiative transfer models to observed infrared spectra from dusty stars (e.g. Groenewegen et al. 2009). These results suggest that nucleation by SiO may in fact provide the necessary seeds for silicate dust growth. A similar conclusion was arrived at in a different way by Nuth & Ferguson (2006).
While stationary wind models may be fair approximations for the outflows from supergiants, which do not show strong variations or shock structure in their upper atmospheres (Arroyo-Torres et al. 2015), the atmospheres of Mira variables are characterized by large pulsational excursions of the matter in the outer atmospheres and envelopes during a pulsation cycle and by a series of shocks propagating outwards. Miras represent the largest group of dust enshrouded oxygen-rich stars, thus it is important to know their dust formation mechanisms. Therefore we attempt to model dust condensation in such objects based on the assumption that cluster formation by SiO is the trigger for silicate dust formation. As a first step we study a simple ballistic model for the motion of the gas during a pulsation cycle and study dust formation by following a fixed gas parcel. The ballistic model is guided by the Mira pulsation models described in Ireland & Scholz (2006) and Ireland et al. (2008, 2011). A consistent implementation of dust formation in the pulsation code would be desirable, but this is presently not available.
We also show that, for pulsating stars, the assumption of seed particle formation by SiO nucleation seems to yield results that are in accord with what one observes for dust forming Miras. This suggests that SiO nucleation also provides the seed particles for silicate dust formation in that case.
2. The model
2.1. Mira model
We assume, for simplicity, spherical symmetry of the star and its outflow and use a typical atmospheric model of the CODEX series published by Ireland et al. (2008, 2011). The CODEX models cover several cycles of Mira variables, based on a self-excited pulsation model for four different non-pulsating so-called parent stars (mass M, luminosity Lp, and radius Rp). We assume solar element abundances (cf. Scholz et al. 2014, for effects of moderate abundances changes). The non-grey atmospheric stratification was computed up to 5 Rp above which a variation T(r) ∝ r− 1 / 2 with radial distance r may be assumed. We choose for the present study the four-cycle tight phase coverage (39 phases from −0.20 to 3.61) of the model Mira o54 of which the parent star has parameters close to the Mira prototype o Cet (M = 1.1 M⊙, Lp = 5400 L⊙, and Rp = 216 R⊙). The luminosities L, the τRoss = 1 Rosseland stellar radii R, and the effective temperatures Teff ∝ (L/R2)1 / 4 of these 39 atmospheric models, as well as the positions of shock fronts at each pulsation phase, are given in Table 4 of Ireland et al. (2011). Figure 1 shows the temperature stratifications of these models.
Since test calculations show that a time interval of about five pulsation periods is needed to follow the formation and final outflow of typical dust particles, we extended the phase coverage (−0.20 to 3.61) of the o54 model by assuming that model stratifications at phases 3.80 to 5.00 may be approximated by stratifications at phases −0.20 to 1.00. In fact, inspection of shock fronts and stratifications shows that, by using this phase extrapolation, one obtains a smooth and very reasonable transition from phase 3.61 to phase 3.80, which should be perfectly sufficient to study the typical behaviour of a dust particle over five pulsation periods.
Figure 1 shows, for phases −0.20 to 3.60, the temperature as a function of position R/Rp and of pressure p. The typical decrease of T(r) is strongly related to the position of shock fronts and to the absorption of molecular bands (in particular H2O in high layers and CO).
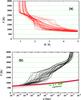 |
Fig. 1 a) Radial variation of temperature for a number of pulsation phases covering the phase range from Φ = −0.20 to Φ = 3.61 (extrapolated between 5 an 6 R∗). b) Run of pressure and temperature for the pulsation model at different phases of the pulsation cycle between Φ = −0.2 and φ = 3.8 (solid black lines). The nearly horizontal red lines correspond to lines of constant normalized nucleation rate with values between 10-34 and 10-12 particles per second and per H nucleus in steps of 10-2. The blue line corresponds to the onset of avalanche nucleation with a rate of 10-20 s-1 and per H nucleus. The experimental data of Nuth & Donn (1982) are indicated by green circles. The green line corresponds to the upper green line in Fig. 2. |
2.2. Ballistic model
The formation of silicate dust is modelled for a fixed gas parcel from the outer layers of a pulsating star. We follow the parcel as it moves upwards and downwards and traces varying temperature and density conditions along its trajectory. We model the formation of dust within the parcel by calculating the nucleation rate by SiO and solving a set of moment equations for dust growth. From this we calculate the radiation pressure on the gas-dust mixture in the tight momentum coupling approximation.
We consider a ballistic model to check the effect of radiation pressure on the dynamics of the flow. This is based on the fact that in the envelope of a pulsating star the trajectory of a gas element follows a ballistic trajectory for most of the time; pressure effects only become important in the vicinity of the shock (Bertschinger & Chevalier 1985). This allows one to start for a particular pulsation phase Φ at some radius r and take the velocity and density at that place and instant from the pulsation model. Then one solves the equation of motion for the gas parcel for these initial conditions to obtain the trajectory of the gas parcel. The local density in the parcel follows from the continuity equation in Lagrangian coordinates. The temperature at each step is determined by interpolation from the pulsation model. If the temperature has to be extrapolated beyond the model boundary, we assume T ∝ r− 1 / 2 (see Sect. 2.1). The pressure follows from the ideal gas equation.
The calculated trajectory closely follows the trajectory of that gas parcel in the pulsation model until the next shock overruns the gas parcel. Since shocks are not part of our simple ballistic model, we have to introduce them artificially by adding a suitable velocity jump Δv> 0 to the velocity at the instant where the trajectory meets the next shock. The velocity increment Δv required to follow the after-shock trajectory of the parcel in the pulsation model should ideally equal the velocity jump Δv of the pulsation model. In practice we need a slightly higher value because the ballistic model neglects pressure effects in the vicinity of the shock and, therefore, does not completely reproduce the true motion in this limited region.
If radiation pressure is included in solving the equation of motion and if this force exceeds gravitational attraction from some point in time, the trajectory starts to level off from a trajectory that does not include this force and is then rapidly driven out of the star. If this kind of behaviour is detected, we interpret this as an indication that an outflow is driven by dust condensation. It is, however, not possible to derive the properties of this outflow from our simplified model. We can presently only check whether a pulsationally supported, dust-driven outflow is possible in principle.
The equations for the ballistic model are given in Ferrarotti & Gail (2006). We consider, for simplicity, only the formation of a single amorphous silicate dust component. An iron-rich composition is assumed since presolar silicate grains from AGB stars have significant iron contents (Vollmer et al. 2009; Nguyen et al. 2010; Bose et al. 2010) and are only iron poor rarely. The dust opacity required for calculating the radiation pressure is calculated with the complex index of refraction of the dirty silicate model of Ossenkopf et al. (1992, their set 1). The details of the opacity calculation are discussed in Gail et al. (2013). Bladh & Höfner (2012) argue that such iron bearing silicates cannot drive a wind because they vaporize at the close distances where the wind acceleration has to start. We note, however, that for silicates of lower iron content (e.g. the x = 0.7 data from Dorschner et al. 1995) than used in the Bladh et al. study (x = 0.5), the radiative equilibrium temperature of the dust is lower by ≳150 K such that this problem does not exist in our calculations.
2.3. Nucleation by SiO
The dust formation is treated as a two-step process: (1) formation of seed particles from the gas phase and (2) precipitation of condensable material on the seed particles.
Our basic assumption is that cluster formation by SiO molecules is responsible for the
onset of dust formation. We discussed this in Gail et al.
(2013) and derived an empirically determined nucleation rate of 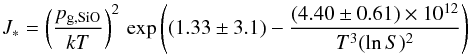 (1)(in units cm-3 s-1) following the suggestions of
Nuth & Donn (1982) and using their
experimental data, but now based on the redetermination of the vapour pressure of solid
SiO by Wetzel et al. (2012) and Gail et al. (2013); see also Nuth & Ferguson (2006) and Ferguson
& Nuth (2008). Here S =
pvap/pg,SiO
is the supersaturation ratio, determined by the vapour pressure
(1)(in units cm-3 s-1) following the suggestions of
Nuth & Donn (1982) and using their
experimental data, but now based on the redetermination of the vapour pressure of solid
SiO by Wetzel et al. (2012) and Gail et al. (2013); see also Nuth & Ferguson (2006) and Ferguson
& Nuth (2008). Here S =
pvap/pg,SiO
is the supersaturation ratio, determined by the vapour pressure 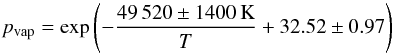 (2)of SiO (in cgs-units) and the partial
pressure pg,SiO of SiO in the gas phase. The latter
has to be determined from a calculation of the composition of the gas phase. The formal
similarity of Eq. (1) with an equation from
classical nucleation theory does not mean that we use classical nucleation theory. Our
nucleation rate is a fit formula to experimental data.
(2)of SiO (in cgs-units) and the partial
pressure pg,SiO of SiO in the gas phase. The latter
has to be determined from a calculation of the composition of the gas phase. The formal
similarity of Eq. (1) with an equation from
classical nucleation theory does not mean that we use classical nucleation theory. Our
nucleation rate is a fit formula to experimental data.
Figure 1b shows lines of constant values of the normalized nucleation rate J∗/NH (where NH is the density of H nuclei) in the p-T-plane and also the run of pressure and temperature in the outer layers of the Mira pulsation model for a number of different phases in the pulsation cycle. The circles show the experimental data to which the approximation for the nucleation rate is fitted. An application to astrophysical condensation conditions requires that we apply the nucleation model, Eq. (1), to a pressure regime with pressures of about a factor of 10-4 times lower than the conditions under which the experimental data where acquired, while temperatures are about the same. Despite the uncertainties involved in such extrapolations we apply the empirical nucleation model since no better information is presently available.
The blue line corresponds to the onset of avalanche nucleation, defined here as that rate at which a few times 10-13 dust particles per H nucleus are formed within one year. This corresponds to the typical value of 7.6 × 10⁻¹³ dust particles per H-nucleus in outflows from oxygen-rich stars as derived by Knapp (1985) from observations. For our numerical Mira pulsation model, the outer layers of the model extend into the region where efficient nucleation of SiO is predicted by the empirical nucleation rate, Eq. (1). This means that the trajectories of gas parcels moving up and down during the pulsation cycle traverse beyond r ≳ 5Rp, which is a region of the p-T-plane where, at the same time, (1) temperatures are low enough and (2) densities are high enough for efficient SiO nucleation to be possible.
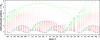 |
Fig. 2 Trajectories of two different mass elements (solid green lines). The crosses correspond to the grid points of the pulsation model (Ireland et al. 2008, 2011). Green crosses correspond to outwards directed velocity, red crosses to inwards directed velocity. Circles roughly indicate the location of shock fronts. The kink in the lower trajectory is due to the shock hitting the gas parcel at phase Φ ≈ 3.55. |
Unfortunately the outer part of the model calculation does not extend deep into the region beyond avalanche nucleation. This requires that we consider trajectories that extend slightly beyond the outer border of the numerical pulsation model for our calculation of dust condensation in a gas parcel. The temperature is determined in that region by extrapolation assuming a T ∝ r− 1 / 2 dependency (see Sect. 2.1). Since no strong extrapolation is required, this is probably not critical.
Basic data used for calculating olivine condensation.
2.4. Particle growth
The second essential step for dust formation is the growth of seed particles to macroscopic dust grains. We presently do not know at which size the SiO clusters start to react with other species from the gas phase to incorporate additional oxygen to build the SiO4-tetrahedron of silicates and to incorporate cations such as Mg2+ or Fe2+ to form silicates. We assume here that this transition from cluster growth to silicate particle growth already occurs at rather small sizes such that the transition stage is not important for calculating the precipitation of the bulk of the silicate material.
From laboratory investigations of silicate dust grains from AGB stars (found as presolar
grains in meteorites) we know that Mg-Fe-silicates are usually formed with widely varying
iron content, where iron-poor grains are rare (Vollmer et
al. 2009; Nguyen et al. 2010; Bose et al. 2010). For simplicity, it is assumed here
that olivine with composition MgFeSiO4 is formed. The corresponding basic chemical reaction is
 (3)This is the net outcome of a series of
reaction steps operating on the surface of a grain, the details of which are presently not
known. The experimental observations with respect to the inverse process, evaporation of
olivine, by Nagahara et al. (1994) and Nagahara & Ozawa (1996), indicate that the
attachment of SiO to the surface of a grain is the rate determining reaction step. The
corresponding growth rate for a single dust grain then is (neglecting evaporation)
(3)This is the net outcome of a series of
reaction steps operating on the surface of a grain, the details of which are presently not
known. The experimental observations with respect to the inverse process, evaporation of
olivine, by Nagahara et al. (1994) and Nagahara & Ozawa (1996), indicate that the
attachment of SiO to the surface of a grain is the rate determining reaction step. The
corresponding growth rate for a single dust grain then is (neglecting evaporation)
 (4)where a is the grain radius. Here
αv is the growth coefficient and
V1 =
AdmH/ρc
the volume occupied by a chemical formula unit (atomic weight Ad) in the solid
condensed phase. The details are discussed, e.g. in Ferrarotti & Gail (2006) and Gail &
Sedlmayr (2013), and the numerical values of the coefficients used for the model
calculation are given in Table 1. The condensation
coefficient α
is still not accurately known. Experimental values between 0.12 and 0.025 are given, e.g.
in Tachibana et al. (2014). We use a value of 0.1
because lower values would result in dust formation efficiencies that are too low.
(4)where a is the grain radius. Here
αv is the growth coefficient and
V1 =
AdmH/ρc
the volume occupied by a chemical formula unit (atomic weight Ad) in the solid
condensed phase. The details are discussed, e.g. in Ferrarotti & Gail (2006) and Gail &
Sedlmayr (2013), and the numerical values of the coefficients used for the model
calculation are given in Table 1. The condensation
coefficient α
is still not accurately known. Experimental values between 0.12 and 0.025 are given, e.g.
in Tachibana et al. (2014). We use a value of 0.1
because lower values would result in dust formation efficiencies that are too low.
The growth of an ensemble of dust grains and radiation pressure on the dusty gas then are calculated by a moment method analogous to that described in Gail & Sedlmayr (1985).
3. Model results
Figure 2 shows for the pulsation model, as small crosses, the radial grid points of the model for a set of different phases Φ within the pulsation cycle. The crosses are shown in green if the velocity at that point is directed outwards and in red for inwards directed velocity. The grid points where there is a high velocity jump to the next grid points are encircled.
It is evident from Fig. 1b that efficient seed particle formation by SiO clustering requires that the temperature in the gas drops below about 800 K. From the run of temperature shown in Fig. 1a it follows that during the upwards and downwards motion of a mass element in the pulsating envelope its trajectory has to reach its upper culmination point at a distance at least beyond four to five stellar radii to visit the region of sufficiently low temperature before falling back into higher temperature regions.
A trajectory that accomplishes this requirement can be constructed for the pulsation model as follows: For some phase where the velocity is outwards directed at the upper boundary at 5Rp of the pulsation model, we solve the equation of motion for a gas parcel with the model velocity as initial condition, but in backwards direction, until the temperature becomes too high for nucleation to be possible. Usually we take 0.8 of the initial radius as the end point of the inwards integration. Then we start with the velocity obtained at this point as an initial condition an outwards integration of the equation of motion simultaneously with the set of equations for dust formation and growth within the gas parcel. The integration is continued until one of the following cases is encountered:
-
1.
The gas parcel is overrun by a shock front.
-
2.
The gas parcel falls back to distances where all dust is evaporated.
-
3.
Sufficient dust is formed such that radiation pressure drives the gas parcel out of the star.
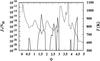 |
Fig. 3 Variation of gas temperature (dashed line) and dust particle formation rate (solid line) in the gas parcel along the lower trajectory in Fig. 2. The abscissa is the phase of the pulsation. The left ordinate is the dust particle formation rate in particles per H nucleus and per second. |
Figure 2 shows two such trajectories. The gas parcel crossing the boundary r = 5Rp at phase φ = 0.49 in the model forms sufficient dust to be expelled by radiation pressure already before the next shock arrives. The parcel crossing the boundary at phase φ = 0.70 falls back until it is hit by a shock. The starting point in both cases was searched for by integrating backwards in time from r = 5Rp to r ~ 4Rp and then all equations inclusive dust formation are solved forwards in time. The intersection of the two trajectories in Fig. 2 results from the fact that our simplified model does not account for the dynamical back-reaction of the dust on hydrodynamics. In a consistent model such a situation would either be avoided or a shock would be created.
Through continued dust growth, radiation pressure from some instant exceeds the gravitational pull by the star and the gas parcel finally is expelled. The wind-driving capability of the dust can only be seen in the accelerated outwards motion of dust relative to the gas because acceleration of the gas by frictional coupling to dust is not included in the ballistic model.
Figure 3 shows for the lower trajectory in Fig. 2 the variation of the gas temperature during the course of the motion of the gas parcel. The temperature appears strongly fluctuating with phase. This is a property of the temperature in the outer layers of the pulsation model, which is also apparent in Fig. 1. The figure also shows the variation of the normalized seed particle formation rate J∗/NH during the course of the motion of the gas parcel. The rise and fall of the nucleation rate seen in the figure reflects the temporary excursion into the low temperature range.
Around the maximum outwards excursion of the gas element the temperature becomes rather low and there is a burst of seed particle formation. Additional but weaker bursts occur at some later low-temperature episodes. Overall, seed particles are formed in this model intermittently. Beyond maximum outwards excursion the temperature raises again during fallback of the parcel. It does not increase, however, to such high values that the freshly formed dust disappears from evaporation before the next shock arrives; this would require temperatures above ≈1100 K. Instead the next shock throws the element back to low temperatures. As Fig. 3 shows a new period of nucleation starts, which is inconsequential, however, because the bigger grains formed during the first nucleation period preferentially take up the condensable material.
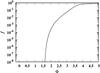 |
Fig. 4 Dust condensation along the lower particle trajectory in Fig. 2. The abscissa is the phase of the pulsation. The ordinate is the fraction of the Si condensed into silicate dust. |
Figure 4 shows the variation of the fraction f of all Si that is condensed into silicate grains (the degree of condensation) during the course of the motion of the parcel. After the first burst of seed particle formation the degree of condensation f rapidly increases but remains rather low because in a stellar envelope the particle densities are low if the temperature is low, such that the rate at which condensable material precipitates on the seed particles remains low. It is only if the gas parcel falls back and the gas is compressed and particle densities increase again that the growth rate progressively increases. This results from the fact that, as long as one is not close to the evaporation limit of the bulk condensate, particle growth depends more strongly on density than on temperature, such that reheating after seed particle formation only suppresses nucleation, but not particle growth. The final levelling off of the condensation curve seen in the figure results from the rapid expansion of the gas after shock arrival.
4. Discussion
The calculation shows that, even though seed particle formation by SiO requires rather low gas temperatures (≲800 K), if applied to a pulsation model with such properties as o Ceti this process results in sufficient final dust production to drive a gas parcel out of the star. This is the necessary prerequisite in order that nucleation by the abundant SiO molecules and subsequent growth of magnesium-iron silicates on these seed particles could be responsible for the pulsation-supported, dust-driven winds of Miras.
Distance, R, in units of the photospheric radius, Rp, and temperature of inner edge, Ti, of silicate and aluminium dust shell as derived from interferometer observations of Mira variables.
In this model a lot of dust particles are found at distances closer to the star than the distance of the layer where the seed particles for dust are formed. The initial growth from seeds to macroscopic grains occurs on the descending part of the trajectory of a gas element that executes the up and down motions in the outermost layers of a pulsating star. The downwards motion moves the dust closer to the star where it becomes hotter and may evaporate if it is not blown out as in the cases shown in Fig. 2. The hottest dust found in the observed infrared spectrum of the star is then not related to the dust temperature in the dust forming layer. It is determined either (1) by the smallest distance from the star to which a gas parcel falls back before it is driven out by radiation pressure or (2) by evaporation of the freshly formed dust. In view of the strongly fluctuating temperature conditions at several stellar radii (see Fig. 1), there is no well-defined inner edge of the dust shell but only a transition zone with variable dust content.
For the model considered here this zone extends from about three to about roughly six stellar radii. It would then depend on the epoch of observation at which layer one would find the inner edge of the silicate dust shell. Additionally one would expect from the highly variable temperature structure of the outermost layers (cf. Fig. 1) and, in fact, one observes (e.g. Lopez et al. 1997; Weiner et al. 2006) some clumpiness of the dust resulting in a variable dust content at R/Rp ≳ 3. Observationally it is found that temperature and location of the inner edge of dust shells around M giants vary widely (see Table 2). In this respect the processes of SiO nucleation as trigger of silicate dust formation is compatible with what one observes, despite the somewhat low temperature at which avalanche nucleation starts.
We note that the concept of dust condensation temperature, as it is generally used by observers, corresponds to hottest dust temperatures required to explain the observed spectrum; this is the temperature given in Table 2. This is not identical to the physical concept of dust formation temperature, which means the gas temperature at which avalance nuleation commences. In a stationary outflow both temperatures should be similar, except for possibly differing greenhouse effects of dust and gas, but for pulsating stars there may be considerable differences between the two temperatures as we have just argued. The fact that in our model dust forms at lower temperatures than the observed hottest dust temperature results from the different meaning of both temperatures. The precise relation between the two temperature concepts can only be derived with detailed consistent models, which are out of our scope.
Another important aspect of our model is that the onset of wind driving by radiation pressure on dust occurs in a zone closer to the star than the zone where dust nucleation is active. In the discussions on the problem of wind driving by iron-bearing silicate dust (Bladh & Höfner 2012) it is assumed that these zones essentially coincide, which may result in the problem that iron-bearing dust is too hot.
An alternative mechanism for seed particle formation for silicate dust growth is the formation of small particulates from highly refractory Ca-Al-compounds, which serve as growth centres for silicate dust. Such aluminium compounds are expected to nucleate and grow at significantly higher temperature and much closer to the star than silicates. The precipitation of a new solid phase on an already existing surface requires no substantial supersaturation and usually commences close to the stability limit, which is about 1 100 K for silicates under circumstellar conditions (Gail & Sedlmayr 2013).
Observationally it has been found that there already seems to exist some dust at distances of about two stellar radii in some objects (see Karovicova et al. 2013; Wittkowski et al. 2015, and references therein), which is interpreted as to be due to corundum dust grains. Table 2 shows, for a few oxygen-rich Miras, data reporting the inner radii and dust temperatures of spatially resolved dust layers close to the star as derived from interferometer studies of the emission from the distance range R ≲ 10Rp. Observationally, thus, one finds objects that seem to form silicate dust only, aluminium dust only, or both species. This shows that two different dust nucleation processes may operate in such stars, but the special circumstances under which one or the other of these is active still has to be explained. The few data for silicate dust temperatures at the closest observed distance to the star seem to indicate that both silicate growth on top of aluminium dust and separate silicate dust nucleation occurs in Miras. In the latter case, the data seem to be compatible with our findings on SiO nucleation.
The reaction kinetics of dust formation was discussed recently by Goumans & Bromley (2012) and by Gobrecht et al. (2016). This approach suffers presently from the problem that only insufficient information is available on cluster properties and reaction rates. These models are substantially based on MgSiO-clusters which, however, are not found in mass spectroscopic investigations of the vapour of forsterite (Nichols et al. 1995). The model of Gobrecht et al. (2016) additionally includes (SiO)n clusters up to n = 4 so that the SiO clustering considered in the present paper is to some extent also included in their model. A similar kinetic model using (SiO)n clusters up to n = 10 (Gail & Sedlmayr 2013,Sect. 10.5.4.3) using a similar set of rate coefficients showed, however, that the resulting condensation temperature is much lower than suggested by the experimental results of Nuth & Donn (1982). Hence the kinetic data are presently not yet sufficiently accurate to calculate nucleation rates by this approach.
The results of this preliminary study demonstrate that, using experimental results of Nuth & Donn (1982), SiO nucleation explains observed properties of dust formation at least for some of the oxygen-rich Miras. A self-consistent implementation of the process into pulsation models is required, however, to elucidate the interplay between the nucleation of silicate and aluminium dust and to obtain results that can be compared more directly with observations.
In practice, a somewhat higher velocity increment Δv is required than that determined from the velocity jump in the numerical model. This results probably from the fact that the shock is numerically broadened and its precise position is difficult to determine from the numerical solution. The velocity jump in the numerical model then usually underestimates the true velocity jump at the true shock position.
Acknowledgments
This work was supported in part by “Schwerpunktprogramm 1385” supported by the “Deutsche Forschungsgemeinschaft (DFG)”.
References
- Ali, A., & Castleman, Jr., A. W. 2005, in IAU Symp., 235, 107 [Google Scholar]
- Arroyo-Torres, B., Wittkowski, M., Chiavassa, A., et al. 2015, A&A, 575, A50 [NASA ADS] [CrossRef] [EDP Sciences] [Google Scholar]
- Bertschinger, E., & Chevalier, R. A. 1985, ApJ, 299, 167 [NASA ADS] [CrossRef] [Google Scholar]
- Bladh, S., & Höfner, S. 2012, A&A, 546, A76 [NASA ADS] [CrossRef] [EDP Sciences] [Google Scholar]
- Bose, M., Floss, C., & Stadermann, F. J. 2010, ApJ, 714, 1624 [NASA ADS] [CrossRef] [Google Scholar]
- Bromley, S. T., Goumans, T. P. M., Herbst, E., Jones, A. P., & Slater, B. 2014, Phys. Chem. Chem. Phys., 16, 18623 [CrossRef] [Google Scholar]
- Danchi, W. C., Bester, M., Degiacomi, C. G., Greenhill, L. J., & Townes, C. H. 1994, AJ, 107, 1469 [NASA ADS] [CrossRef] [Google Scholar]
- Donn, B., Hecht, J., Khanna, R., et al. 1981, Surface Science, 106, 576 [NASA ADS] [CrossRef] [Google Scholar]
- Dorschner, J., Begemann, B., Henning, T., Jaeger, C., & Mutschke, H. 1995, A&A, 300, 503 [NASA ADS] [Google Scholar]
- Ferguson, F. T., & Nuth, III, J. A. 2008, J. Chem. Eng. Data, 53, 2824 [CrossRef] [Google Scholar]
- Ferrarotti, A. S., & Gail, H.-P. 2006, A&A, 447, 553 [NASA ADS] [CrossRef] [EDP Sciences] [Google Scholar]
- Gail, H.-P., & Sedlmayr, E. 1985, A&A, 148, 183 [Google Scholar]
- Gail, H.-P., & Sedlmayr, E. 1986, A&A, 166, 225 [NASA ADS] [Google Scholar]
- Gail, H.-P., & Sedlmayr, E. 1998a, in The Molecular Astrophysics of Stars and Galaxies, eds. T. W. Hartquist & D. A. Williams (Oxford: Oxford University Press), 285 [Google Scholar]
- Gail, H.-P., & Sedlmayr, E. 1998b, Faraday Discussion, 109, 303 [Google Scholar]
- Gail, H.-P., & Sedlmayr, E. 2013, Physics and chemistry of circumstellar dust shells (Cambridge: Cambridge University Press) [Google Scholar]
- Gail, H.-P., Wetzel, S., Pucci, A., & Tamanai, A. 2013, A&A, 555, A119 [NASA ADS] [CrossRef] [EDP Sciences] [Google Scholar]
- Gobrecht, D., Cherchneff, I., Sarangi, A., Plane, J. M. C., & Bromley, S. T. 2016, A&A, 585, A6 [NASA ADS] [CrossRef] [EDP Sciences] [Google Scholar]
- Goumans, T. P. M., & Bromley, S. T. 2012, MNRAS, 420, 3344 [NASA ADS] [Google Scholar]
- Groenewegen, M. A. T., Sloan, G. C., Soszyński, I., & Petersen, E. A. 2009, A&A, 506, 1277 [NASA ADS] [CrossRef] [EDP Sciences] [Google Scholar]
- Ireland, M. J., & Scholz, M. 2006, MNRAS, 367, 1585 [NASA ADS] [CrossRef] [Google Scholar]
- Ireland, M. J., Scholz, M., & Wood, P. R. 2008, MNRAS, 391, 1994 [NASA ADS] [CrossRef] [Google Scholar]
- Ireland, M. J., Scholz, M., & Wood, P. R. 2011, MNRAS, 418, 114 [NASA ADS] [CrossRef] [Google Scholar]
- Karovicova, I., Wittkowski, M., Ohnaka, K., et al. 2013, A&A, 560, A75 [NASA ADS] [CrossRef] [EDP Sciences] [Google Scholar]
- Knapp, G. R. 1985, ApJ, 293, 273 [NASA ADS] [CrossRef] [Google Scholar]
- Lopez, B., Danchi, W. C., Bester, M., et al. 1997, ApJ, 488, 807 [NASA ADS] [CrossRef] [Google Scholar]
- Molster, F. J., Waters, L. B. F. M., & Kemper, F. 2010, in Lect. Not. Phys. 815, ed. T. Henning (Berlin: Springer Verlag), 143 [Google Scholar]
- Nagahara, H., & Ozawa, K. 1996, Geochim. Cosmochim. Acta, 60, 1445 [NASA ADS] [CrossRef] [Google Scholar]
- Nagahara, H., Kushiro, I., & Mysen, B. 1994, Geochim. Cosmochim. Acta, 58, 1951 [NASA ADS] [CrossRef] [Google Scholar]
- Nguyen, A. N., Nittler, L. R., Stadermann, F. J., Stroud, R. M., & Alexander, M. O. 2010, ApJ, 719, 166 [NASA ADS] [CrossRef] [Google Scholar]
- Nichols, Jr., R. H., Wasserburg, G. J., & Grimley, R. T. 1995, in Lun. Planet. Inst. Tech. Rep., 26, 1047 [Google Scholar]
- Nuth, III, J. A., & Donn, B. 1982, J. Chem. Phys., 77, 2639 [NASA ADS] [CrossRef] [Google Scholar]
- Nuth, III, J. A., & Donn, B. 1983, J. Chem. Phys., 78, 1618 [NASA ADS] [CrossRef] [Google Scholar]
- Nuth, III, J. A., & Ferguson, F. T. 2006, ApJ, 649, 1178 [NASA ADS] [CrossRef] [Google Scholar]
- Ossenkopf, V., Henning, T., & Mathis, J. S. 1992, A&A, 261, 567 [NASA ADS] [Google Scholar]
- Paquette, J. A., Ferguson, F. T., & Nuth, III, J. A. 2011, ApJ, 732, 62 [NASA ADS] [CrossRef] [Google Scholar]
- Plane, J. M. C. 2013, Roy. Soc. Lond. Phil. Trans. Ser. A, 371, 20335 [Google Scholar]
- Reber, A. C., Clayborne, P. A., Reveles, J. U., et al. 2006, Nano Letters, 6, 1190 [Google Scholar]
- Schick, H. L. 1960, Chem. Rev., 60, 331 [CrossRef] [Google Scholar]
- Scholz, M., Ireland, M. J., & Wood, P. R. 2014, A&A, 565, A119 [NASA ADS] [CrossRef] [EDP Sciences] [Google Scholar]
- Tachibana, S., Takigawa, A., Miyake, A., Nagahara, H., & Ozawa, K. 2014, in Lun. Planet. Inst. Tech. Rep., 45, 1226 [Google Scholar]
- Vollmer, C., Brenker, F. E., Hoppe, P., & Stroud, R. M. 2009, ApJ, 700, 774 [NASA ADS] [CrossRef] [Google Scholar]
- Weiner, J., Tatebe, K., Hale, D. D. S., et al. 2006, ApJ, 636, 1067 [NASA ADS] [CrossRef] [Google Scholar]
- Wetzel, S., Pucci, A., & Gail, H.-P. 2012, J. Chem. Eng. Data, 57, 1594 [CrossRef] [Google Scholar]
- Wittkowski, M., Karovicova, I., Scholz, M., Ohnaka, K., & Boboltz, D. A. 2015, in Why Galaxies Care about AGB Stars III: A Closer Look in Space and Time, eds. F. Kerschbaum, R. F. Wing, & J. Hron, ASP Conf. Ser., 497, 327 [Google Scholar]
All Tables
Distance, R, in units of the photospheric radius, Rp, and temperature of inner edge, Ti, of silicate and aluminium dust shell as derived from interferometer observations of Mira variables.
All Figures
|
Fig. 1 a) Radial variation of temperature for a number of pulsation phases covering the phase range from Φ = −0.20 to Φ = 3.61 (extrapolated between 5 an 6 R∗). b) Run of pressure and temperature for the pulsation model at different phases of the pulsation cycle between Φ = −0.2 and φ = 3.8 (solid black lines). The nearly horizontal red lines correspond to lines of constant normalized nucleation rate with values between 10-34 and 10-12 particles per second and per H nucleus in steps of 10-2. The blue line corresponds to the onset of avalanche nucleation with a rate of 10-20 s-1 and per H nucleus. The experimental data of Nuth & Donn (1982) are indicated by green circles. The green line corresponds to the upper green line in Fig. 2. |
| In the text | |
|
Fig. 2 Trajectories of two different mass elements (solid green lines). The crosses correspond to the grid points of the pulsation model (Ireland et al. 2008, 2011). Green crosses correspond to outwards directed velocity, red crosses to inwards directed velocity. Circles roughly indicate the location of shock fronts. The kink in the lower trajectory is due to the shock hitting the gas parcel at phase Φ ≈ 3.55. |
| In the text | |
|
Fig. 3 Variation of gas temperature (dashed line) and dust particle formation rate (solid line) in the gas parcel along the lower trajectory in Fig. 2. The abscissa is the phase of the pulsation. The left ordinate is the dust particle formation rate in particles per H nucleus and per second. |
| In the text | |
|
Fig. 4 Dust condensation along the lower particle trajectory in Fig. 2. The abscissa is the phase of the pulsation. The ordinate is the fraction of the Si condensed into silicate dust. |
| In the text | |
Current usage metrics show cumulative count of Article Views (full-text article views including HTML views, PDF and ePub downloads, according to the available data) and Abstracts Views on Vision4Press platform.
Data correspond to usage on the plateform after 2015. The current usage metrics is available 48-96 hours after online publication and is updated daily on week days.
Initial download of the metrics may take a while.