Fig. 2
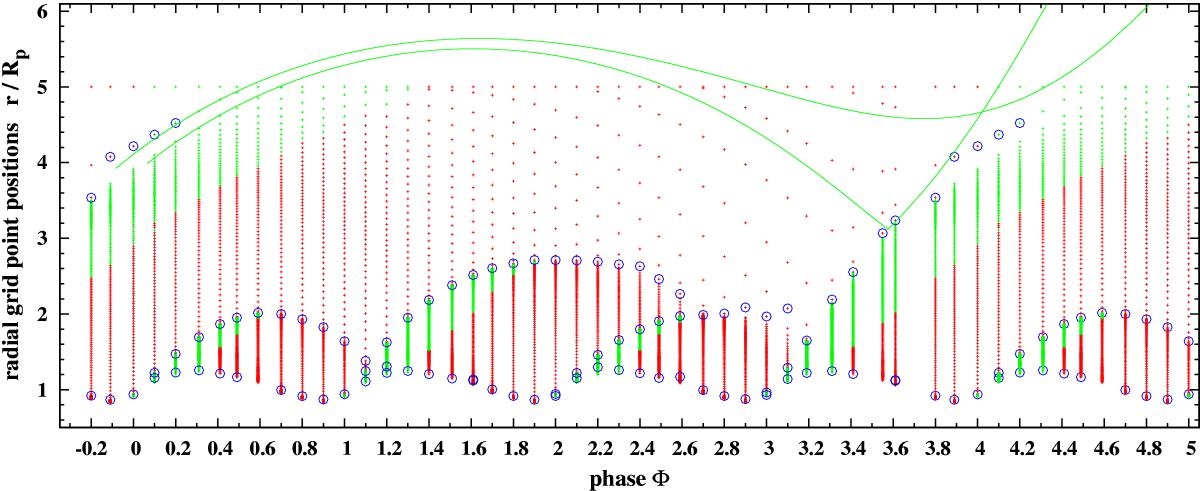
Trajectories of two different mass elements (solid green lines). The crosses correspond to the grid points of the pulsation model (Ireland et al. 2008, 2011). Green crosses correspond to outwards directed velocity, red crosses to inwards directed velocity. Circles roughly indicate the location of shock fronts. The kink in the lower trajectory is due to the shock hitting the gas parcel at phase Φ ≈ 3.55.
Current usage metrics show cumulative count of Article Views (full-text article views including HTML views, PDF and ePub downloads, according to the available data) and Abstracts Views on Vision4Press platform.
Data correspond to usage on the plateform after 2015. The current usage metrics is available 48-96 hours after online publication and is updated daily on week days.
Initial download of the metrics may take a while.