Fig. 1
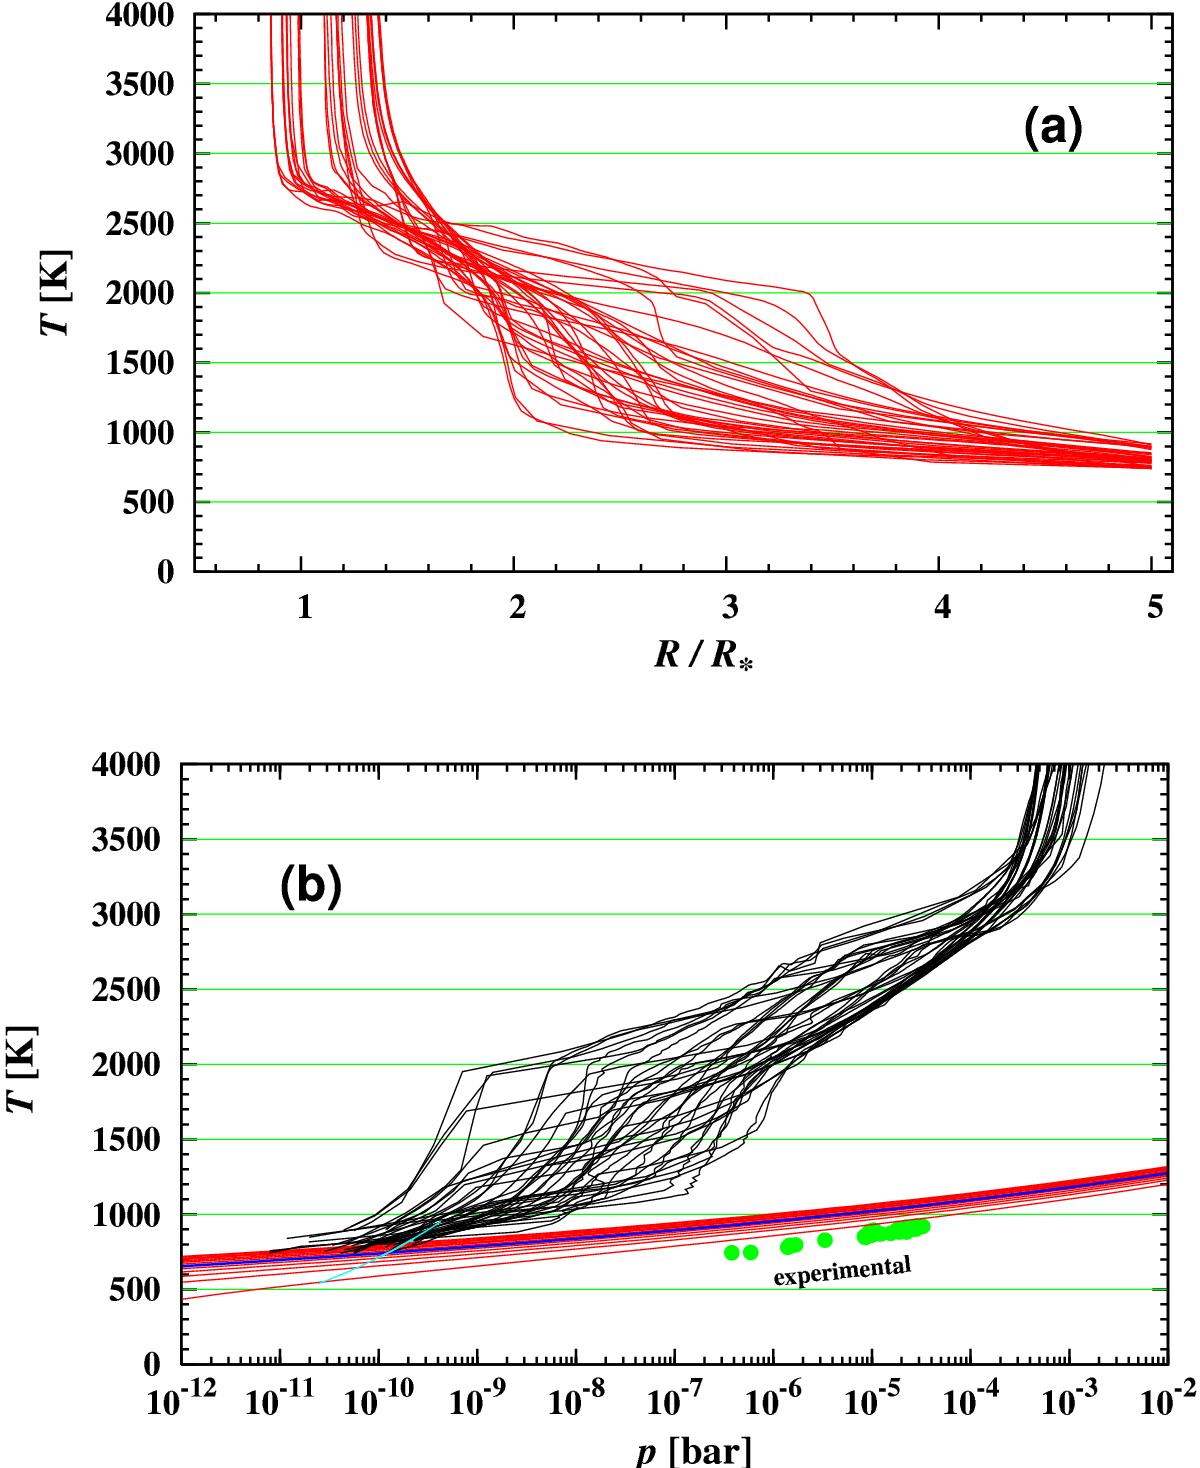
a) Radial variation of temperature for a number of pulsation phases covering the phase range from Φ = −0.20 to Φ = 3.61 (extrapolated between 5 an 6 R∗). b) Run of pressure and temperature for the pulsation model at different phases of the pulsation cycle between Φ = −0.2 and φ = 3.8 (solid black lines). The nearly horizontal red lines correspond to lines of constant normalized nucleation rate with values between 10-34 and 10-12 particles per second and per H nucleus in steps of 10-2. The blue line corresponds to the onset of avalanche nucleation with a rate of 10-20 s-1 and per H nucleus. The experimental data of Nuth & Donn (1982) are indicated by green circles. The green line corresponds to the upper green line in Fig. 2.
Current usage metrics show cumulative count of Article Views (full-text article views including HTML views, PDF and ePub downloads, according to the available data) and Abstracts Views on Vision4Press platform.
Data correspond to usage on the plateform after 2015. The current usage metrics is available 48-96 hours after online publication and is updated daily on week days.
Initial download of the metrics may take a while.