| Issue |
A&A
Volume 591, July 2016
|
|
|---|---|---|
| Article Number | A95 | |
| Number of page(s) | 13 | |
| Section | Interstellar and circumstellar matter | |
| DOI | https://doi.org/10.1051/0004-6361/201526948 | |
| Published online | 21 June 2016 | |
Probing the 2D temperature structure of protoplanetary disks with Herschel observations of high-J CO lines
1
INAF–Osservatorio Astrofisico di Arcetri, L.go E. Fermi
5, 50125
Firenze,
Italy
e-mail:
fedele@mpe.mpg.de
2
Max-Planck Institut für Extraterrestrische Physik,
Giessenbachstrasse 1,
85748
Garching,
Germany
3
Leiden Observatory, Leiden University,
PO Box 9513, 2300 RA
Leiden, The
Netherlands
Received: 13 July 2015
Accepted: 5 April 2016
The gas temperature structure of protoplanetary disks is a key ingredient for interpreting various disk observations and for quantifying the subsequent evolution of these systems. The comparison of low- and mid-J CO rotational lines is a powerful tool for assessing the temperature gradient in the warm molecular layer of disks. Spectrally resolved high-J (Ju> 14) CO lines probe intermediate distances and heights from the star that are not sampled by (sub-)millimeter CO spectroscopy. This paper presents new Herschel/HIFI and archival PACS observations of 12CO, 13CO, and [C ii] emission in four Herbig AeBe disks (HD 100546, HD 97048, IRS 48, HD 163296) and three T Tauri disks (AS 205, S CrA, TW Hya). In the case of the T Tauri systems AS 205 and S CrA, the CO emission has a single-peaked profile, likely due to a slow wind. For all the other systems, the Herschel CO spectra are consistent with pure disk emission and the spectrally resolved lines (HIFI) and the CO rotational ladder (PACS) are analyzed simultaneously assuming power-law temperature and column density profiles, using the velocity profile to locate the emission in the disk. The temperature profile varies substantially from disk to disk. In particular, Tgas in the disk surface layers can differ by up to an order of magnitude among the four Herbig AeBe systems; HD 100546 is the hottest and HD 163296 the coldest disk in the sample. Clear evidence of a warm disk layer where Tgas>Tdust is found in all the Herbig Ae disks. The observed CO fluxes and line profiles are compared to predictions of physical-chemical models. The primary parameters affecting the disk temperature structure are the flaring angle, the gas-to-dust mass ratio, the scale height, and the dust settling.
Key words: stars: pre-main sequence / stars: variables: T Tauri, Herbig Ae/Be / protoplanetary disks
© ESO, 2016
1. Introduction
A key physical parameter of protoplanetary disks is the gas temperature, Tgas. Inside a disk Tgas controls the dynamics of the gas by setting the sound speed and, through this value, also the disk photoevaporation. At the same time, Tgas governs the chemical composition by regulating the reaction rates between different species. Disks are characterized by a strong temperature gradient in the radial and the vertical directions. For this reason, multiple transitions that trace different vertical layers and different orbital radii have to be observed to derive Tgas in disks. An ideal disk “thermometer” is the CO rotational ladder. Low-J (Ju< 6) CO rotational lines have routinely been observed from the ground in protoplanetary disks since the late 1990s (e.g., Koerner & Sargent 1995; Mannings & Sargent 1997; Dutrey et al. 1998; van Zadelhoff et al. 2001). These lines probe mostly the cold gas in the outer disk (r> 100 au). Recent observations of disks with Herschel/PACS carried out by the DIGIT (Green et al. 2013) and GASPS (Dent et al. 2013) key programs report the detection of pure rotational high-J (Ju> 14) CO emission lines (e.g., Sturm et al. 2010; van Kempen et al. 2010; Meeus et al. 2012, 2013). These lines trace warm gas (Eu ≥ 300 K) located in the intermediate layers between the disk surface and the midplane at intermediate distances from the star (10–50 au) as predicted by thermo-chemical models of UV irradiated disks (e.g., Jonkheid et al. 2007; Gorti & Hollenbach 2008; Woitke et al. 2009; Kamp et al. 2010; Bruderer et al. 2012).
The detections of the CO high-J lines allow us to estimate the gas temperature in this region of the disk for the first time. However, the PACS spectra (resolving power R = λ/ Δλ ~ 103) presented by Meeus et al. (2013) are spectrally and spatially unresolved, so that their emitting region (and the radial distribution of the gas) can only be inferred indirectly from the modeling of line fluxes (e.g., Bruderer et al. 2012). The only way to overcome the lack of spatial resolution at high THz frequencies and to determine the warm gas distribution within disks is with high-resolution spectroscopy with HIFI (R = 106–107), where Kepler’s law can be used to associate a velocity bin with a radial location in the disk.
The Herschel PACS and HIFI CO spectra of the Herbig Ae system HD 100546 have been presented in Fedele et al. (2013b, hereafter Paper I) in which the radial gas temperature gradient is estimated for the first time. This paper presents new Herschel/HIFI observations of CO J = 16–15 toward HD 97048, AS 205, Oph-IRS 2-48, and S CrA, and of CO and 13CO J = 10–9 toward TW Hya, HD 100546 and HD 163296. Herschel/HIFI observations of [C ii] (158 μm) in HD 97048 and HD 100546 are reported in the Appendix.
Herschel/HIFI observations log and line properties.
2. Observations and data reduction
The sample selection is based on the PACS detection of high-J CO and [C ii] emission (Meeus et al. 2013; Fedele et al. 2013a). The observations log is shown in Table 1. Most of the data are from program ID OT2_DFedele_1 (PI: D. Fedele). The HIFI 12CO and 13CO J = 10–9 spectra are from the WISH key program (PI: E.F. van Dishoeck) for TW Hya, and from programs OT1_mhogerhe_1 (HD 100546 12CO J = 10–9, PI: M. Hogerheijde), OT2_mhogerhe_2 (HD 100546 and HD 163296 13CO J = 10–9, PI: M. Hogerheijde), and OT1_lpodio_1 (HD 163296 12CO J = 10–9, PI: L. Podio).
The CO observations were executed in dual beam switch fast chopping mode with the Wide-Band Spectrometer (WBS) and the High Resolution Spectrometer (HRS) simultaneously. The spectral resolution is set to 1.1 MHz for WBS and 0.25 MHz for HRS for both polarizations. The [C ii] observations were carried out in “load chop” where an internal calibration source is used in combination with an off-source calibration observation. This allows us to remove the spatially extended [C ii] emission. The beam size (HPBW) is 11.̋1 at the observed frequency (Roelfsema et al. 2012). In the following, we will only refer to the WBS spectra.
The spectra are extracted from the level 2 data, which were processed with standard pipeline SPG v9.1.0. Standing waves are present in the WBS spectra. These waves were removed by fitting a set of sine functions after masking the narrow spectral features (CO or [C ii]). This operation was performed with the “fitHifiFringe” script provided with Hipe. The HIFI level 2 fluxes are shown on the antenna temperature scale ( ) and were converted to main beam temperature,
  , with ηl the forward efficiency and ηmb the beam efficiency (Table 1). No major differences are present between the H and V polarizations and the two spectra were averaged together after applying the efficiency corrections and removing the continuum. High-J CO lines are not contaminated by the cold cloud contribution that plagues single dish low-J CO lines.
The reduction of the archival PACS data analyzed here is described in Meeus et al. (2013) and Fedele et al. (2013a).
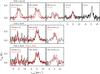 |
Fig. 1 HIFI/WBS spectra of CO J = 16–15 (top), J = 10–9 (middle and bottom), and 13CO J = 10–9 (bottom). The spectra of low-J lines are overlaid in red (scaled for comparison) in the top and middle rows. For clarity, some spectra were rebinned to lower resolution: for CO J = 16–15 dv = 0.8 km s-1 in HD 97048, HD 100546, and IRS 48, and dv = 0.32 km s-1 in S CrA; for CO J = 10–9 dv = 0.52 km s-1 in TW Hya and dv = 1.3 km s-1 in HD 163296; for 13CO J = 10–9 dv = 0.56 km s-1 in TW Hya and dv = 1.4 km s-1 in HD 163296. The remaining spectra are shown at their native resolutions. |
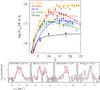 |
Fig. 2 Top: CO rotational ladder. Detections are shown as filled circles and upper limits as open triangles. The solid lines represent the best-fit power-law model. Bottom: best-fit model profile of the CO J = 16–15 (HD 97048 and IRS 48) and CO J = 10–9 (HD 163296 and TW Hya). Spectral resolution as in Fig. 1. |
3. Results
The HIFI/WBS CO spectra are presented in Fig. 1 and the line parameters are given in Table 1. The [C ii] spectra and analysis is presented in the Appendix. The integrated line flux (W m-2) is computed from the integrated intensity ![\begin{eqnarray} \int{T_{\rm mb}{\rm d}V} = 2 \ k \ \Big(\frac{\nu}{c} \Big)^3 \ \pi \ \Bigg(\frac{\rm HPBW}{2\!\sqrt{\rm ln (2)}}\Bigg)^2 \ \int{T_{\rm mb}{\rm d}V} \ \ \ {\rm [K\,km\,s^{-1}]} \end{eqnarray}](/articles/aa/full_html/2016/07/aa26948-15/aa26948-15-eq40.png) (1)with k (Boltzmann constant, W s K-1), ν the frequency (Hz), c the light speed (m s-1), and HPBW the beam (radians). Because of the updated values of the beam efficiency (Table 1), we note that the line intensities presented here for HD 100546 are slightly different (~3%) from the values given in Paper I.
(1)with k (Boltzmann constant, W s K-1), ν the frequency (Hz), c the light speed (m s-1), and HPBW the beam (radians). Because of the updated values of the beam efficiency (Table 1), we note that the line intensities presented here for HD 100546 are slightly different (~3%) from the values given in Paper I.
The top panel of Fig. 1 shows the WBS spectra of the CO J = 16–15 lines toward HD 97048, HD 100546, IRS 48, AS 205, and S CrA. The line is clearly detected above 5σ (Table 1) in all sources. The velocity profile and width are different among the five sources. The emission is broad (Δv> 5 km s-1) toward the three HAeBe stars (HD 97048, HD 100546, and IRS 48): a double-peak profile is clearly visible in HD 100546 and IRS 48, while the CO velocity profile is top-flat in HD 97048. In all three cases, the WBS spectra of the CO J = 16–15 transition are consistent with a Keplerian velocity field of the gas in the disk. In the case of the two T Tauri systems, AS 205 and S CrA, the CO J = 16–15 emission is narrow (Δv< 5 km s-1) and single-peaked. There is no evidence of Keplerian rotation. For comparison, the profiles of the low-J CO lines are also shown when available. Spectra (either APEX or ALMA) are from Panić et al. (2010), Bruderer et al. (2014), Salyk et al. (2014) and Kama et al. (2016). In all cases, the low- and high-J CO lines are centered at the same vLSR with the CO J = 16–15 line broader than the low-J line. We note that part of the asymmetric profile of the J = 6–5 line toward IRS 48 is due to extinction from the foreground cloud (Bruderer et al. 2014). In the case of AS 205, both CO lines are centered at vLSR = 4.8 km s-1 compared to the cloud velocity of vLSR = 3 km s-1. Thus, we conclude that the high-J CO emission in AS 205 arises from a slow wind/outflow, as do the low-J CO (Salyk et al. 2014) and the ro-vibrational (Pontoppidan et al. 2011) emission.
The narrow, single-peak, profile of the CO J = 16–15 emission in S CrA also suggests a contribution from a slow wind associated with the system. The CO ro-vibrational lines toward both stellar components in this binary are broad and single-peaked, similar to AS 205 (Bast et al. 2011; Brown et al. 2013).
Figure 1 also shows the HIFI/WBS spectra of CO J = 10–9 compared to the low-J transitions (middle) and to the 13CO (bottom) for TW Hya, HD 100546, and HD 163296. The 12CO and 13CO lines are both clearly detected. The lines are broad and double-peaked toward HD 100546 and HD 163296 and narrow and single-peaked toward TW Hya. In all three cases, the lines are centered on the system velocity and the narrow line profile of TW Hya is consistent with the disk being almost face-on to the plane of the sky. As noted in Paper I, the line width is narrower for lower J transitions in HD 100546. Instead, in the case of HD 163296, the width of the J = 2–1 (ALMA science verification data) and J = 10–9 are similar. We note that the 12CO and 13CO J = 10–9 profiles appear asymmetric toward HD 163296; however, the flux difference between the two peaks is within the noise level of the spectrum.
Interestingly, the 13CO line toward HD 100546 and HD 163296 is slightly broader than the 12CO line (Fig. 1, bottom row). This implies that the line emitting region of 13CO extends to higher velocity regions, i.e., closer to the star. Another prominent difference is the central peak detected in the 12CO J = 10–9 line in the HD 100546 spectrum, which is not visible in the 13CO spectrum. The differences in the velocity profiles are likely due to optical depth effects: the 12CO line becomes optically thick at lower column densities and higher up in the atmosphere than the 13CO line. This is discussed further in Sect. 5.
4. Analysis
The CO rotational ladder is a powerful tool that can be used to assess the temperature structure of protoplanetary disks (Bruderer et al. 2012; Fedele et al. 2013b; van der Wiel et al. 2014). The low-J lines are optically thick and the lines becomes optically thin only at Ju ≳ 14 (Bruderer et al. 2012). The advantage of the high-J CO rotational lines is that they trace intermediate distances from the star (a few tens of au) and heights (z/r ~ 0.1–0.4) above the disk midplane. The high-J CO transitions are complimentary to the low−J CO transitions observed at millimeter observations that trace the colder outer disk. Thus, the flux and velocity profile of the high-J CO lines are crucial in order to measure the gas temperature in the disk atmosphere. The rotational ladder (Table A.1) is compiled combining low-J lines (Ju< 6) from ground-based observations, mid-J (Ju = 7–12) from SPIRE (van der Wiel et al. 2014), and high-J (Ju> 14) lines from Herschel/PACS (Meeus et al. 2013). In some cases, the CO line fluxes measured with SPIRE are contaminated by extended emission (cloud) as noted by van der Wiel et al. (2014). The affected lines are excluded from the fit.
The CO rotational ladders for the five disks are shown in Fig. 2. The shape of the ladder varies from object to object. We note in particular the difference between HD 100546 and HD 163296: in the first case the CO line flux increases with J and then remains almost constant, while in the case of HD 163296 the rotational ladder turns over at Ju ~ 10–15.
The analysis of HD 100546 is presented in Paper I. The sources AS 205 and S CrA are excluded from this analysis because the CO line fluxes and velocity profiles are dominated by an outflow/jet.
4.1. Power-law model
Best-fit power-law model parameters.
Following the method described in Paper I the CO rotational ladder and the line velocity profiles (J = 16–15 for HD 97048 and IRS 48, J = 10–9 for TW Hya and HD 163296) are fitted simultaneously using a power-law profile for the kinetic gas temperature (under the assumption that the CO excitation temperature corresponds to the kinetic temperature, which is valid given the high densities of the emitting regions) and column density: 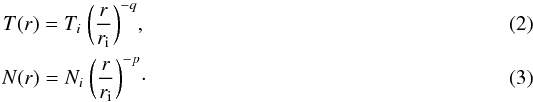 Here Ti and Ni are the values at the inner radius ri of the disk (fixed, Table 2). The stellar and disk parameters are taken from the literature. In particular ri = 0.1 au for TW Hya (Pontoppidan et al. 2008), 13 au for HD 100546 (van der Plas et al. 2009; Brittain et al. 2009; Fedele et al. 2015), 11 au for HD 97048 (van der Plas et al. 2009), and 20 au for IRS 48 (Bruderer et al. 2014). The power law is truncated at the outer disk radius, rout (fixed, Table 2; the choice of the outer radius does not matter as long as rout> 100 au). The free parameters of the model are Ti,q,Ni, and p. A grid of models is created for each disk varying the four parameters in the ranges Ti = 300–1500 K, Ni = 1017−1022cm-2, q, and p = 0.5–1.5. The spectra are spatially convolved with the telescope beam, represented here by a Gaussian profile. Further details about the model and the fitting procedure are given in Paper I. The best-fit parameters are found by minimizing the χ2 between the observations and the model. The final χ2 is given by the sum of the individual χ2 of the CO rotational ladder and of the line profiles (one for each line), including their width and peak separation. The best-fit model parameters are listed in Table 2 and the best-fit models are overlaid on the data in Fig. 2.
The derived temperature profiles (labeled TCO) are plotted in Fig. 3. Evidence of warm disk temperature (T> 100 K) is found for HD 97048, HD 100546, and IRS 48. The coldest disks are TW Hya and HD 163296, which both have T< 100 K outward of 20 au.
4.2. Caveats of the power-law model
The assumption of a flat disk geometry is justified by the results of physical-chemical models, which predict that most of the CO rotational lines arise from a similar vertical layer in the disk. With this assumption, however, the power-law model fails to reproduce the core of the line profile, especially in the case of HD 97048 (Fig. 2) where the line wings are accurately reproduced by the model, while the central low-velocity part of the line is not. This can be due to an optical depth effect, if the core of the line is optically thick.
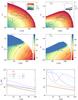 |
Fig. 4 DALI disk structure of the two representative models, ψ = 0.05 (left panels) and ψ = 0.25 (right panels). Top: gas density structure: the inset shows the inner disk structure, the dark blue curves indicate the ngas = 106,108, and 1010 cm-3 contours. The line contribution functions of a mix of low- and high-J transitions of 12CO (solid lines) and 13CO (dashed) are overlaid on the ngas panels. Each contour shows the layer where 50% of the line flux emerges. Middle: gas temperature structure, the isothermal contours are overlaid for Tgas and Tdust (dashed lines) = 20, 50, 100, 200, and 500 K. Bottom: gas temperature radial profile at different disk heights relevant to the disk midplane (z/r = 0.01) and to the CO emitting layers. |
The second major caveat of the power-law model is that the column density profile is not constrained: most of the lines are optically thick and the CO ladder is mostly sensitive to the temperature profile of the τline = 1 layer. Thus, even if Nin and p are free parameters of the model, these values are to be taken with caution.
5. Comparison to disk models
The goal of this section is to explain the large variation in the CO rotational ladder and velocity profiles among Herbig Ae systems (Figs. 1 and 2). This study is based on the physical-chemical model, DALI (Dust and Lines; Bruderer et al. 2012; Bruderer 2013). DALI takes as input a density structure of the disk (taken to be a power-law with slope γ and critical radius Rc with an exponential tail) and a stellar radiation field, then solves the continuum radiative transfer and determines the dust temperature and ultraviolet radiation field at each position in the disk. The thermal balance of the gas and chemistry are subsequently solved iteratively until convergence. The output includes continuum and line emission maps, line intensities, and spectra produced via ray tracing. Dust settling is included adopting two grain size populations, small (amin−1 μm) and large (1–1000 μm) following D’Alessio et al. (2006), and dust cross sections from Andrews et al. (2011). The degree of settling of the large grains is controlled in DALI by the parameters χ and flarge: the first defines the maximum scale height of the large grains with respect to the small ones (similar to “Zbig” in D’Alessio et al. 2006), while flarge determines the small-to-large grain mass ratio.
DALI model parameters for Herbig Ae disks.
Figure 4 shows the gas density (top row) structure for the two representative models (Table 3, the spectral energy distribution of the two models is shown in the Appendix). The inset shows the inner disk structure. The line contribution functions of a set of low-J and high-J transitions of 12CO and 13CO are overlaid on the ngas contours showing the layer where 50% of the line flux emerges. The CO emitting layer varies slightly with J and the four transitions shown here emerge from a layer between z/r ~ 0.4–0.6 and z/r ~ 0.3–0.5 for the flat and flared disk, respectively. In all cases, the 13CO lines emerge closer to the disk midplane and at smaller stellar distances than the 12CO lines do; because of the vertical and radial density gradients, the CO emission becomes optically thick higher up in the disk atmosphere and at larger distance from the star compared to the 13CO line. This is in excellent agreement with the broader velocity profile observed for 13CO (Table 1, Fig. 1, bottom row).
The gas temperature structure for the representative models in shown in Fig. 4 (middle panel). At any given position in the disk, the gas and dust temperatures increase with flaring angle. We note in particular that the dust temperature in both disks is Tdust> 20 K everywhere in the disk. This prevents CO from freeze-out on dust grains as condensation occurs only at T ≲ 20 K in the disk interior. Without CO freeze-out, formation of complex species via surface chemistry is inhibited in such a warm disk. In both cases, Tgas is larger than Tdust in the upper layers of the disk.
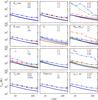 |
Fig. 5 Tgas radial profile for different disk/stellar parameters. The temperature radial profile is shown for the layers z/r = 0.01 (solid lines) and 0.6 (dot-dashed lines). In the case of hc = 1, the CO emitting layer is z/r ~ 0.2–0.3 and the dot-dashed line shows the temperature gradient at z/r = 0.3. |
The Tgas radial profile at different heights (z/r) for the two representative models is shown in the bottom panel of Fig. 4. In the flat disk case, the temperature increases slightly with height with an almost identical radial dependence from the disk midplane (z/r = 0.01) up to the disk upper layers. This is no longer true for flared disks, which show a strong dependence of Tgas(r) with disk height.
5.1. Disk models grid
This section provides a qualitative comparison to physical-chemical models of Herbig AeBe disks. For this, a grid of DALI disk models is built to study the impact of different stellar and disk parameters on the disk thermal structure. The stellar mass and the bolometric luminosity are taken to be fixed while the stellar effective temperature (Teff, assuming blackbody emission), the disk mass (Mdisk), critical radius (Rc), disk outer radius (Rout), scale height (hc), power-law exponent (γ), flaring angle (ψ), dust settling (χ,flarge), minimum grain size (amin), gas-to-dust mass ratio (Δgd), and the PAH abundances are varied (Table 3). Several of these parameters were also investigated in Bruderer et al. (2012), but only for a flared disk. The model grid is built around the flat (ψ = 0.05) disk representative model varying the aforementioned parameters by the values given in Table 3. In particular, the values of Teff are representative of the typical stellar temperature of Herbig Ae systems (e.g., van den Ancker et al. 1998). The far-ultraviolet (FUV; 6–13.6 eV) luminosity, relevant to the heating of the disk and the photodissociation of CO, is regulated by Teff and it ranges between LFUV = 0.45–1.7 L⊙ for Teff = 8000–10 500 K.
To investigate the impact of dust settling on the disk thermal structure, χ and flarge were varied between 0.2–1.0 and 0.5–0.999, respectively (Table 3). Lowering the value of χ has the effect of letting the UV photons penetrate further inside the disk. As a consequence the C+/C/CO transition layers shift deeper into the disk. For flarge = 0.5 the dust mass is distributed equally between the small and the large dust grains, for flarge = 0.999, the bulk of the dust mass is in the large dust grains.
The abundance of PAHs and the gas-to-dust mass ratio are poorly constrained in disks. Model fits to observational data suggest PAH abundances that are typically 10–100 times lower than those in the interstellar medium (Geers et al. 2006). For Herbig AeBe disks, PAHs of about 100 carbon atoms survive the strong UV radiation (Visser et al. 2007). For this analysis three abundance values are considered (1%, 10%, and 50%) with respect to the abundance of the interstellar medium (Draine & Li 2007). The gas-to-dust mass ratio (Δgd) in disks is likely to be lower than that of the interstellar medium (e.g., Chapillon et al. 2010). In this paper Δgd varies between 1% and 100% of the ISM value (Bohlin et al. 1978).
The effects of elemental carbon abundance and isotope selective photodissociation (relevant to 13CO) are not treated here. These effects are investigated in Bruderer et al. (2012) and Miotello et al. (2014). As noted by Miotello et al. (2014), the 13CO line intensities are less affected by the isotope selective photodissociation than are C18O and C17O. It is thus reasonable to neglect this effect in this analysis. The effect of a lower carbon abundance is similar to that of a smaller gas-to-dust ratio (Bruderer et al. 2012).
5.2. Temperature radial gradient
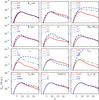 |
Fig. 6 Synthetic CO ladder for different disk parameters (see Table 3). Fluxes measured assuming a distance of 100 pc and a disk inclination of 45°. |
Figure 5 shows the Tgas radial profile for all disk models at two different layers representative of the disk midplane and of the (uppermost) CO emitting layer.
The parameters affecting most the midplane temperature are the flaring angle, scale height, the dust settling, and to a lesser extent the disk mass and the gas-to-dust mass ratio. At the CO emitting layer the temperature gradient is controlled mostly by the disk flaring and less by the disk mass, the gas-to-dust mass ratio, the dust settling (flarge), and the stellar temperature. We note that the flarge = 0.999 case is a very extreme scenario in which the disk outer layers are almost completely devoid of dust as the bulk of the mass is made up of large dust grains that have settled in the disk midplane (χ = 0.2).
5.3. CO line fluxes
The synthetic CO ladders are shown in Fig. 6. In all cases the distance is fixed to 100 pc and the disk inclination to 45°.
There are two main aspects of the CO ladder that the models need to reproduce: the absolute line fluxes and especially the shape of the CO ladder, whether or not it bends over at higher J. No changes are observed for different disk sizes. The parameter that primarily affects the CO line ladder are the following:
-
Flaring angle:
the CO line fluxes vary by 1–2 orders of magnitudebetween the flat (fainter) and the flared disks forJ ≳ 10, and the line flux difference increases with J. This is due to the different gas temperature structure between flat and flared disks (Fig. 5);
-
Critical radius:
the low−J (J< 10) lines become brighter with Rc while the flux of the high-J does not vary. Since the temperature structure does not vary with Rc (Fig. 5), this is likely due to the change in vertical depth in the outer disk, which is due to the change in Rc;
-
Scale height:
all CO lines become brighter if the scale height increases. Since the temperature radial gradient does not show significant changes with hc at the CO emitting layer, the differences in CO line fluxes are due to the shift in the C+/C/CO transition layers deeper into the disk with decreasing scale height;
-
Disk mass:
this parameter only affects the low-J (J< 10) lines, which become slightly brighter for increasing disk mass. The effect is only significant for low disk masses (≲10-4M⊙), and is due to the change in gas column density (hence line optical depth) in the outer disk;
-
Gas-to-dust mass ratio:
reducing Δgd from 100 to 1 has the effect of lowering all line fluxes by up to one order of magnitude. We note that keeping the gas mass constant and lowering the gas-to-dust mass ratio implies a higher dust mass. Thus, the CO lines are fainter for low values of Δgd because of the increased opacity and lower temperature (Fig. 5) induced by the higher dust mass compared to the Δgd = 100 case;
-
Dust settling and large-to-small grain mass ratio:
the high-J lines are brighter for a settled disk and for a higher mass ratio. This is due to the increase in gas temperature in the disk upper layers. In the extreme case of flarge = 0.999 all the CO lines are several order of magnitude brighter.
All the other parameters analyzed here affect mostly the flux of the high-J (J ≳ 10) lines inducing a bending over the CO ladder for J ≳ 10.
For comparison, Fig. 7 shows the CO ladder in the case of a “cold” disk atmosphere (i.e., Tgas = Tdust, obtained by switching off the thermal balance in DALI). In this case all the CO line fluxes are substantially lower and the flux drops quickly with J for Ju ≳ 10. The shape of the observed CO ladder and the absolute flux level are inconsistent with the cold disk case, thus suggesting that Tgas exceeds Tdust in the upper layers of all the Herbig Ae disks studied here.
The 13CO ladder is shown in Fig. 8 for two representative disk models. The fluxes of the 13CO lines in the PACS range are all below the detection threshold of the DIGIT and GASPS surveys. The estimate of the 13CO J = 10–9 flux is in good agreement (once corrected for distance) with the value measured in this paper for HD 100546 and HD 163296 (Table 1). The fluxes of the mid-J13CO lines reported by van der Wiel et al. (2014) toward HD 100546 (based on Herschel/SPIRE) are much brighter than the values estimated here. As noted by van der Wiel et al. (2014) the SPIRE measurements may be contaminated by an extended non-disk emission.
As shown by the line contribution function in Fig. 4, the 13CO emission probes a layer closer to the disk midplane at a smaller distance to the star than the 12CO emission does. The relative fluxes and line profiles of multiple high-J transitions of the two isotopologues provide a strong constraint to the disk temperature structure both in the radial and in the vertical direction.
Finally, Fig. 9 shows the effect of a dust gap in the CO ladder for the flared (ψ = 0.25) disk case; a dust gap is included between 1–13 au with a drop in dust surface density of δdust = 10-6 and a drop in the gas surface density δgas = 10-6. A structure of this kind is representative of the Herbig Ae group I systems analyzed here (e.g., HD 100546). As the figure shows, the dust gap does not affect the CO ladder for J< 25 because the high-J lines analyzed here are emitted at radii larger than the dust gap.
 |
Fig. 7 Synthetic CO ladders in the case of Tgas = Tdust case (representative models only). |
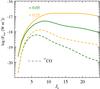 |
Fig. 8 Synthetic 13CO ladders (representative models only). |
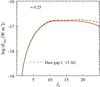 |
Fig. 9 Synthetic CO ladder for the flared disk case (ψ = 0.25) with and without dust gap (dashed green and red curve, respectively). |
5.4. CO line profiles
The predicted velocity profiles of different CO transitions are shown in Fig. 10 (13CO) for the representative models. A mix of low- and high-J transitions are plotted for a disk inclination of i = 45°. In all cases the line width increases with J. The larger differences in line width are seen for the flat disk models. We note that these differences in line width become particularly significant for J = 16–15, not yet for J = 10–9, demonstrating the power of these high-J HIFI data. For ψ = 0.05 the disk scale height and the dust settling have only minor effect on the line velocity profiles. In the case of ψ = 0.25 instead, all the lines become broader if there is substantial dust settling while changing the scale height from hc = 0.2 to 0.3 has little impact (not shown here).
The 13CO lines are systematically broader than the 12CO lines (Fig. 10); this is particularly true for the higher J transitions because the 13CO transitions become optically thick at higher density and the line emitting region moves deeper into the disk and closer to the star (for a given J). This can be seen in Fig. 4, which shows the gas density structure and the line contribution function.
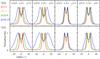 |
Fig. 10 CO (top) and 13CO (bottom) line profiles computed with DALI as a function of dust settling and flaring angle for a disk inclination of i = 45°. The remaining parameters are fixed: hc = 0.2, Δgd = 100, Teff = 10 500 K, PAH = 1%, flarge = 0.85. |
6. Discussion and conclusion
The major finding of this paper is that the disk temperature structure varies substantially from system to system (Fig. 3). This result is based on the analysis of the high-J CO line profiles and of the CO rotational ladder. We note in particular that the four Herbig Ae systems have similar stellar mass (M⊙ ~ 2–2.5 M⊙), while the disk temperature can differ by almost an order of magnitude. The comparison of the observed (Fig. 2) and synthetic (Fig. 6) CO ladders suggest a disk temperature sequence for the four Herbig Ae systems studied here (when the different distances of the sources are taken into account). In this sequence HD 100546 is the hottest and HD 163296 the coldest disk. The primary parameters regulating the overall disk temperature are the flaring angle, the scale height, and the the gas-to-dust mass ratio; varying these parameters induces a variation in the CO line flux up to 1–2 orders of magnitude. The disk temperature structure is sensitive to the disk mass only for Mdisk ≲ 10-4M⊙. Dust settling may also lead to changes in the disk temperature. The power-law exponent of the surface density profile, the stellar temperature and PAH abundance have secondary effects on the temperature of Herbig Ae disks affecting mostly the CO ladder shape, producing a bending in the CO rotational ladder for J ≳ 10. In some cases, changes in the CO ladder are not due to a different temperature structure (Sect. 5.3); for example, a different disk critical radius affects the value of the low-J CO lines (J< 10), while the overall temperature structure does not vary substantially.
An interesting outcome of the analysis performed here is that the CO ladder may help constrain some key physical parameters in disks like the gas-to-dust mass ratio, or equivalently the elemental carbon abundance (Bruderer et al. 2012). Spatially resolved millimeter images of the low-J lines allow the accurate measurement of the disk flaring angle and scale height (de Gregorio-Monsalvo et al. 2013), while multifrequency dust continuum observations provide strong constraints on the grain size distribution reducing the degeneracy in the CO ladder. Once these properties are measured, the major differences in the CO ladder are driven by the gas-to-dust mass ratio.
In conclusion, the CO rotational ladder and the velocity profiles of multiple-J transitions are a valid diagnostic of Tgas in disks. Since the end of the Herschel operation, the investigation of the far-infrared spectrum of disks has been limited to the very bright sources observable with SOFIA. Future observations with cryogenic facilities like SPICA will allow the analysis of the CO (and isotopologues) rotational ladder to be expanded to a much larger sample of protoplanetary systems, and will routinely measure the temperature structure of both flared and flat Herbig AeBe and T Tauri disks. In particular, the line flux ratio of several, mid- and high-J CO and 13CO will provide direct insights into the vertical (different τ) and radial (different J) temperature structure of protoplanetary disks if complemented by lower-J spectrally and spatially resolved data from ALMA and other instruments.
Acknowledgments
DF acknowledges support from the Italian Ministry of Science and Education (MIUR), project SIR (RBSI14ZRHR). The authors would like to thank the WISH team and L. Podio for providing the HIFI 12CO and 13CO J = 10–9 spectra of TW Hya and HD 163296. We are also grateful to the DIGIT and GASPS teams for providing the PACS spectra of CO. Astrochemistry in Leiden is supported by the Netherlands Research School for Astronomy (NOVA), by a Royal Netherlands Academy of Arts and Sciences (KNAW) professor prize, and by the European Union A-ERC grant 291141 CHEMPLAN.
References
- Andrews, S. M., Wilner, D. J., Espaillat, C., et al. 2011, ApJ, 732, 42 [NASA ADS] [CrossRef] [Google Scholar]
- Bast, J. E., Brown, J. M., Herczeg, G. J., van Dishoeck, E. F., & Pontoppidan, K. M. 2011, A&A, 527, A119 [NASA ADS] [CrossRef] [EDP Sciences] [Google Scholar]
- Bergin, E. A., Cleeves, L. I., Gorti, U., et al. 2013, Nature, 493, 644 [NASA ADS] [CrossRef] [PubMed] [Google Scholar]
- Bohlin, R. C., Savage, B. D., & Drake, J. F. 1978, ApJ, 224, 132 [NASA ADS] [CrossRef] [Google Scholar]
- Brittain, S. D., Najita, J. R., & Carr, J. S. 2009, ApJ, 702, 85 [NASA ADS] [CrossRef] [Google Scholar]
- Brown, J. M., Pontoppidan, K. M., van Dishoeck, E. F., et al. 2013, ApJ, 770, 94 [NASA ADS] [CrossRef] [Google Scholar]
- Bruderer, S. 2013, A&A, 559, A46 [NASA ADS] [CrossRef] [EDP Sciences] [Google Scholar]
- Bruderer, S., van Dishoeck, E. F., Doty, S. D., & Herczeg, G. J. 2012, A&A, 541, A91 [NASA ADS] [CrossRef] [EDP Sciences] [Google Scholar]
- Bruderer, S., van der Marel, N., van Dishoeck, E. F., & van Kempen, T. A. 2014, A&A, 562, A26 [NASA ADS] [CrossRef] [EDP Sciences] [Google Scholar]
- Chapillon, E., Parise, B., Guilloteau, S., Dutrey, A., & Wakelam, V. 2010, A&A, 520, A61 [NASA ADS] [CrossRef] [EDP Sciences] [Google Scholar]
- D’Alessio, P., Calvet, N., Hartmann, L., Franco-Hernández, R., & Servín, H. 2006, ApJ, 638, 314 [NASA ADS] [CrossRef] [Google Scholar]
- de Gregorio-Monsalvo, I., Ménard, F., Dent, W., et al. 2013, A&A, 557, A133 [NASA ADS] [CrossRef] [EDP Sciences] [Google Scholar]
- Dent, W. R. F., Thi, W. F., Kamp, I., et al. 2013, PASP, 125, 477 [NASA ADS] [CrossRef] [Google Scholar]
- Draine, B. T., & Li, A. 2007, ApJ, 657, 810 [NASA ADS] [CrossRef] [Google Scholar]
- Dutrey, A., Guilloteau, S., Prato, L., et al. 1998, A&A, 338, L63 [NASA ADS] [Google Scholar]
- Fedele, D., Bruderer, S., van Dishoeck, E. F., et al. 2013a, A&A, 559, A77 [NASA ADS] [CrossRef] [EDP Sciences] [Google Scholar]
- Fedele, D., Bruderer, S., van Dishoeck, E. F., et al. 2013b, ApJ, 776, L3 [NASA ADS] [CrossRef] [Google Scholar]
- Fedele, D., Bruderer, S., van den Ancker, M. E., & Pascucci, I. 2015, ApJ, 800, 23 [NASA ADS] [CrossRef] [Google Scholar]
- Geers, V. C., Augereau, J., Pontoppidan, K. M., et al. 2006, A&A, 459, 545 [NASA ADS] [CrossRef] [EDP Sciences] [Google Scholar]
- Gorti, U., & Hollenbach, D. 2008, ApJ, 683, 287 [NASA ADS] [CrossRef] [Google Scholar]
- Green, J. D., Evans, II, N. J., Jørgensen, J. K., et al. 2013, ApJ, 770, 123 [NASA ADS] [CrossRef] [Google Scholar]
- Jonkheid, B., Dullemond, C. P., Hogerheijde, M. R., & van Dishoeck, E. F. 2007, A&A, 463, 203 [NASA ADS] [CrossRef] [EDP Sciences] [Google Scholar]
- Kama, M., Bruderer, S., Carney, M., et al. 2016, A&A, 588, A108 [NASA ADS] [CrossRef] [EDP Sciences] [Google Scholar]
- Kamp, I., Tilling, I., Woitke, P., Thi, W.-F., & Hogerheijde, M. 2010, A&A, 510, A18 [NASA ADS] [CrossRef] [EDP Sciences] [Google Scholar]
- Kamp, I., Thi, W.-F., Meeus, G., et al. 2013, A&A, 559, A24 [NASA ADS] [CrossRef] [EDP Sciences] [Google Scholar]
- Koerner, D. W., & Sargent, A. I. 1995, AJ, 109, 2138 [NASA ADS] [CrossRef] [Google Scholar]
- Mannings, V., & Sargent, A. I. 1997, ApJ, 490, 792 [NASA ADS] [CrossRef] [Google Scholar]
- Meeus, G., Montesinos, B., Mendigutía, I., et al. 2012, A&A, 544, A78 [NASA ADS] [CrossRef] [EDP Sciences] [Google Scholar]
- Meeus, G., Salyk, C., Bruderer, S., et al. 2013, A&A, 559, A84 [NASA ADS] [CrossRef] [EDP Sciences] [Google Scholar]
- Miotello, A., Bruderer, S., & van Dishoeck, E. F. 2014, A&A, 572, A96 [NASA ADS] [CrossRef] [EDP Sciences] [Google Scholar]
- Panić, O., van Dishoeck, E. F., Hogerheijde, M. R., et al. 2010, A&A, 519, A110 [NASA ADS] [CrossRef] [EDP Sciences] [Google Scholar]
- Pontoppidan, K. M., Boogert, A. C. A., Fraser, H. J., et al. 2008, ApJ, 678, 1005 [NASA ADS] [CrossRef] [Google Scholar]
- Pontoppidan, K. M., Blake, G. A., & Smette, A. 2011, ApJ, 733, 84 [NASA ADS] [CrossRef] [Google Scholar]
- Qi, C., D’Alessio, P., Öberg, K. I., et al. 2011, ApJ, 740, 84 [NASA ADS] [CrossRef] [Google Scholar]
- Roelfsema, P. R., Helmich, F. P., Teyssier, D., et al. 2012, A&A, 537, A17 [NASA ADS] [CrossRef] [EDP Sciences] [Google Scholar]
- Salyk, C., Pontoppidan, K., Corder, S., et al. 2014, ApJ, 792, 68 [NASA ADS] [CrossRef] [Google Scholar]
- Sturm, B., Bouwman, J., Henning, T., et al. 2010, A&A, 518, L129 [NASA ADS] [CrossRef] [EDP Sciences] [Google Scholar]
- van den Ancker, M. E., de Winter, D., & Tjin A Djie, H. R. E. 1998, A&A, 330, 145 [NASA ADS] [Google Scholar]
- van der Plas, G., van den Ancker, M. E., Acke, B., et al. 2009, A&A, 500, 1137 [NASA ADS] [CrossRef] [EDP Sciences] [Google Scholar]
- van der Wiel, M. H. D., Naylor, D. A., Kamp, I., et al. 2014, MNRAS, 444, 3911 [NASA ADS] [CrossRef] [Google Scholar]
- van Kempen, T. A., Kristensen, L. E., Herczeg, G. J., et al. 2010, A&A, 518, L121 [NASA ADS] [CrossRef] [EDP Sciences] [Google Scholar]
- van Zadelhoff, G., van Dishoeck, E. F., Thi, W., & Blake, G. A. 2001, A&A, 377, 566 [NASA ADS] [CrossRef] [EDP Sciences] [Google Scholar]
- Visser, R., Geers, V. C., Dullemond, C. P., et al. 2007, A&A, 466, 229 [NASA ADS] [CrossRef] [EDP Sciences] [MathSciNet] [Google Scholar]
- Woitke, P., Kamp, I., & Thi, W. 2009, A&A, 501, 383 [NASA ADS] [CrossRef] [EDP Sciences] [Google Scholar]
Appendix A: CO rotational ladder
CO rotational ladder fluxes
The fluxes of the CO rotational lines up to J = 25–24 are listed in Table A.1. Data are from this work and from Bergin et al. (2013), Bruderer et al. (2014), Fedele et al. (2013b), Kamp et al. (2013), Meeus et al. (2013), Qi et al. (2011), van der Wiel et al. (2014; and references therein); and from Kama et al. (2016). The flux of the J = 6–5 in IRS 48 is a lower limit because the line is partially obscured by the molecular cloud (Bruderer et al. 2014). Some of the high-J line fluxes (J> 14–13) based on Herschel/PACS observations have been re-measured with the most recent update of the instrument’s calibration and some of the fluxes are slightly different than previous measurements. The J = 24–23 in TW Hya is blended with H2O 414−303.
Appendix B: [C ii]
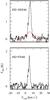 |
Fig. B.1 HIFI/WBS spectra of [C ii]. The base of the [C ii] line in HD 100546 is fitted with a Gaussian profile (red curve). |
[C ii] emission is detected at high S/N toward both sources (HD 97048 and HD 100546, Fig. B.1). The line is narrow with a Gaussian FWHM of ~3–4 km s-1. In the case of HD 97048 the peak of the emission is at vLSR ~ 5.1 km s-1, redshifted from the center of the CO J = 16–15 line by ~0.2 km s-1.
The analysis of the [C ii] profile toward HD 100546 is presented in Paper I and the spectrum is shown here for comparison with that of HD 97048. Because of the internal load chop used in combination with an off-source calibration with HIFI, some of the large-scale line emission is removed in the HIFI spectra. Given the large beam of HIFI at this frequency (11.̋1), the large-scale non-disk emission contributes most of the [C ii] flux and we conclude that the emission measured here is dominated by a diffuse, low-velocity gas not associated with the disk, i.e., a diffuse cloud or remnant envelope on a scale of 1000 au.
In the case of HD 100546, the base of the [C ii] line is broader than the core of the line as can be seen from the high-velocity wings. This broadening may be due to an underlying disk contribution. To quantify this, the line wings are fitted with a Gaussian profile centered at the system velocity (VLSR = 5.6 km s-1). The best-fit profile is shown in Fig. 1 (red curve). The fit is partly degenerate in the Gaussian height and width. Nevertheless, in order to fit the high velocity wings, the FWHM must range between ~7–8 km s-1. The disk [C ii] contribution is estimated by integrating the flux below the best-fit Gaussian profile and we find a value of ~8–9 × 10-17W m-2, corresponding to 4–5% of the total line flux. This value must be taken with caution for various reasons (e.g., the intrinsic line profile is not Gaussian).
No evidence of line broadening is detectable in the HIFI [C ii] spectrum of HD 97048. The upper limit to the [C ii] disk contribution is measured assuming a line peak equal to 0.3 K (3 ×rms, Table 1) and a line width of 7 km s-1 (similar to HD 100546). This gives a 3σ upper limit of 2.4 K km s-1 equivalent to 5.5 × 10⁻¹⁷W m-2.
Appendix C: Spectral energy distribution of representative models
The spectral energy distribution of the two representative disk models is shown in Fig. C.1.
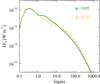 |
Fig. C.1 Spectral energy distribution of the two representative disk models. |
All Tables
All Figures
|
Fig. 1 HIFI/WBS spectra of CO J = 16–15 (top), J = 10–9 (middle and bottom), and 13CO J = 10–9 (bottom). The spectra of low-J lines are overlaid in red (scaled for comparison) in the top and middle rows. For clarity, some spectra were rebinned to lower resolution: for CO J = 16–15 dv = 0.8 km s-1 in HD 97048, HD 100546, and IRS 48, and dv = 0.32 km s-1 in S CrA; for CO J = 10–9 dv = 0.52 km s-1 in TW Hya and dv = 1.3 km s-1 in HD 163296; for 13CO J = 10–9 dv = 0.56 km s-1 in TW Hya and dv = 1.4 km s-1 in HD 163296. The remaining spectra are shown at their native resolutions. |
| In the text | |
|
Fig. 2 Top: CO rotational ladder. Detections are shown as filled circles and upper limits as open triangles. The solid lines represent the best-fit power-law model. Bottom: best-fit model profile of the CO J = 16–15 (HD 97048 and IRS 48) and CO J = 10–9 (HD 163296 and TW Hya). Spectral resolution as in Fig. 1. |
| In the text | |
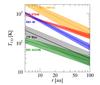 |
Fig. 3 CO temperature profile in the inner 100 au based on the best-fit power-law models (Table 2). |
| In the text | |
|
Fig. 4 DALI disk structure of the two representative models, ψ = 0.05 (left panels) and ψ = 0.25 (right panels). Top: gas density structure: the inset shows the inner disk structure, the dark blue curves indicate the ngas = 106,108, and 1010 cm-3 contours. The line contribution functions of a mix of low- and high-J transitions of 12CO (solid lines) and 13CO (dashed) are overlaid on the ngas panels. Each contour shows the layer where 50% of the line flux emerges. Middle: gas temperature structure, the isothermal contours are overlaid for Tgas and Tdust (dashed lines) = 20, 50, 100, 200, and 500 K. Bottom: gas temperature radial profile at different disk heights relevant to the disk midplane (z/r = 0.01) and to the CO emitting layers. |
| In the text | |
|
Fig. 5 Tgas radial profile for different disk/stellar parameters. The temperature radial profile is shown for the layers z/r = 0.01 (solid lines) and 0.6 (dot-dashed lines). In the case of hc = 1, the CO emitting layer is z/r ~ 0.2–0.3 and the dot-dashed line shows the temperature gradient at z/r = 0.3. |
| In the text | |
|
Fig. 6 Synthetic CO ladder for different disk parameters (see Table 3). Fluxes measured assuming a distance of 100 pc and a disk inclination of 45°. |
| In the text | |
|
Fig. 7 Synthetic CO ladders in the case of Tgas = Tdust case (representative models only). |
| In the text | |
|
Fig. 8 Synthetic 13CO ladders (representative models only). |
| In the text | |
|
Fig. 9 Synthetic CO ladder for the flared disk case (ψ = 0.25) with and without dust gap (dashed green and red curve, respectively). |
| In the text | |
|
Fig. 10 CO (top) and 13CO (bottom) line profiles computed with DALI as a function of dust settling and flaring angle for a disk inclination of i = 45°. The remaining parameters are fixed: hc = 0.2, Δgd = 100, Teff = 10 500 K, PAH = 1%, flarge = 0.85. |
| In the text | |
|
Fig. B.1 HIFI/WBS spectra of [C ii]. The base of the [C ii] line in HD 100546 is fitted with a Gaussian profile (red curve). |
| In the text | |
|
Fig. C.1 Spectral energy distribution of the two representative disk models. |
| In the text | |
Current usage metrics show cumulative count of Article Views (full-text article views including HTML views, PDF and ePub downloads, according to the available data) and Abstracts Views on Vision4Press platform.
Data correspond to usage on the plateform after 2015. The current usage metrics is available 48-96 hours after online publication and is updated daily on week days.
Initial download of the metrics may take a while.