Fig. 4
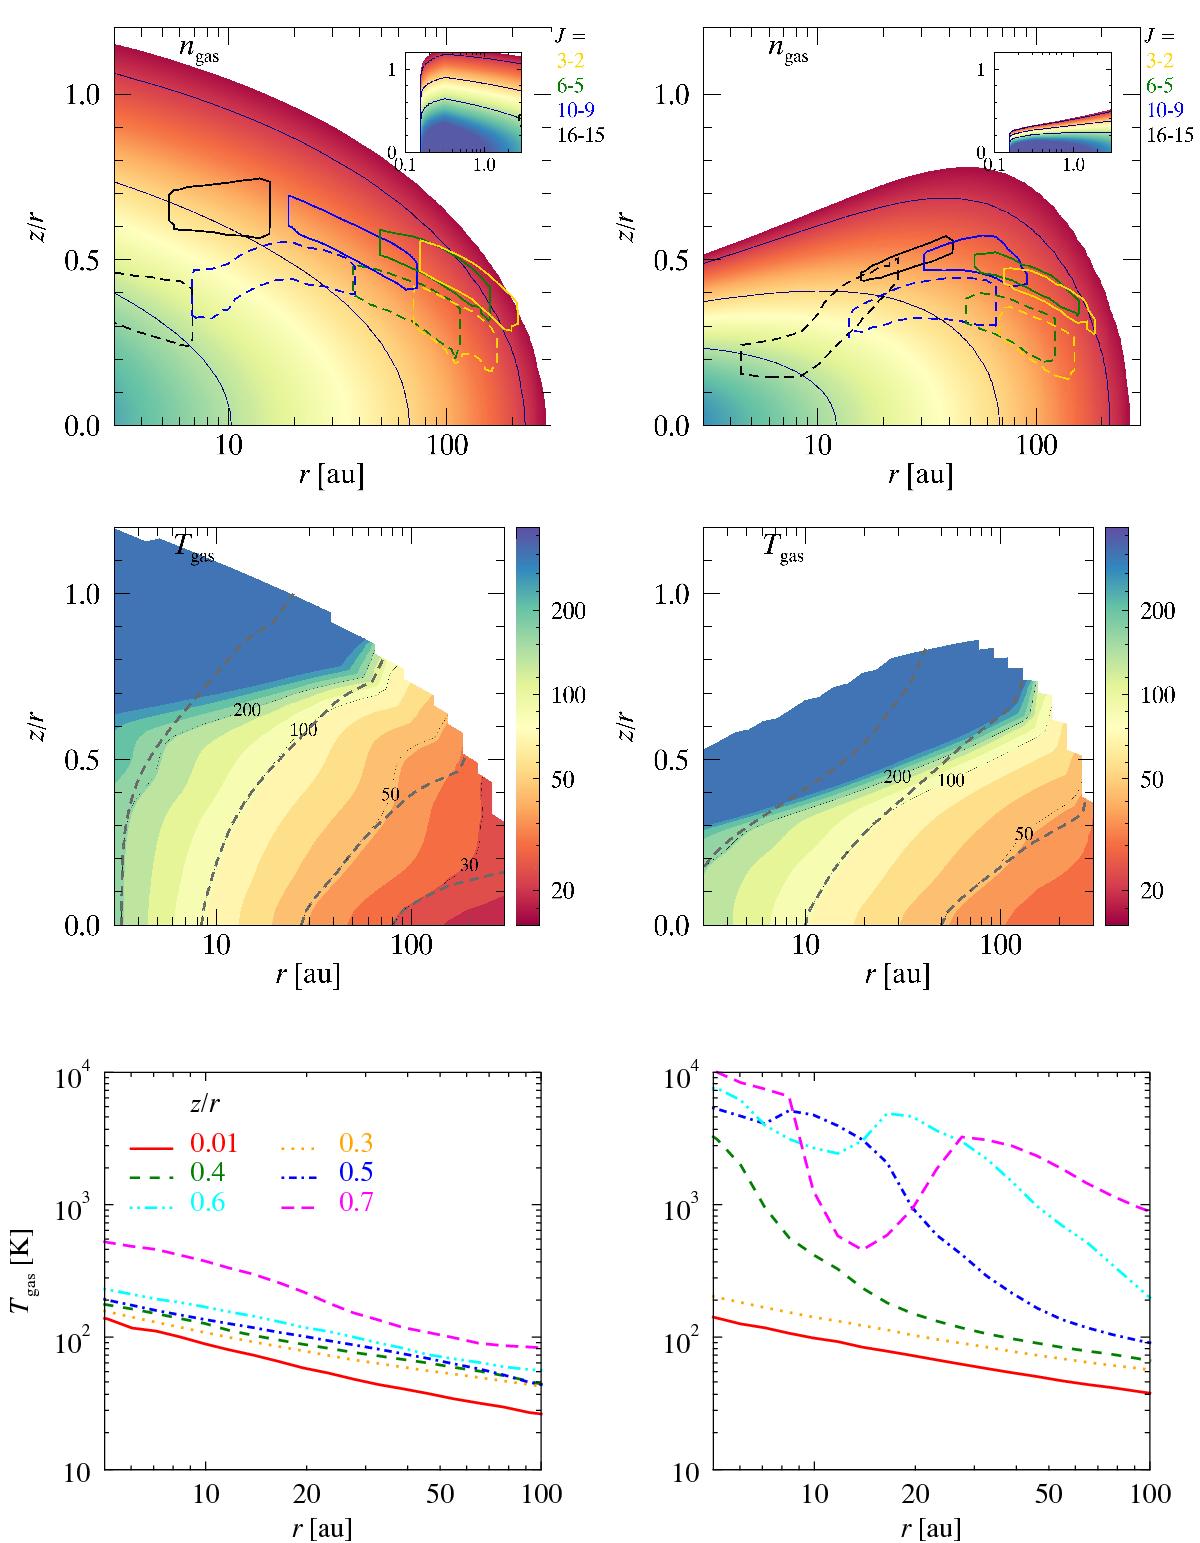
DALI disk structure of the two representative models, ψ = 0.05 (left panels) and ψ = 0.25 (right panels). Top: gas density structure: the inset shows the inner disk structure, the dark blue curves indicate the ngas = 106,108, and 1010 cm-3 contours. The line contribution functions of a mix of low- and high-J transitions of 12CO (solid lines) and 13CO (dashed) are overlaid on the ngas panels. Each contour shows the layer where 50% of the line flux emerges. Middle: gas temperature structure, the isothermal contours are overlaid for Tgas and Tdust (dashed lines) = 20, 50, 100, 200, and 500 K. Bottom: gas temperature radial profile at different disk heights relevant to the disk midplane (z/r = 0.01) and to the CO emitting layers.
Current usage metrics show cumulative count of Article Views (full-text article views including HTML views, PDF and ePub downloads, according to the available data) and Abstracts Views on Vision4Press platform.
Data correspond to usage on the plateform after 2015. The current usage metrics is available 48-96 hours after online publication and is updated daily on week days.
Initial download of the metrics may take a while.