Fig. 1
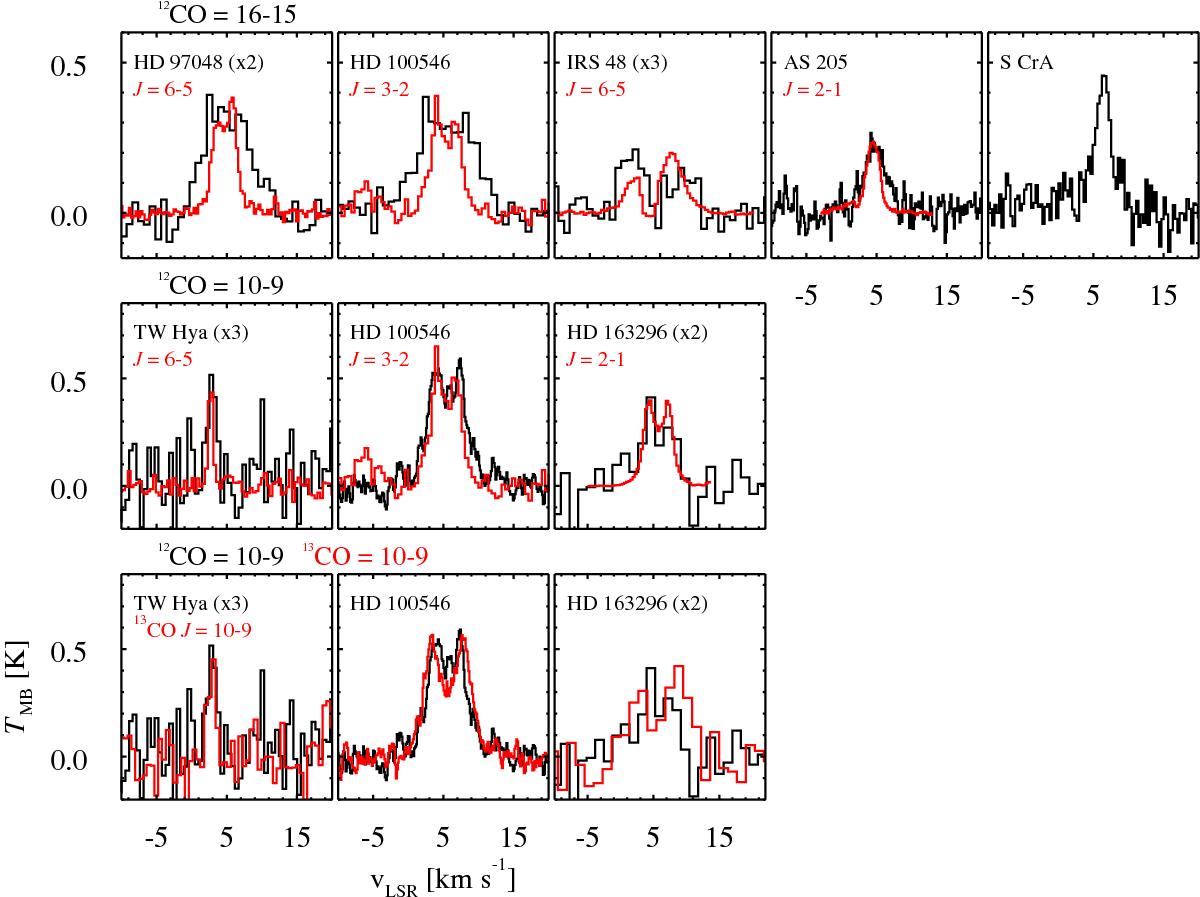
HIFI/WBS spectra of CO J = 16–15 (top), J = 10–9 (middle and bottom), and 13CO J = 10–9 (bottom). The spectra of low-J lines are overlaid in red (scaled for comparison) in the top and middle rows. For clarity, some spectra were rebinned to lower resolution: for CO J = 16–15 dv = 0.8 km s-1 in HD 97048, HD 100546, and IRS 48, and dv = 0.32 km s-1 in S CrA; for CO J = 10–9 dv = 0.52 km s-1 in TW Hya and dv = 1.3 km s-1 in HD 163296; for 13CO J = 10–9 dv = 0.56 km s-1 in TW Hya and dv = 1.4 km s-1 in HD 163296. The remaining spectra are shown at their native resolutions.
Current usage metrics show cumulative count of Article Views (full-text article views including HTML views, PDF and ePub downloads, according to the available data) and Abstracts Views on Vision4Press platform.
Data correspond to usage on the plateform after 2015. The current usage metrics is available 48-96 hours after online publication and is updated daily on week days.
Initial download of the metrics may take a while.