| Issue |
A&A
Volume 590, June 2016
|
|
|---|---|---|
| Article Number | A45 | |
| Number of page(s) | 9 | |
| Section | Stellar structure and evolution | |
| DOI | https://doi.org/10.1051/0004-6361/201628224 | |
| Published online | 10 May 2016 | |
GU Monocerotis: A high-mass eclipsing overcontact binary in the young open cluster Dolidze 25⋆
1
Departamento de Física, Ingeniería de Sistemas y Teoría de la Señal,
Escuela Politécnica SuperiorUniversidad de Alicante,
Carretera de San Vicente del Raspeig s/n, 03690 San
Vicente del Raspeig,
Alicante,
Spain
e-mail:
fjle3@alu.ua.es
2
Institut d’Estudis Espacials de Catalunya,
Edifici Nexus, c/ Capitá, 2−4,
desp. 201, 08034
Barcelona,
Spain
3
Instituto de Astrofísica de Canarias, Vía Láctea s/n, 38200 La Laguna, Tenerife, Spain
4
Departamento de Astrofísica, Universidad de La Laguna, Facultad de
Física y Matemáticas, Avda.
Astrofísico Francisco Sánchez s/n, 38205 La Laguna, Tenerife, Spain
5
Departamento de Lenguajes y Sistemas Informáticos, Universidad de
Alicante, Apdo. 99,
03080
Alicante,
Spain
6
Departamento de Ciencias, IES Arroyo Hondo, c/ Maestro Manuel Casal 2, 11520
Rota, Cádiz,
Spain
Received: 30 January 2016
Accepted: 3 March 2016
Context. The eclipsing binary GU Mon is located in the star-forming cluster Dolidze 25, which has the lowest metallicity measured in a Milky Way young cluster.
Aims. GU Mon has been identified as a short-period eclipsing binary with two early B-type components. We set out to derive its orbital and stellar parameters.
Methods. We present a comprehensive analysis, including B and V light curves and 11 high-resolution spectra, to verify the orbital period and determine parameters. We used the stellar atmosphere code FASTWIND to obtain stellar parameters and create templates for cross-correlation. We obtained a model to fit the light and radial-velocity curves using the Wilson-Devinney code iteratively and simultaneously.
Results. The two components of GU Mon are identical stars of spectral type B1 V with the same mass and temperature. The light curves are typical of an EW-type binary. The spectroscopic and photometric analyses agree on a period of 0.896640 ± 0.000007 d. We determine a mass of 9.0 ± 0.6 M⊙ for each component and for temperatures of 28 000 ± 2000 K. Both values are consistent with the spectral type. The two stars are overfilling their respective Roche lobes, sharing a common envelope and, therefore the orbit is synchronised and circularised.
Conclusions. The GU Mon system has a fill-out factor above 0.8, containing two dwarf B-type stars on the main sequence. The two stars are in a very advanced stage of interaction, with their extreme physical similarity likely due to the common envelope. The expected evolution of such a system very probably leads to a merger while still on the main sequence.
Key words: stars: distances / binaries: spectroscopic / stars: fundamental parameters / binaries: eclipsing / binaries: close
Photometry tables are only available at the CDS via anonymous ftp to cdsarc.u-strasbg.fr (130.79.128.5) or via http://cdsarc.u-strasbg.fr/viz-bin/qcat?J/A+A/590/A45
© ESO, 2016
1. Introduction
Understanding the effects of binary interaction on the evolution of high-mass stars has become a very active topic of research. The relationship between fast rotation and binary interactions is widely discussed (e.g. Langer 2012), since it can perhaps explain the observed distribution of rotational velocities among O-type stars (Simón-Díaz & Herrero 2014).
One of the possible consequences of binary interaction is the formation of high-mass stars via a merger channel. Mergers have been considered a possible mechanism to form massive stars, however, direct collisions of stars in open clusters require extremely dense clusters (≈108 stars pc-3; Clarke 2006). If the merger happens in a binary, the stellar density required to induce mergers is ≈106 stars pc-3 (Bonnell & Bate 2005), which is two orders of magnitude smaller than the stellar density for direct collisions. On the other hand, the binary fraction in young clusters can achieve percentages of 75% (Hu et al. 2007; Sana et al. 2012). Thus, it is not difficult to envisage a scenario in which high-mass stars form as a result of binary systems whose components end up merging. Mergers are more likely to occur in dense stellar environments, where they are induced by dynamical perturbations (e.g. Banerjee et al. 2012).
Recently, de Mink et al. (2014) simulated populations of high-mass stars, assuming a constant star formation rate. They found that the products of mergers resulting from close binary systems account for 8 of a sample of early-type stars. In total,
  of high-mass, main-sequence stars are the products of binary interactions (de Mink et al. 2014). Observationally, the binary star MY Camelopardalis, a member of the very young cluster Alicante 1 (Negueruela & Marco 2008), was shown to be composed of two rather massive stars (M∗ ≳ 30 M⊙) in a close orbit with orbital parameters such that it should merge according to standard binary evolution models (Lorenzo et al. 2014).
Another possible consequence of binarity is the formation of blue stragglers in young open clusters. The validity of the coalescence of a binary system as a mechanism to form blue stragglers has been discussed in several works (e.g. Zinn & Searle 1976). This kind of mechanism is generally studied with regard to low-mass stars (e.g. Leonard & Linnell 1992; Beccari et al. 2013). However, blue stragglers in young open clusters may also be related to binary interactions (Marco et al. 2007). There are two possible scenarios, depending on the initial binary separation. A star may become a blue straggler because it accretes material from a companion, thus rejuvenating itself (Wellstein & Langer 1999). The companion then continues its evolution, leading to the possibility of a second binary interaction, unless the system is disrupted in a supernova explosion. The other option is the merger of two high-mass stars, if the initial separation is sufficiently small, as discussed above.
In this paper we analyse the properties of a probable progenitor to a high-mass merger, GU Mon. GU Mon is an eclipsing binary located in Dolidze 25, a very young open cluster in the Galactic anticentre associated with the distant H ii region Sh-2284 (Sharpless 1959). The galactic coordinates of GU Mon are  and
and  . In a recent paper (Negueruela et al. 2015, henceforth Paper I), we derive a distance of 4.5 kpc to the Dolidze 25 the cluster, showing that the stars in this cluster present very low abundances of oxygen and silicon: about 0.4 dex below the solar value, making Dolidze 25 the young open cluster with the lowest metallicity known in the Milky Way. GU Mon is star 13 in Dolidze 25, according to the numbering system of Moffat & Vogt (1975), who identify it as an early-type star. Using a very-low-dispersion spectrogram, Babu (1983) classified GU Mon as B8 V with an apparent magnitude of V = 12.3. Later, Lennon et al. (1990) took a spectrum of the star and identified it as an early-B star with broad lines. GU Mon was catalogued as an eclipsing binary of EW type by Zejda (2002), who derived a period of 0.89668149 d. Kreiner (2004) revised the ephemeris for a wide collection of eclipsing binaries, finding a period of 0.8966485 d and HJD 2 452 500.5891 as time of minimum for GU Mon. Hubscher et al. (2005) calculated new times of minima, using photoelectric photometry, that were 950 cycles after the previous minimum (HJD 2 453 352.4110 in the heliocentric system). GU Mon lies within the field of view of the CoRoT space mission. The photometric light curve of this system was analysed by Maciel et al. (2011), who derived a period of 0.897 d, an inclination of the orbit of
  , and mass ratio of 0.9, under the hypothesis that the two components had spectral type F2 II. The choice of this spectral type, at odds with all previous determinations, is not explained, and likely based on the assumption that the star is not reddened.
In the following, we present a comprehensive analysis of GU Mon, deriving its orbital and physical parameters. GU Mon represents an example of a high-mass binary system in a young open cluster whose components are already in a common envelope. Because the fraction of the Roche lobe already shared, both stars will in all likelihood merge. We suggest that GU Mon represents a crucial stage in the evolution of such systems, presenting a “peanut-shaped” surface. The paper is arranged as follows: We first describe the observations consisting of a spectroscopic survey and photometric data. Then we carry out a comprehensive spectroscopic analysis, including spectral classification, morphological description of the spectrum, determination of the radial velocity and spectrum modelling. After this, we analyse the radial velocity and light curves, and show the results of the orbital parameters obtained from the Wilson-Devinney code. Finally, we discuss the evolutionary state of GU Mon and present our conclusions.
2. Observations
We carried out the spectroscopic observations with the high-resolution FIbre-fed Echelle Spectrograph (FIES) attached to the Nordic Optical Telescope (NOT), located at the Observatorio del Roque de los Muchachos (La Palma, Spain) between 2011 January 13 and 16. Eleven spectra were registered with exposure times of 1800 s. The signal-to noise ratio achieved is between 30 and 50. We selected the low-resolution mode (R = 25 000), which covers the spectral range between 3700 and 7300 Å without gaps in a single, fixed setting (Telting et al. 2014). The spectra were homogeneously reduced using the FIEStool1 software in advanced mode. A complete set of bias, flat, and arc frames obtained each night were used to this aim. For wavelength calibration, we used arc spectra of a ThAr lamp. Heliocentric corrections were calculated using the RV programme included in the starlink suite. We list the HJD, date, and signal-to noise ratio for every spectrum in Table 1. Spectra are numbered and sorted by date in ascending order.
Log of spectroscopic observations.
In addition, lower resolution spectroscopy was obtained with the ISIS double-beam spectrograph, mounted on the 4.2 m William Herschel Telescope (WHT) in La Palma (Spain). The observations were taken in service mode on the nights of 4−8 November 2011 with exposure time of 900 s (2 × 450 s poses). The blue arm of the instrument was equipped with a R1200B grating and an EEV12 CCD. This configuration covers an unvignetted range of ≈650 Å with a nominal dispersion of 0.23 Å/pixel. To observe the whole classification range, as shown in Fig. 3, two exposures were taken, centred on 4250 and 4900 Å. With a  slit, the resolution element is about 1.2 Å, giving a resolving power in the classification region R ~ 4000. The red arm was equipped with the R1200R grating and the Red+ CCD, which provides similar coverage and dispersion. Two exposures, centred on 5600 and 6800 Å were taken. These spectra are listed at the bottom of Table 1, as ♯12 and ♯13, but they were not used for radial velocity determination because of the lower resolution and lack of radial velocity templates.
Photometric data were obtained with two 8-inch aperture telescopes, a Meade LX200 and a Vixen VISAC, with focal ratios of f/6.3 and f/9, respectively. The observing locations have coordinates: 36°37′31″ north, 6°21′43″ west and  north,
  west, respectively. Observations were made through Johnson B and V filters, with uniform 120 s exposures, although the two filters were used on different nights. We reduced the data with the standard commercial software packages AIP4Win and Mira Pro. We followed the standard procedures for bias and flat corrections. A total of 1138 photometric V-band points were registered, and randomly distributed in night series between JD 2 454 875 (12/2/2009) and 2 457 048 (26/1/2014). Later 780 B-band photometric points were observed between 1 February 2015 and 5 March 2015. Photometric values were derived differentially with respect to two reference stars with similar colours in the same frame: UCAC4 452-022165 (V = 11.75 mag in APASS) and UCAC4 452-022241 (V = 11.45 mag in APASS). The former is Star 14 in Dolidze 25, using the WEBDA numbering system, and is likely a foreground late-B star. The latter is Star 17 in Dolidze 25, a cluster member with spectral type O7 Vz (Paper I).
The two light curves are shown in Figs. 1 and 2. Strong photometric variability with an amplitude of approximately 0.64 mag is apparent for both filters.
 |
Fig. 1 Photometric light curve for the V filter, showing the amplitude of the modulation. |
 |
Fig. 2 Photometric light curve for the B filter, showing a very similar amplitude of the modulation. |
Even though photometry for the system is available in the CoRoT database, these data are derived from a white light curve, which is the sum of the three chromatic light curves from the CoRoT three-colour photometry (Auvergne et al. 2009). The three CoRoT channels (red, green, and blue) do not represent any standard photometric system and, therefore, their response to extinction is unknown. Thus, we found that it was necessary to obtain new light curves in standard Johnson filters, so that a distance to the system could be calculated. Given the quality of our own photometric series, we do not include the CoRoT data in our analysis.
3. Spectroscopic analysis: radial velocity determination
For spectral classification of GU Mon, we used the ISIS spectra, which have a much higher signal-to-noise ratio. The spectrum is shown in Fig. 3. We based our classification on the criteria of horizontal classification by Walborn et al. (1990). Given the complete absence of He ii lines, we used as comparison the spectrum of the B1 V star ω1 Sco of the OB spectral atlas. The spectra are very similar. We notice the weakness of Si iv 4089 Å and the stronger Si iii triplet (4552−68−75 Å). We also notice O ii lines (perhaps blended with C iii) at 4070−72 Å and 4650 Å. The spectrum is dominated by He i lines (e.g. 4009 Å, 4026 Å, 4121 Å, 4144 Å, 4387 Å, 4471 Å and 4713 Å). Even at this resolution, GU Mon is recognisably a double-lined spectroscopic binary. In the higher resolution FIES spectra, double lines are seen in all the observations, except spectrum ♯8, which corresponds to a near eclipse phase. The interstellar H and K lines of Ca ii can be seen as very narrow features at 3934 and 3969 Å (see Fig. 3).
 |
Fig. 3 Classification spectrum of GU Mon. Labels identify the most characteristic spectral lines. The region shown in blue (between 4000 and 5000 Å) represents the spectral range selected for the cross-correlation. D.I.B indicates the main diffuse interstellar bands. |
The cross-correlation method is a widespread and reliable technique for deriving radial velocities of the two components of composite spectra. In the case of OB stars, in which spectral lines are very wide owing to high rotation, this is the best method to determine accurate radial velocities. We used the TODCOR technique based on cross-correlation in two dimensions (Zucker & Mazeh 1994), which should reduce the problems caused by blending effects (Southworth & Clausen 2007). The observational spectrum is simultaneously cross correlated with a combination of two templates. Also, TODCOR is specially useful for the analysis of binary spectra with small velocity differences. Before computing TODCOR, we had to choose suitable templates. The templates selected were two synthetic spectra derived from the atmosphere model fit to the observed spectra, obtained using the FASTWIND code (Puls et al. 2005; Santaloya-Rey et al. 1997). The spectral range between 4000−5000 Å was chosen for the analysis, because it includes the main He i lines (4009, 4026, 4121, 4144, 4387, 4471, 4713 and 4920 Å) as well as Hδ, Hγ, and Hβ. Although Andersen et al. (1980) conclude that the use of the Balmer lines in the cross-correlation could lead to an underestimation of the mass of up to 40% compared to a solution with only He i lines, we used all of the atmospheric lines in the spectral range chosen. A solution leaving out the Balmer lines results in a slightly higher mass for the stars, by about 4%, but much higher standard deviations in the fit to the radial velocity (typically σ ≈ 24 km s-1.)
We performed spectrum modelling following a strategy similar to that described in Lorenzo et al. (2014) and Simón-Díaz et al. (2015). In brief, the stellar parameters were obtained from a by-eye comparison of the H and He i/He ii profiles from the grid of FASTWIND synthetic spectra described in Simón-Díaz et al. (2011, these are spectra with Z = Z⊙, and spectrum ♯6 of GU Mon (see numbering in Table 1). This spectrum was chosen because the two components are clearly separated and the wings of the Balmer lines can be used to determine the effective gravity with accuracy. The signal-to-noise ratio of this spectrum is higher than those of other spectra at similar orbital phases. In the analysis process, the synthetic spectra were shifted to the radial velocities indicated in Table 2 and convolved with a projected rotational velocity2 (v sin i) of 270 km s-1. We found that both stars are equally contributing to the spectrum and have very similar effective temperatures and gravities (Teff = 28 000 ± 2000 K, log g = 4.1 ± 0.2 dex). In addition, a normal helium abundance (YHe = 0.10) and a low value of the wind strength parameter3 (Puls et al. 1996) were needed to result in a good fit in the two components.
Radial velocities and residuals for both components of GU Mon, sorted by orbital phase.
In Fig. 4, we show the quality of the fitting to the most relevant H, He i and He ii diagnostic line profiles.
While the Si iv/Si iii ionisation balance is better suited to constrain the effective temperature in the case of B0−B2 stars (e.g. Simón-Díaz 2010), the high v sin i of both components of GU Mon, combined with the low signal-to-noise of the spectrum, did not allow us to use these weaker lines; hence, the relatively large uncertainty in the derived temperatures.
 |
Fig. 4 Some representative H, He i and He ii lines in the spectrum of GU Mon (♯6 in Table 1) in used to derive the rotational velocities and stellar parameters of both components. The red solid line is the combined best fitting FASTWIND synthetic spectrum. |
The radial velocities of the spectra observed were obtained by applying the TODCOR technique with the two templates mentioned. Spectra and templates were rebinned to a length of 10 000 bins. The centre of the search area was fixed at zero km s-1, because all the spectra were corrected to their heliocentric velocities. The apodisation factor was set to 5% of the edges of the spectra. Radial velocities and residuals are presented in Table 2, which are discussed in the next section.
4. Combined analysis: photometry and spectroscopy
To derive the orbital parameters of GU Mon, we have performed light curve (LC) and radial velocity curve (RVC) analysis together. We used a programme based on the generalised Wilson-Devinney (WD) code (Wilson & Devinney 1971) in its 2010 version, assuming the Roche model, and the most accurate approximations are based on the principle of equipotential surfaces. We obtain the LCs and RVC models by fixing some parameters and computing the rest via differential corrections until a free parameter adjustment of LCs and RVC is reached according to the least-squares criterion. We assumed that GU Mon is a contact system, in which case circularisation and synchronisation are acceptable approximations. We chose mode 1 of the WD code, corresponding to overcontact binaries. In this case, the surface potentials are the same for both stars (Ω1 = Ω2). The radiative model for both components of the binary system is an atmosphere model by Kurucz (1993). The surface is divided into a grid of 40 × 40 elements for every star. To improve the convergence of the solution, we chose symmetrical derivatives (Wilson & Biermann 1976). The code can apply the detailed reflection model of Wilson (1990), a treatment especially recommended with overcontact binaries. We have also considered proximity effects on both stars. A square root limb-darkening law was applied during the process, as it is an order of magnitude more precise than the linear law (van Hamme 1993). The bolometric albedos of both components were fixed at A1 = A2 = 1, because the atmospheres are expected to be in radiative equilibrium (von Zeipel 1924). Because of local energy conservation, this also implies gravity brightening exponents g1 = g2 = 1. Other constraints applied are described in mode 1 of the WD code.
A preliminary analysis of the spectroscopy provided the initial values for parameters such as period, zero point of ephemeris, and so on. The stellar parameters, such as temperatures, are derived from the atmosphere model. The temperature ratio is not an adjustable parameter during the convergence process. This is a compulsory constraint due to the morphology of the binary star, wherein both components share a volume of their Roche lobes and thermal contact is assumed.
The process to convergence of all free parameters is iterative and simultaneous for all observables analysed, i.e. the radial velocity curves and light curves. The criterion for convergence adopted is that, for three consecutive iterations, all adjustable parameters must be within two standard deviations. Once convergence is reached, five solutions are derived by varying the parameters within the standard deviation and fitting the observations again. We choose the fit with the smallest dispersion as a final solution.
Stellar parameters derived from the combined analysis of the radial velocity and photometric light curve.
4.1. Light curves
We classify the light curve of GU Mon phenomenologically. GU Mon as an eclipsing variable of the EW type. The differences between star 1 and star 2 are so small that they are almost indistinguishable. To quantify this similarity, we explored whether there was any difference between the two photometric minima. We averaged all photometric data points between φ = 0.99 and 0.01, and all points between φ = 0.49 and 0.51, obtaining a difference of six-tenths of a millimagnitude for the V filter and 2 millimagnitudes for the B filter. In both cases, this is smaller than the intrinsic dispersion (σ) of the corresponding light curve. Accordingly, it is not possible to decide which is the primary minimum and which the secondary minimum. In this case, any of the eclipses can be considered primary, and so the zero-time of ephemeris can be chosen with half-cycle difference, as noted in the literature (Zejda 2002). There is no plateau between the eclipses. The light curve exhibits a continuous and monotone shape along the cycle. This shape of the model light curve confirms that both stars are filling and sharing their Roche lobes. We made sure that the zero phase of the LCs fit corresponds to the zero phase of the orbital solution. As a further check, we also determined the period of the system from the LCs and RVC independently, obtaining the same value for both methods. The difference between the photometric and spectroscopic period is less than one second and, thus, they are the same within errors. As mentioned above, the temperature was assumed to be the same for both stars and fixed to 28 000 K. The luminosity was considered a free parameter, together with the surface potential of the stars (see Table 3). Then LCs for both filters are shown in Fig. 5; the model of light curve and residuals yield a σV ≈ 0.013 and σB ≈ 0.019. Almost all the residuals are under 0.05 mag for the V filter and under 0.09 mag for the B filter, showing in any case an excellent fit.
The linear ephemeris equation, where the epoch of successive times of primary-eclipse minima (phase zero), Tmin, is calculated from the period and zero-time ephemeris as  where E is the integer value of the number of orbital cycles.
 |
Fig. 5 Light curve model fitted to the observational data in V filter (green) and B filter (blue). Residuals are shown in the top panel. |
4.2. Radial velocity curve
Simultaneously with the LCs analysis, we derived some orbital parameters, such as systemic velocity, mass ratios and semimajor axis (see Table 3) by fitting the RVC, which is shown in Fig. 6 (bottom panel). Both stars have the same semi-amplitude of the velocity and, as with the LC analysis in Sect. 4.1, we cannot assign the classical designation of primary and secondary star: both have the same mass. Therefore, as in Sect. 4.1, we stick to the designations star 1 and star 2. In Fig. 6, each radial velocity is indicated with the number corresponding to the spectrum in Table 1. Even though the eccentricity is zero, we can distinguish a significant deviation from a sinusoidal shape. This is likely due to the distortion created in the stars by the proximity effects. Residuals are shown in Fig. 6 (top). The fit to the RVC of star 1 gives smaller residuals (σ ≈ 8 km s-1) than the fit obtained for star 2 (σ ≈ 13 km s-1). As expected, the fit shows that both stars share the same systemic velocity.
We sorted the radial velocities according to the orbital phase (see Table 2 and Fig. 6). Residuals are in all cases below 25 km s-1. Taking the proximity of the stars and the width of the spectral lines due to high rotational velocity into account, the model fit can be considered very good.
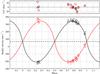 |
Fig. 6 Radial velocity curves fitted to the observational data and shown against orbital phase (black line: star 1; red line: star 2). The dashed line corresponds to the systemic velocity. The residuals are shown in the top panel. |
4.3. Results
We derived stellar parameters for both components of GU Mon (listed in Table 3), using simultaneous solutions for the LCs and RVC, as explained in the previous section. The uncertainties in the parameters were computed by propagating the uncertainties in the observed quantities. The eccentricity was assumed to be zero, as the review of Torres et al. (2010) shows that no measurable eccentricity was found for any system with a period below 1.5 d. Under these conditions, we can expect that the system has circularised. Based on the timescales for synchronisation and circularisation given by Zahn (1977), we can expect tsync ~ 105 yr and tcirc ~ 107 yr for the stellar masses found in GU Mon. These timescales are very strongly dependent on the ratio (a/R): the separation divided by the stellar equatorial radius. For very short periods and R/a ~ 0.5, as we see in GU Mon, we can reasonably expect a synchronous rotation and a circular orbit, as we verified in our results. The projected rotational velocity obtained from the modelling is 268 ± 5 km s-1, while the semi-amplitude of the orbital velocity is 276 ± 6 km s-1. Given that the spectral modelling supports a rotational velocity for both components in the 250−300 km s-1 (with a favoured value around 270 km s-1), the assumption of synchronisation seems to be fully supported, and we conclude that both stars are tidally locked. In fact, if we study the variation of the equatorial radii due to proximity effects, we can deduce projected rotational velocities in a range from 245 km s-1 (corresponding at equatorial angle of  and its explementary angle of
  , both measured from the semimajor axis) to 355 km s-1; this is close to the point radius, which is unapproachable for the calculation because the two components share their gaseous envelopes.
GU Mon is an overcontact system, because the effective radius of the Roche lobe (Eggleton 1983) is 3.63 R⊙, and so the radii of both stars are larger than the effective radius of the Roche lobe (see Fig. 7). The fill-out factor (here calculated according to the description on page 110 of Kallrath & Milone 2009) expresses the degree of contact for the binary system. If we consider the equatorial radius pointing to the other component, the fill-out factor of GU Mon is ~0.8. A fill-out factor equal to unity would imply that the normalised surface potential is equal to the outer normalised surface potential passing through the Lagrangian point L2. Therefore the two stars are not only touching, but share a substantial fraction of their envelopes. In view of this, we can speculate about the possibility that the indistinguishability of the two stars is a consequence of mass transfer, which has led to an object that is, in many senses, a single star with two cores.
 |
Fig. 7 Representative drawing of GU Mon to scale at quadrature phase, created with the PHOEBE 2.0-alpha code via the Python interface. |
Eclipsing binaries allow the derivation of geometrical distances to the systems, which can be very precise (e.g. Southworth et al. 2004; Vilardell et al. 2010). In overcontact binaries, there are many complications, owing to the interaction and geometrical distortion, but a direct distance estimate is still possible from the stellar parameters. We used the effective temperature 28 000 K, obtained from the atmosphere model fit to compute a distance-dependent flux, in standard physical units, including those proximity effects supported by the model. This procedure, although approximate, is more accurate than the simple use of the mean radii. We follow the procedure described in Vilardell et al. (2010). The parameters used are showed in Table 4, together with our distance calculation, 3.8 ± 0.5 kpc. The large error is mainly due to the relatively large uncertainties in the extinction and the bolometric correction. Indeed, the uncertainty in the extinction is underestimated, because we simply assumed a standard extinction law as this seemed sufficient to describe the reddening of most cluster members (Paper I).
Parameters resulting from the direct estimation distance of GU Mon.
5. Discussion
We calculated full orbital and stellar parameters for GU Mon. Our model fits to the light curves and the RVC are very good given the quality of the spectroscopic data. All the stellar parameters derived from the atmosphere model agree with those deduced from the orbital analysis. The projected rotational velocity was discussed in the previous section in the context of circularisation. In the case of surface gravity, the agreement is perfect. The atmosphere model gives  = 4.1 ± 0.2 and the orbital analysis, = 4.07 ± 0.04. Therefore we can be sure that the stars are on the main sequence, and not far from the ZAMS. Finally, the direct distance estimation to GU Mon is 3.8 ± 0.5 kpc; this distance is compatible within errors with the distance derived for the cluster Dolidze 25 of 4.5 ± 0.5 kpc, based on several indicators (Paper I). The systemic velocity of GU Mon is 68 ± 5 km s-1 in the heliocentric system, which corresponds to vLSR = 54 ± 5 km s-1. As shown in Paper I, other members of this cluster show radial velocities between 45 ± 3 km s-1 and 48 ± 3 km s-1. The radial velocity of GU Mon is thus fully compatible with cluster membership.
The masses of the two components of GU Mon are broadly compatible with their spectral type, but they are slightly lower than expected. The solution obtained by applying TODCOR while masking the Balmer lines gives masses of 9.4 M⊙. This value lies within the uncertainty calculated (see Table 3). Given the much higher residuals in the radial velocity curve fit, we decided to stick to the result obtained with the whole set of lines. For comparison, we can consider some other binaries with B1 V components. The overcontact system V701 Sco, which is discussed below, contains two identical stars with mass ≈10.2 M⊙ (Table 5). Among detached binaries, one of the best examples is DW Car, which is a member of the very young open cluster Collinder 228, whose components were both classified as B1 V. With an orbital period of 1.3 d, they have masses of 11.34 ± 0.12 and 10.63 ± 0.14 M⊙ (Southworth & Clausen 2007; Clausen et al. 2007). This object is almost certainly a pre-contact binary, and both components still seem to be very compact, as in GU Mon. The cooler component of V578 Mon, in the very young cluster NGC 2244, has a temperature and radius similar to those of GU Mon; this component has a mass of 10.3 M⊙ (Hensberge et al. 2000). V578 Mon is also a pre-contact system. Finally, V Pup is a post-mass transfer system, where the B1 V primary (very likely the star gaining mass) has a mass of 12.5 M⊙ (Stickland et al. 1998).
Close binaries with early-type stars on the main sequence and orbital period shorter than one day (extracted from Polushina 2004).
 |
Fig. 8 Location of the two “twin” components of GU Mon in the spectroscopic HR diagram, including the uncertainties in Teff and log L. Three sets of tracks from the Geneva group are overplotted to illustrate the effects of metallicity and rotation. Only the ZAMS for the non-rotating models at solar metallicity is shown. |
The relatively low masses for the components of GU Mon may be partially explained by the low metallicity of Do 25. With an oxygen abundance −0.4 dex below solar, Do 25 has a metallicity that is lower than the LMC. Stars at lower metallicity are known to be more compact and hotter at a given mass. To check this effect, in Fig. 8 we plot the position of the components of GU Mon in the spectroscopic HR diagram (Langer & Kudritzki 2014), together with theoretical isochrones from the Geneva group corresponding to solar and SMC-like metallicities (Ekström et al. 2012; Georgy et al. 2013). The metallicity of Do 25 falls approximately between the two, somewhat closer to the SMC. The solar metallicity tracks would indicate masses of ≈13 ± 2 M⊙ for each of the stars, which is higher than any of the B1 V stars in eclipsing binaries, even though the values of Teff and log g that we find for GU Mon can be considered typical of the spectral type. This is probably a reflection of the well-known discrepancy between evolutionary masses and other determinations. For SMC metallicity, the mass of the stars would be ≈11 ± 2 M⊙; this mass is still higher than the dynamical values, but now compatible within errors.
On the other hand, the fact that numerous metallic lines are clearly seen in the spectrum even at this low metallicity means that the spectral type cannot be later than B1. Several weak O ii lines that have disappeared by B2 V are clearly seen in Fig. 3 in spite of the high rotational velocity. Even at B1.5 V, the C ii 4267 Å line should be rather stronger than the lines surrounding it, unless carbon is severely depleted. The spectrum shows no evidence for the nitrogen enhancement that generally accompanies carbon depletion, however, and that could be a signature of chemical mixing. Therefore we have to conclude that the components of GU Mon are two “normal” low-metallicity B1 V stars. A possible reason for their anomalous position in the sHR diagram is the inability of theoretical models of single stars to reproduce the properties of stars in close contact. As of now, there are no theoretical models for high-mass binaries that are able to predict the physical properties of the stars during the overcontact phase. In support of this possibility, we have to note that all the B1 V stars with dynamical masses listed in the preceding paragraphs have lower masses than predicted by the solar metallicity tracks. According to Almeida et al. (2015), this also implies that a realistic treatment of heat transfer during the contact phase is missing. If so, the masses derived from our analysis could be less accurate than what the formal errors of the WD code would indicate, or perhaps the stars could be hotter than corresponds to their mass because of the common envelope.
Our results show that GU Mon is in an advanced stage of interaction. Even so, its parameters are not very unusual. In Table 5, we list known binaries whose components are OB stars on the main sequence with a period shorter than a day, as in GU Mon. For three of them, accurate parameters have not been derived. The components of BH Cen have spectral types that are later than those of GU Mon, and their masses are not known with accuracy. BH Cen belongs to the young open cluster IC 2944, where, as in Dolidze 25, star formation is in process (Qian et al. 2006). Two systems, EM Cep and V701 Sco, are very similar to GU Mon, and have comparable masses. However, we must caution that Hilditch et al. (1982) argued that EM Cep is not an eclipsing binary at all, but instead these authors found that this system is a β Cep pulsator, and that the pulsations caused the photometric variability. This hypothesis has not been refuted to date4. V701 Sco, on the other hand, seems an excellent analogue to GU Mon. This system is a member of the very young open cluster NGC 6383 (Sahade & Berón Dàvila 1963; Lloyd Evans 1978). Again, star formation is still active in this cluster, centred on the 3.4 d binary HD 159 176 (O7 V((f))+O7 V((f)); Linder et al. 2007). Similar to Do 25, NGC 6383 has an estimated age slightly below 3 Ma, and contains many pre-main-sequence stars (Rauw et al. 2010). Bell & Malcolm (1987) studied the evolutionary state of V701 Sco. These authors reached the conclusion that the system had already formed close to contact, with a mass ratio close to unity. Qian et al. (2006) go as far as suggesting that V701 Sco already formed in an overcontact configuration. By analogy, GU Mon, which has a similar age and orbital period, should also have formed in a overcontact configuration.
The presence of all these systems in young open clusters suggests that similar systems, with twin components in a contact configuration, are very common. Recent spectroscopic surveys (e.g. Sota et al. 2014) show that most of the stars that are classified as “n” or “nn” (i.e. with broad lines) in photographic spectra are, in reality, close binaries with high rotational velocities. However, moderately high spectral resolution is needed to see the two components, and, hence, many more similar binaries may be hidden in young open clusters.
The evolution of such systems is not clear. Given the very short orbital periods and mass ratios close to unity, slow case A mass transfer is likely to dominate their evolution (Pols 1994; de Mink et al. 2007). According to Wellstein et al. (2001), if the two systems fill their Roche lobes while the primary is still burning hydrogen in its core, a merger is the most likely outcome, as the short orbital period is believed to preclude common envelope ejection. Given the age of Do 25 (≲3 Ma), the components of GU Mon are still very close to the ZAMS, and they have already filled their respective lobes. As a matter of fact, unless the original orbital period was considerably longer, evolutionary models indicate that they were already in contact at age zero (Wellstein et al. 2001). The exact initial period for which a merger is unavoidable is not known because of the extreme difficulty in reproducing the physics of the common envelope phase. Some semi-detached systems with short periods are believed to be post-contact binaries, whose orbital periods increase after a minimum is reached during fast case A mass transfer. Examples of this are TU Mus (Porb = 1.4 d, O7 V+O8 V; Penny et al. 2008), or IU Aur5 (Porb = 1.8 d, O9.5 V+B0.5 V; Özdemir et al. 2003). In these cases, the contact phase should be short lived (Qian et al. 2013, and references therein). In contrast, the detection of several systems with early B components in a contact configuration with orbital periods <1 d suggests that they are in a long-lived phase that leads to a merger. The only way in which a merger could be avoided is if rotational mixing leads to homogeneous evolution, thereby forcing the two stars to become hotter and more compact. However, the observed rotational velocity for the components of GU Mon, about 270 km s-1, seems far too small to lead to homogeneous evolution. In this respect, it is similar to the much more massive system MY Cam (Lorenzo et al. 2014). In addition, the lack of nitrogen enhancement does not support rotationally induced chemical mixing, although this could be hidden if the common envelope is effectively detached from the cores. In general, however, the current evidence strongly supports a future evolution leading to merger and the formation of a blue straggler in Do 25.
6. Conclusions
Our analysis has shown that GU Mon is an overcontact eclipsing binary with almost identical components. The two stars present parameters typical of main-sequence stars of spectral type B1 V. Given the age of the cluster Do 25, of which they are members, they cannot be very far away from the ZAMS. The derivation of accurate stellar parameters is hindered by the shallowness of all lines, which caused by the high rotational velocity of the stars. The present-day rotational velocity of the stars, however, is far too low for homogeneous evolution. According to evolutionary models (Wellstein et al. 2001), the system should be transferring material slowly and evolves towards a merger. The result of this merger is probably a main-sequence star with a mass close to the total mass of the system, which would then be a blue straggler in Do 25. Our modelling shows that, at this stage, the binary already possesses a single atmosphere wrapping both cores. The transfer of material from the inner layers to the common envelope in this type of overcontact binary has not been studied, and so we cannot obtain information from the stellar interior (for example, we do not know if we should expect evidence of chemical mixing). From the outside, the stellar atmosphere resembles that of a single star but with a very specific morphology, i.e. a “peanut shape”. GU Mon is not unique, as there seem to be several similar systems, that have periods shorter than one day. For all these objects, reversal of the orbital evolution seems unlikely, as no examples of high-mass systems with increasing periods and orbital periods shorter than ~1.5 d are known. Therefore GU Mon seems to represent a point in evolution between the initial contact and the definitive merger of both components.
Given the quality of the spectra, we were only able to roughly constrain the projected rotational velocity between 250 and 300 km s-1 for each component. The rotational velocities derived from model fitting are susceptible to two possible causes of inaccuracy. On the one hand, the low signal-to-noise of some of the spectral lines can result in inaccurate profile fits. Secondly, the Struve-Sahade effect (Struve 1937; Sahade 1959), i.e. the strengthening of the profile corresponding to the component of a spectroscopic binary that is approaching the observer, can contribute to larger uncertainties. This strengthening could perhaps induce differences in the derivation of the projected rotational velocities of each star. In the end, we decided to fix v sin i in both stars to 270 km s-1, because we checked by eye that this value seemed to reproduce most of the spectra better (and not only the spectrum used for the fit). The convenience of this choice is supported by the results of the combined analysis of the radial velocity and photometric light curve, which gives a perfectly compatible value (see Table 3).

However, we have to note that in both TU Mus and IU Aur, there is a fair chance that the binary evolution is driven by a third body in the system (Qian et al. 2006).
Acknowledgments
Partially based on observations made with the Nordic Optical Telescope, operated by the Nordic Optical Telescope Scientific Association, and the WHT, operated on the island of La Palma by the Isaac Newton Group, both in the Spanish Observatorio del Roque de Los Muchachos of the Instituto de Astrofísica de Canarias. The WHT observations were taken as part of the service programmes, and we would like to thank the staff astronomers for their diligence.
This research is partially supported by the Spanish Ministerio de Economía y Competitividad under grants AYA2012-39364-C02-01/02 and AYA2015-68012-C2-1/2, and the European Union. This research has made use of the Simbad service developed at the Centre de Données Astronomiques de Strasbourg, France.
References
- Almeida, L. A., Sana, H., de Mink, S. E., et al. 2015, ApJ, 812, 102 [NASA ADS] [CrossRef] [Google Scholar]
- Andersen, J., Clausen, J. V., & Nordstrom, B. 1980, in Close Binary Stars: Observations and Interpretation, Proc. IAU Symp., 88, 81 [NASA ADS] [Google Scholar]
- Auvergne, M., Bodin, P., Boisnard, L., et al. 2009, A&A, 506, 411 [NASA ADS] [CrossRef] [EDP Sciences] [Google Scholar]
- Babu, G. S. D. 1983, J. Astrophys. Astron., 4, 235 [NASA ADS] [CrossRef] [Google Scholar]
- Banerjee, S., Kroupa, P., & Oh, S. 2012, MNRAS, 426, 1416 [NASA ADS] [CrossRef] [Google Scholar]
- Beccari, G., Dalessandro, E., Lanzoni, B., et al. 2013, ApJ, 776, 60 [NASA ADS] [CrossRef] [Google Scholar]
- Bell, S. A., & Malcolm, G. J. 1987, MNRAS, 226, 899 [NASA ADS] [CrossRef] [Google Scholar]
- Bonnell, I. A., & Bate, M. R. 2005, MNRAS, 362, 915 [NASA ADS] [CrossRef] [Google Scholar]
- Clarke, C. 2006, J. Phys. Conf. Ser., 54, 190 [NASA ADS] [CrossRef] [Google Scholar]
- Clausen, J. V., Helt, B. E., Giménez, A., et al. 2007, A&A, 461, 1065 [NASA ADS] [CrossRef] [EDP Sciences] [Google Scholar]
- de Mink, S. E., Pols, O. R., & Hilditch, R. W. 2007, A&A, 467, 1181 [NASA ADS] [CrossRef] [EDP Sciences] [Google Scholar]
- de Mink, S. E., Sana, H., Langer, N., Izzard, R. G., & Schneider, F. R. N. 2014, ApJ, 782, 7 [NASA ADS] [CrossRef] [Google Scholar]
- Eggleton, P. P. 1983, ApJ, 268, 368 [NASA ADS] [CrossRef] [Google Scholar]
- Ekström, S., Georgy, C., Eggenberger, P., et al. 2012, A&A, 537, A146 [NASA ADS] [CrossRef] [EDP Sciences] [Google Scholar]
- Georgy, C., Ekström, S., Eggenberger, P., et al. 2013, A&A, 558, A103 [NASA ADS] [CrossRef] [EDP Sciences] [Google Scholar]
- Hensberge, H., Pavlovski, K., & Verschueren, W. 2000, A&A, 358, 553 [NASA ADS] [Google Scholar]
- Hilditch, R. W., McLean, B. J., & Reid, I. N. 1982, MNRAS, 200, 1153 [NASA ADS] [CrossRef] [Google Scholar]
- Hohle, M. M., Neuhäuser, R., & Schutz, B. F. 2010, Astron. Nachr., 331, 349 [NASA ADS] [CrossRef] [Google Scholar]
- Hu, Y., Liu, Q., Deng, L., & de Grijs, R. 2007, IAU Symp., 241, 347 [NASA ADS] [Google Scholar]
- Hubscher, J., Paschke, A., & Walter, F. 2005, IBVS, 5657, 1 [Google Scholar]
- Kallrath, J., & Milone, E. F. 2009, Eclipsing Binary Stars: Modeling and Analysis, Astronomy and Astrophysics Library (New York: Springer-Verlag) [Google Scholar]
- Kreiner, J. M. 2004, Acta Astron., 54, 207 [NASA ADS] [Google Scholar]
- Kurucz, R. L. 1993, VizieR Online Data Catalog: VI/039 [Google Scholar]
- Langer, N. 2012, ARA&A, 50, 107 [NASA ADS] [CrossRef] [Google Scholar]
- Langer, N., & Kudritzki, R. P. 2014, A&A, 564, A52 [NASA ADS] [CrossRef] [EDP Sciences] [Google Scholar]
- Lennon, D. J., Dufton, P. L., Fitzsimmons, A., Gehren, T., & Nissen, P. E. 1990, A&A, 240, 349 [NASA ADS] [Google Scholar]
- Leonard, P. J. T., & Linnell, A. P. 1992, AJ, 103, 1928 [NASA ADS] [CrossRef] [Google Scholar]
- Leung, K.-C., Zhai, D.-S., Sistero, R. F., Grieco, A., & Candellero, B. 1984, AJ, 89, 872 [NASA ADS] [CrossRef] [Google Scholar]
- Linder, N., Rauw, G., Sana, H., De Becker, M., & Gosset, E. 2007, A&A, 474, 193 [NASA ADS] [CrossRef] [EDP Sciences] [Google Scholar]
- Lorenzo, J., Negueruela, I., Baker, A. K. F. V., et al. 2014, A&A, 572, A110 [NASA ADS] [CrossRef] [EDP Sciences] [Google Scholar]
- Lloyd Evans, T. 1978, MNRAS, 184, 661 [NASA ADS] [CrossRef] [Google Scholar]
- Maciel, S. C., Osorio, Y. F. M., & De Medeiros, J. R. 2011, New Astron., 16, 68 [NASA ADS] [CrossRef] [Google Scholar]
- Marco, A., Negueruela, I., & Motch, C. 2007, ASP Conf. Ser., 361, 388 [NASA ADS] [Google Scholar]
- Moffat, A. F. J., & Vogt, N. 1975, A&AS, 20, 85 [NASA ADS] [Google Scholar]
- Negueruela, I., & Marco, A. 2008, A&A, 492, 441 [NASA ADS] [CrossRef] [EDP Sciences] [Google Scholar]
- Negueruela, I., Simón-Díaz, S., Lorenzo, J., Castro, N., & Herrero, A. 2015, A&A, 584, A77 [NASA ADS] [CrossRef] [EDP Sciences] [Google Scholar]
- Özdemir, S., Mayer, P., Drechsel, H., Demircan, O., & Ak, H. 2003, A&A, 403, 675 [NASA ADS] [CrossRef] [EDP Sciences] [Google Scholar]
- Penny, L. R., Ouzts, C., & Gies, D. R. 2008, ApJ, 681, 554 [NASA ADS] [CrossRef] [Google Scholar]
- Pols, O. R. 1994, A&A, 290, 119 [NASA ADS] [Google Scholar]
- Polushina, T. S. 2004, Astron. Astrophys. Trans., 23, 213 [NASA ADS] [CrossRef] [Google Scholar]
- Puls, J., Kudritzki, R.-P., Herrero, A., et al. 1996, A&A, 305, 171 [NASA ADS] [Google Scholar]
- Puls, J., Urbaneja, M. A., Venero, R., et al. 2005, A&A, 435, 669 [NASA ADS] [CrossRef] [EDP Sciences] [Google Scholar]
- Qian, S.-B., Liu, L., & Kreiner, J. M. 2006, New Astron., 12, 117 [NASA ADS] [CrossRef] [Google Scholar]
- Qian, S.-B., Zhang, J., Wang, J.-J., et al. 2013, ApJ, 207, 22 [NASA ADS] [CrossRef] [Google Scholar]
- Rauw, G., Manfroid, J., & De Becker, M. 2010, A&A, 511, A25 [NASA ADS] [CrossRef] [EDP Sciences] [Google Scholar]
- Sahade, J. 1959, PASP, 71, 151 [NASA ADS] [CrossRef] [Google Scholar]
- Sahade, J., & Berón Dàvila, F. 1963, Annales d’Astrophysique, 26, 153 [NASA ADS] [Google Scholar]
- Sana, H., de Mink, S. E., de Koter, A., et al. 2012, Science, 337, 444 [Google Scholar]
- Santolaya-Rey, A. E., Puls, J., & Herrero, A. 1997, A&A, 323, 488 [NASA ADS] [Google Scholar]
- Sharpless, S. 1959, ApJS, 4, 257 [Google Scholar]
- Simón-Díaz, S. 2010, A&A, 510, A22 [NASA ADS] [CrossRef] [EDP Sciences] [Google Scholar]
- Simón-Díaz, S., & Herrero, A. 2014, A&A, 562, A135 [NASA ADS] [CrossRef] [EDP Sciences] [Google Scholar]
- Simón-Díaz, S., Castro, N., Herrero, A., et al. 2011, J. Phys. Conf. Ser., 328, 012021 [NASA ADS] [CrossRef] [Google Scholar]
- Simón-Díaz, S., Caballero, J. A., Lorenzo, J., et al. 2015, ApJ, 799, 169 [NASA ADS] [CrossRef] [Google Scholar]
- Southworth, J., & Clausen, J. V. 2007, A&A, 461, 1077 [NASA ADS] [CrossRef] [EDP Sciences] [Google Scholar]
- Southworth, J., Maxted, P. F. L., & Smalley, B. 2004, MNRAS, 351, 1277 [NASA ADS] [CrossRef] [Google Scholar]
- Sota, A., Maíz Apellániz, J., Morrell, N. I., et al. 2014, ApJS, 211, 10 [NASA ADS] [CrossRef] [Google Scholar]
- Stickland, D. J., Lloyd, C., Pachoulakis, I., & Koch, R. H. 1998, The Observatory, 118, 356 [NASA ADS] [Google Scholar]
- Struve, O. 1937, ApJ, 85, 41 [NASA ADS] [CrossRef] [Google Scholar]
- Telting, J. H., Avila, G., Buchhave, L., et al. 2014, Astron. Nachr., 335, 41 [NASA ADS] [CrossRef] [Google Scholar]
- Torres, G., Andersen, J., & Giménez, A. 2010, A&ARv, 18, 67 [Google Scholar]
- van Hamme, W. 1993, AJ, 106, 2096 [NASA ADS] [CrossRef] [Google Scholar]
- Vilardell, F., Ribas, I., Jordi, C., Fitzpatrick, E. L., & Guinan, E. F. 2010, A&A, 509, A70 [NASA ADS] [CrossRef] [EDP Sciences] [Google Scholar]
- von Zeipel, H. 1924, MNRAS, 84, 665 [NASA ADS] [CrossRef] [Google Scholar]
- Walborn, N. R. & Fitzpatrick, E. L. 1990, PASP, 102, 379 [NASA ADS] [CrossRef] [Google Scholar]
- Wellstein, S., & Langer, N. 2001, A&A, 350, 148 [Google Scholar]
- Wellstein, S., Langer, N., & Braun, H. 2001, A&A, 369, 939 [NASA ADS] [CrossRef] [EDP Sciences] [Google Scholar]
- Wilson, R. E. 1990, ApJ, 356, 613 [NASA ADS] [CrossRef] [Google Scholar]
- Wilson, R. E., & Biermann, P. 1976, A&A, 48, 349 [NASA ADS] [Google Scholar]
- Wilson, R. E., & Devinney, E. J. 1971, ApJ, 166, 605 [NASA ADS] [CrossRef] [Google Scholar]
- Zahn, J.-P. 1977, A&A, 57, 383 [NASA ADS] [Google Scholar]
- Zejda, M. 2002, IBVS, 5287, 1 [NASA ADS] [Google Scholar]
- Zinn, R., & Searle, L. 1976, ApJ, 209, 734 [NASA ADS] [CrossRef] [Google Scholar]
- Zucker, S., & Mazeh, T. 1994, ApJ, 420, 806 [NASA ADS] [CrossRef] [EDP Sciences] [MathSciNet] [Google Scholar]
All Tables
Radial velocities and residuals for both components of GU Mon, sorted by orbital phase.
Stellar parameters derived from the combined analysis of the radial velocity and photometric light curve.
Close binaries with early-type stars on the main sequence and orbital period shorter than one day (extracted from Polushina 2004).
All Figures
|
Fig. 1 Photometric light curve for the V filter, showing the amplitude of the modulation. |
| In the text | |
|
Fig. 2 Photometric light curve for the B filter, showing a very similar amplitude of the modulation. |
| In the text | |
|
Fig. 3 Classification spectrum of GU Mon. Labels identify the most characteristic spectral lines. The region shown in blue (between 4000 and 5000 Å) represents the spectral range selected for the cross-correlation. D.I.B indicates the main diffuse interstellar bands. |
| In the text | |
|
Fig. 4 Some representative H, He i and He ii lines in the spectrum of GU Mon (♯6 in Table 1) in used to derive the rotational velocities and stellar parameters of both components. The red solid line is the combined best fitting FASTWIND synthetic spectrum. |
| In the text | |
|
Fig. 5 Light curve model fitted to the observational data in V filter (green) and B filter (blue). Residuals are shown in the top panel. |
| In the text | |
|
Fig. 6 Radial velocity curves fitted to the observational data and shown against orbital phase (black line: star 1; red line: star 2). The dashed line corresponds to the systemic velocity. The residuals are shown in the top panel. |
| In the text | |
|
Fig. 7 Representative drawing of GU Mon to scale at quadrature phase, created with the PHOEBE 2.0-alpha code via the Python interface. |
| In the text | |
|
Fig. 8 Location of the two “twin” components of GU Mon in the spectroscopic HR diagram, including the uncertainties in Teff and log L. Three sets of tracks from the Geneva group are overplotted to illustrate the effects of metallicity and rotation. Only the ZAMS for the non-rotating models at solar metallicity is shown. |
| In the text | |
Current usage metrics show cumulative count of Article Views (full-text article views including HTML views, PDF and ePub downloads, according to the available data) and Abstracts Views on Vision4Press platform.
Data correspond to usage on the plateform after 2015. The current usage metrics is available 48-96 hours after online publication and is updated daily on week days.
Initial download of the metrics may take a while.