| Issue |
A&A
Volume 691, November 2024
|
|
|---|---|---|
| Article Number | A150 | |
| Number of page(s) | 11 | |
| Section | Stellar structure and evolution | |
| DOI | https://doi.org/10.1051/0004-6361/202450849 | |
| Published online | 08 November 2024 | |
Constraining the overcontact phase in massive binary evolution
III. Period stability of known B+B and O+B overcontact systems
1
European Southern Observatory, Alonso de Cordova 3107, Vitacura, Casilla, 19001 Santiago de Chile, Chile
2
Institute of Astronomy, KU Leuven, Celestijnenlaan 200 D, 3001 Leuven, Belgium
3
Instituto de Astrofísica de Canarias, C. Vía Líctea, s/n, 38205 La Laguna, Santa Cruz de Tenerife, Spain
4
Universidad de La Laguna, Departamento de Astrofísica, Av. Astrofísico Francisco Sínchez s/n, 38206 La Laguna, Tenerife, Spain
5
Royal Observatory of Belgium, Avenue Circulaire/ Ringlaan 3, 1180 Brussels, Belgium
⋆ Corresponding author; This email address is being protected from spambots. You need JavaScript enabled to view it.
Received:
23
May
2024
Accepted:
30
September
2024
Abstract
Context. Binary systems play a crucial role in massive star evolution. Systems composed of B-type and O-type stars are of particular interest due to their potential to lead to very energetic phenomena or the merging of exotic compact objects.
Aims. We aim to determine the orbital period variations of a sample of B+B and O+B massive overcontact binaries, with the primary objectives of characterizing the evolutionary timescales of these systems and addressing the existing discrepancy between observational data and theoretical predictions derived from population synthesis models.
Methods. We used PERIOD04 to analyze archival photometric data going back a century for a sample of seven binary systems to measure their orbital periods. We then determine the period variations using a linear fit.
Results. We find that the period variation timescales of five truly overcontact binary systems align with the nuclear timescale, in agreement with previous findings for more massive overcontact binaries. Additionally, we noticed a clear distinction between the five systems that had been unambiguously classified as overcontact systems and both SV Cen and VFTS 066, which seem to be evolving on thermal timescales and might be misclassified as overcontact systems.
Conclusions. In the case of the five overcontact binaries, our results indicate a noticeable mismatch between the observational data and the theoretical predictions derived from population synthesis models. Furthermore, our results suggest that additional physical mechanisms must be investigated to compare the observed variations more thoroughly with theoretical predictions.
Key words: techniques: photometric / binaries: close / stars: evolution / stars: massive
© The Authors 2024
 Open Access article, published by EDP Sciences, under the terms of the Creative Commons Attribution License (https://creativecommons.org/licenses/by/4.0), which permits unrestricted use, distribution, and reproduction in any medium, provided the original work is properly cited.
This article is published in open access under the Subscribe to Open model. This email address is being protected from spambots. You need JavaScript enabled to view it. to support open access publication.
1. Introduction
Massive stars have a strong impact on their environment due to their high luminosity and their intense radiative feedback, which drives both the chemical and mechanical evolution of their host galaxies. In addition, their high luminosity allows for the discovery of additional information about distant objects, contributing to an enhanced understanding of galactic and extragalactic astronomy (e.g., Herrero 2008; Grudić & Hopkins 2019). These feedback mechanisms primarily manifest themselves in the form of protostellar outflows, strong stellar winds, ionizing radiation, and supernova explosions (McLeod et al. 2019).
After they explode as supernovae, massive stars can end their lives as neutron stars or black holes (Woosley et al. 2002; Heger et al. 2003, 2023; Maeda 2022), but the different evolutionary paths that lead them to this stage contain many uncertainties.
Binarity is a common phenomenon at all stellar masses and must be properly accounted for when considering the future evolution of a given system (e.g., Paczyński 1971; Marchant & Bodensteiner 2024). This is even more important in the case of massive stars, since more than 70% of them will interact with a companion before leaving the main sequence (Sana et al. 2012; Moe & Di Stefano 2017). Massive stars are interesting due to their sensitivity to factors such as metallicity, rotation, and possibly magnetic fields (Langer 2012). Maeder & Meynet (2012) provided a detailed discussion on the evolution of rotating stars, including the rotational mixing in O- and B-type stars. Many aspects of binarity have been intensively studied from both a theoretical and observational perspective, including the effects of tides (Hut 1981; Zahn 1989; Hurley et al. 2002), the outward transfer of angular momentum to form disks (Lee et al. 1991), mass and energy outflow (Shu et al. 1979), and mass transfer driven by stellar winds (Mohamed & Podsiadlowski 2007), but many uncertainties and unknowns remain. More recently, the Modules for Experiments in Stellar Astrophysics (MESA) code (Paxton et al. 2011, 2013) was extended to include binaries (Paxton et al. 2015) in order to experiment with these binary interaction mechanisms and improve our theoretical knowledge about binarity.
One particularly important phase in the evolution of massive binary systems is the overcontact phase, when both components of a binary system are overfilling their Roche lobes. This phase is often also called the contact phase. This evolutionary phase is characterized by many simultaneous complex physical processes, including mass and energy exchange, mutual irradiation, tidal and Roche deformations, intense stellar winds, and a high degree of internal mixing. Our understanding of this phase is further complicated by a lack of observational constraints for many of these physical processes. Only about 20 massive (Minit > 8 M⊙) overcontact binaries are currently known despite the fact that 25% of all massive binaries are expected to go through such a phase at some point in their evolution (Pols 1994; Wellstein et al. 2001; Abdul-Masih et al. 2021; Henneco et al. 2024). This is partly due to the fact that distinguishing overcontact systems from semidetached and detached systems is not trivial (Mahy et al. 2020a). It has often been attempted by analyzing only their light curves (Wilson 1979). In certain cases, if we find that the system is eccentric or if the rotation rates of the components are highly asynchronous, we can discard the possibility that the system is in an overcontact system. However, the only way to undoubtedly discern between the different morphologies is combining the analysis of their light curves with spectroscopic data (Abdul-Masih et al. 2020).
One method that can help us better understand the physical processes that govern this specific stage of binary evolution is to study how the orbital periods of massive binaries evolve during the overcontact phase. Analyses of the rate at which a period changes have proven useful in understanding eclipsing pulsar binaries (Applegate & Shaham 1994), post-common-envelope binaries (Parsons et al. 2010), and O+O massive overcontact binaries (Abdul-Masih et al. 2022) revealed a discrepancy between our theoretical understanding of how one thinks these systems should evolve and what the observations actually show. Specifically, the observed mass ratios between the secondary and the primary components do not asymptotically approach q = 1 as population synthesis simulations predict, but are instead evenly distributed between q = 0.6 and q = 1 (Menon et al. 2021). Furthermore, from the O+O massive binaries sample, Abdul-Masih et al. (2022) conclude that exploring this possible discrepancy requires an increase in the sample size of studied systems.
While B-type stars are more numerous than O-type stars, so far O-type overcontact systems have been studied more extensively because their high luminosities make them more easily observable than their B-type counterparts. Despite this, B-type overcontact systems can provide many useful insights and can act as a complementary sample to the O-type systems studied by Abdul-Masih et al. (2022). In expanding our focus to include both B+B and O+B overcontact systems, we aim to provide more observational constraints for future theoretical efforts and to investigate any similarities or differences between the two sets of samples. This investigation thus allows us to expand the sample of studied massive overcontact binaries, which is needed to confirm the reported discrepancy.
In Sect. 2 we discuss our sample selection and the corresponding available archival photometric data. In Sect. 3 we discuss how we determine the orbital period from the photometric data and which fitting model we used to determine the change in period. In Sect. 4 we present our results, and in Sect. 5 we discuss what we can learn from them. Lastly, in Sect. 6 we summarize our research and consider possible further studies.
2. Sample and archival data
To gather a representative sample of systems, we searched in the literature (see Table 1) for reported O+B and B+B overcontact binary systems that met the following conditions. First, the system needs to be classified as an overcontact binary based on combined photometric and radial velocity fits. OGLE SMC-ECL-2063 was considered an overcontact binary by Wu et al. (2023), but up to now there was no spectroscopic data available to determine the radial velocities. Therefore, this system was not included in our sample. Secondly, the spectral type of at least one of the components must be B and the mass of the primary must be at least 8 M⊙ to be qualified for our sample. It was also important that the photometric signal was dominated by the orbital period of the binary system and that there were no significant influences from other periodic signals or the presence of a nearby third object. With these restrictions in mind, our sample consists of seven overcontact binary systems.
Coordinates (J2000) and orbital periods in units of days and seconds for our sample of B+B and O+B overcontact binaries and their mass ratios q = M2/M1.
Most of the systems we encountered are actually reported to be in a higher order multiple star system. CT Tau, GU Mon, V606 Cen, and V701 Sco were thought to have a third companion (Yang et al. 2019; Wu et al. 2023) and V745 Cas is a higher order multiple system with a binary in overcontact configuration orbiting the other components in a long period orbit (Çakırlı et al. 2014). The orbital periods of the outer companions were long enough (i.e., > 30 years) that their impact on the orbital parameters of the overcontact binaries can be neglected on timescales probed in the current study. A summary of our sample and the most recently derived orbital periods can be found in Table 1. A brief summary of each object in our sample can be found below and an overview of the time span of the photometric data is shown in Fig. 1.
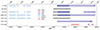 |
Fig. 1. Time span overview of the archival photometric data used for each target. The different instrument observations are color-coded. |
2.1. CT Tau
The first observations of the binary system CT Tau were done by Istchenko & Chugainov (1965). Later on Plewa & Wlodarczyk (1993) analyzed all the available photometric data up to then to obtain absolute parameters of the system. They also concluded that the orbital period did not change in 30 years and therefore CT Tau should be in an equilibrium state of evolution without any trace of dynamical instability or mass transfer. These results were reviewed by Yang et al. (2019) by including their own multicolor photometric observations. The data that we used to analyze the system consisted of photometry from the All Sky Automated Survey (ASAS) Catalog of Variable Stars (Pojmanski 1997), Digital Access to a Sky Century at Harvard (DASCH; Grindlay 2017), Optical Monitoring Camera (OMC) Archive (Alfonso-Garzón et al. 2012) and Transiting Exoplanet Survey Satellite (TESS; Ricker et al. 2015). The TESS observations were acquired in the fourth year in sectors 43, 44 and 45.
2.2. GU Mon
The parameters of GU Mon were determined with an analysis of the B and V light curves and high-resolution spectra by Lorenzo et al. (2016). The orbital period was also verified by comparing it with the known radial velocities of other members in the Dolidze 25 cluster (Lorenzo et al. 2016). As for CT Tau, Yang et al. (2019) included new multicolor photometric observations to study GU Mon more in detail. They measured an orbital period change that was up to then still negligible for GU Mon. To assemble a light curve spread over a wide range of time, the photometric data from the ASAS Catalog of Variable Stars (Pojmanski 1997), Convection, Rotation and planetary Transits (CoRoT; Deleuil et al. 2009), and TESS (Ricker et al. 2015) were combined. The available TESS data originated from sector 6 and 33.
2.3. SV Cen
Already in 1972 the eclipsing binary SV Cen was observed and classified as a double-lined spectroscopic binary (Irwin & Landolt 1972). In 1982 Nakamura & Nakamura (1982) determined the observed rate of mass transfer based on previous observations. The period-time diagram was extended laboriously by Drechsel et al. (1982), Herczeg & Drechsel (1985), Rucinski et al. (1992), Drechsel & Lorenz (1993) and Drechsel (1994a); in Drechsel (1994a), SV Cen was described as the eclipsing pair with the largest known rate of period decrease. However, the literature was ambiguous about the configuration of the system. Some claimed that it is an overcontact system (Drechsel 1994b) and others claimed that it is semidetached (De Greve & Linnell 1994; Deschamps et al. 2013; Davis et al. 2014). The combined light curve that we used consists of photometry from the ASAS Catalog of Variable Stars (Pojmanski 1997), DASCH (Grindlay 2017), the OMC Archive (Alfonso-Garzón et al. 2012), and TESS (Ricker et al. 2015). The available TESS data originated from sectors 10, 11, 37, 38, and 64.
2.4. V606 Cen
V606 Cen was photometrically analyzed for the first time by Franco (1994). Five years later, the early-type eclipsing binary V606 Cen was simultaneously analyzed with spectroscopic and photometric data (Lorenz et al. 1999). Thereafter, the system was not studied by other authors until Li et al. (2022). They determined the period decreasing rate and found that V606 Cen has a very low fill-out factor of about 2%. The photometric data available spanned over a period from 1889 until 2022. This was composed of data from the ASAS Catalog of Variable Stars (Pojmanski 1997), DASCH (Grindlay 2017), the OMC Archive (Alfonso-Garzón et al. 2012), and TESS (Ricker et al. 2015). The available TESS data were observed in sectors 11, 38, and 65.
2.5. V701 Sco
The system V701 Sco was mentioned in multiple studies and was characterized as a variable star by Plaut (1948). By measuring the color, Eggen (1961) was able to locate the system in the galactic cluster NGC 6383. Leung (1974) observed the binary with B- and V-filters to gain a complete coverage of the light curve. Later on, the radial velocity and the absolute parameters were determined (Andersen et al. 1980; Bell & Malcolm 1987). V701 Sco was studied in more detail as an early-type overcontact twin binary by Yang et al. (2019). Our analyzed photometric data consisted of the ASAS Catalog of Variable Stars (Pojmanski 1997), DASCH (Grindlay 2017) and TESS (Ricker et al. 2015). For this particular system, sectors 12 and 39 from TESS were used.
2.6. V745 Cas
V745 Cas was observed for the first time with Hipparcos (Perryman et al. 1997; van Leeuwen 2009). Afterward, the Hipparcos and International Gamma-Ray Astrophysics Laboratory (INTEGRAL) light curves were analyzed and using optical spectroscopic observations the radial velocities were determined by Çakırlı et al. (2014). Bobylev & Bajkova (2015) used the known properties of V745 Cas to determine the galactic rotation curve. For this project we used the photometric data from the OMC Archive (Alfonso-Garzón et al. 2012) and TESS (Ricker et al. 2015), in particular sectors 17, 18, 24, and 58.
2.7. VFTS 066
Within our sample, VFTS 066 uniquely represents the category of O+B overcontact systems that satisfies our selection criteria. Initially identified through observations conducted as part of the Very Large Telescope Fibre Large Array Multi Element Spectrograph (VLT-FLAMES) Tarantula Survey, this binary system was confirmed as an overcontact binary in the work of Mahy et al. (2020a). Subsequently, an atmospheric analysis of the system was carried out in a follow-up study (Mahy et al. 2020b). Available data of the VFTS 066 binary system came from the Optical Gravitational Lensing Experiment (OGLE) database and TESS sectors in years 1, 3, and 5. However, the TESS data from the fifth year proved too noisy to extract meaningful signals, rendering it unusable for our purposes. Additionally, Sector 31 of TESS Year 3 data was excluded for similar reasons. Consequently, we used data exclusively from the OGLE database and the first and third year of TESS observations, with the exclusion of Sector 31.
2.8. Data reduction
The photometric data listed above for each target was used to determine the orbital period of the binary system. To obtain consistent results, outliers and points with bad quality flags were removed. When we retrieved data from ASAS (Pojmanski 1997, 2003), we selected only data points with grade A or grade B. From the OGLE database (Szymanski 2006), we used the I band and removed obvious outliers. The data from the OMC Archive (Alfonso-Garzón et al. 2012) had different labels. Only data points with the label “Good” were included; data points with labels “Centroid too far from source coord.”, “Brightest pixel forced”, “Bad Centroid”, “Bad PSF”, “Bad Pixels”, “Bad Background”, and “Mosaic” were excluded. Additionally, we also removed obvious outliers from the datasets with a “Good” flag. From the DASCH catalog (Grindlay 2017), only obvious outliers were removed. Concerning TESS (Ricker et al. 2015), only one of our targets had a light curve reduced with SCIENCE PROCESSING OPERATIONS CENTER (SPOC) (Jenkins et al. 2021), the official TESS pipeline. For all the other targets and sectors, we used the python package LIGHTKURVE (Barentsen & Lightkurve Collaboration 2020). We started from a 9 × 9 frame of pixels around the observed object. To minimize the chance of contamination, we took only 1 pixel as the target mask for each individual target. We always took the pixel with the highest brightness around the center pixel. After this selection, we were able to extract the light curve using the package. Thereafter, we removed the outliers and the Not a Number (NaN) points and flattened the light curve with the built-in flatten() function. With the TESS data we also paid attention to the deviations caused by the downlink in the beginning, middle, and end of the TESS sectors. These deviating points were subsequently removed from the dataset.
3. Methods
3.1. Period determination
The datasets from DASCH spanned a time period up to around 100 years and INTEGRAL OMC covered up to two decades. When the datasets were so long, we split them into multiple smaller sets in order to obtain several period measurements over such long times. The OMC data were always separated into two sets with an equal amount of data points, and the DASCH light curves were split into three or more subsets, with a maximum of ten subsets for CT Tau. This choice was made depending on the size of the error bar that we obtained for the period. TESS data were organized by grouping sectors according to their respective observation years.
Once we had all the required photometry from our sample, the goal was to determine the change in orbital period over the time base of observation. To achieve this goal, we used the publicly available PERIOD04 (Lenz & Breger 2005) software. Another effective tool for detecting signals in unevenly sampled time series is the Lomb-Scargle periodogram (Lomb 1976; Scargle 1982). This method has been used in the study of B-type binaries in the 30 Doradus region (Villaseñor et al. 2021), resulting in orbital period measurements with relative errors ranging from approximately 0.002% for VFTS 730 to 0.04% for VFTS 189. In addition, the Heck-Manfroid-Mersch periodogram (Heck et al. 1985; Gosset et al. 2001) corrects for the mathematical inaccuracies linked to the Lomb-Scargle method. However, overall, all these techniques produce comparable results.
Starting from the time, flux, and error on the flux, we calculated the Fourier transform of each subset to determine the dominant frequencies from the light curve. These dominant frequencies can be determined with high accuracy due to the long observational baseline with respect to the orbital period that we are trying to detect. The long time span of our observations ensures that multiple cycles of the periodic signal are observed. Therefore, the peaks corresponding to the true orbital periods are more prominent and distinct in the Fourier transform. As it was the case in the O+O systems studied by Abdul-Masih et al. (2022), we noticed that, in most cases, the dominant frequency was twice the orbital frequency. This is caused by the symmetric nature of overcontact binary light curves; however, since the orbital periods of our targets have been measured from both photometric and spectroscopic data, we were able to use the literature values to prevent any confusion.
To calculate the error on the orbital frequency and hence on the orbital period, we used the uncertainties incorporated in PERIOD04. More specifically, we used Monte Carlo simulations with 1000 iterations. In each iteration, the orbital period was determined from a dataset where the times of the data points were the same as for the original input, but the flux was predicted by the best fit plus Gaussian noise scaled to the standard deviation of the data (Lenz & Breger 2005). These Monte Carlo simulations were then used to determine the uncertainties on the parameter. If the error was too large (i.e., larger than 0.2% for TESS data and larger than 0.002% for the other databases, based on errors from the literature (e.g., Villaseñor et al. 2021) the measurement of the period change rate would be strongly biased and difficult to constrain, so we improved the dataset by using more data points and enlarging the subsets that we decided before. Obviously, the period that was determined using PERIOD04 is associated with a larger time span of observations. To be able to plot the period in function of the observed time, we decided to assign the calculated orbital period to the mid-time of each observation time span. Once we had all these results, we could start looking at how the period varies in time.
3.2. Period change determination
To remain consistent with Abdul-Masih et al. (2022), we used a linear fit to characterize the time-dependent period evolution. Therefore, the two fitted parameters were the slope and the y intercept, determined with a nonlinear least squares procedure using curve_fit from SciPy (Virtanen et al. 2020). To handle all our targets consistently, we decided to offset the time so that the mid-time of each object corresponded to zero on the horizontal axis. Additionally, we re-centered the orbital period data before performing the fit by subtracting the known orbital period from literature. These steps reduce the multi-collinearity of the problem by decreasing the correlation between the fitted parameters. The slope is equal to the change in orbital period, Ṗ and the error is determined based on the covariance matrix. This re-centering does not affect the uncertainty on our final results.
4. Results
Using all the photometric data mentioned in Sect. 2, we are able to determine the orbital periods of each data subset using PERIOD04. The long time span of DASCH observations significantly increases the number of available data points, improving the accuracy of our orbital period determinations. In previous studies about orbital period change, the stability of the system is expressed using P/|Ṗ|, which makes it easier to compare different systems with each other. We use CT Tau as a case study, the analysis and interpretation of the other systems are similar. The results for CT Tau are listed in Table 2. The results for all the other binary systems and their catalogs are given in Table A.1, while the literature values were given in Table 1 for comparison.
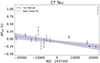 |
Fig. 2. Orbital period change of CT Tau. On the vertical axis, ΔPorb is the difference between the known orbital period (see Table 1) and the orbital periods determined from archival photometric data of CT Tau using PERIOD04. The best linear fit is shown in red, and the error region on this fit is shown in blue. |
Orbital periods obtained for each CT Tau dataset.
By combining all the period measurements from the archival photometric data, we were able to constrain how quickly the period is changing. All the determined periods were used to find the best linear fit, and this gives us the slope, a direct measure of Ṗ. Once we obtain Ṗ and its corresponding error, we calculated the value of P/|Ṗ|. To determine the error on P/|Ṗ|, we used the upper and lower bound values of Ṗ; with this we were able to calculate the desired asymmetrical errors. In this calculation we neglected the error on the period, P, as it is orders of magnitude smaller and thus negligible. The results are shown in Table 3, where we also give the P/|Ṗ| and  . To visualize our results, the different measurements of the orbital periods obtained from each photometric subset are shown for CT Tau in Fig. 2 and similar figures for the other systems are available in Appendix B.
Results from the linear fit for all our systems.
From Table 3 we see that Ṗ is negative for most systems, that almost all have a P/|Ṗ| value between 0.9 and 20 Myr, and that  are in the range between 10−8 − 10−6 [yr−1] in most cases. The clear exceptions are SV Cen and VFTS 066 with the highest Ṗ and
  values and a P/|Ṗ| of around ∼0.05−0.07 Myr only. To understand the timescales, we calculated the nuclear and thermal timescales for the systems in our sample. We found that the nuclear timescale is on the order of a few million years (Myr), while the thermal timescale is on the order of thousands of years (kyr).
From Fig. 2 and the figures in Appendix B, we see that most of the systems tend to have a slope that is either negative or close to zero, which means a decreasing or constant orbital period. As mentioned in Sect. 3, Ṗ is determined using a linear fit through our data points. The values in Table 3 are consistent with previous works (Yang et al. 2019; Abdul-Masih et al. 2022). As shown in Table 3, most of our binary systems except SV Cen and VFTS 066 have a period stability P/|Ṗ| of at least ∼1 Myr up to 20 Myr. These time ranges are associated with nuclear timescales, indicating that these systems are evolving on a nuclear timescale.
For SV Cen and VFTS 066 the decrease in orbital period is noteworthy and suggests that they are both evolving on a thermal timescale, unlike the five overcontact systems that are evolving on a nuclear timescale. Even though SV Cen is classified in several papers as an overcontact binary (Wilson & Starr 1976; Linnell 1992), our analysis clearly suggests that it is evolving on a thermal timescale and thereby might have a semidetached configuration, as already suggested by De Greve & Linnell (1994), Deschamps et al. (2013) and Davis et al. (2014). For this reason, we will exclude SV Cen from our discussion about B+B and O+B overcontact binaries.
Concerning VFTS 066, it is important to mention that the fit was constituted of only three data points with relatively large errors. In the photometric analysis of Mahy et al. (2020a) an inclination of  was found. At such a low inclination, the system is not eclipsing and therefore the light curve is dominated by ellipsoidal variations, which would appear quite similar for overcontact and semidetached configurations. Additionally, the best fit solution (while favoring an overcontact configuration) fell quite close to the border between the two regimes. Given this and the fact that the period stability is significantly lower than the rest of the sample, it is possible that the system was identified as an overcontact system while actually being (semi)detached or close to contact. In addition, with the timescale derived from Ṗ we will exclude VFTS 066 from the discussion about overcontact binaries.
5. Discussion
We compare our observations with the population synthesis simulations of Menon et al. (2021), similar to the analysis done in Abdul-Masih et al. (2022) for O+O overcontact binaries. The binary models in the population synthesis are initialized with total masses ranging from 20 M⊙ to 80 M⊙, initial mass ratios from 0.6 to 1 and initial orbital periods from 0.6 days to 1 day. These initial values represent the parameters of the binary system at the beginning of the zero age main sequence. These models focus only on the main sequence phase of the binary systems. For the population distribution, the study examined the fraction of time these systems spend in specific configurations, defined by combinations of their current total mass, mass ratio and orbital period. Using these results, the population distribution predicts the configurations in which these binary systems are most likely to spend the majority of their lifetimes and be detected in observations.
The probability plots based on the models of Menon et al. (2021) are shown in Fig. 3 with the colors in log scale. In the left-hand panel, we use the models with a current orbital period between 0.5 and 1.0 days, while the right panel shows periods between 1.0 and 1.75 days. It shows the normalized theoretical probability distribution of P/|Ṗ| as a function of mass ratio. Similar to the O+O models as shown in Fig. 4, we notice that for B+B systems with orbital periods of P ≤ 1.75 days, the probability peaks at a mass ratio q = 1. However, for longer orbital periods, the distribution appears to flatten, and q < 1 becomes more likely.
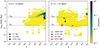 |
Fig. 3. Normalized probability distribution based on the population synthesis models from Menon et al. (2021). Left: Binned models for an orbital period between 0.5 and 1.0 day. Right: Orbital periods between 1.0 and 1.75 days. On the horizontal axis is the mass ratio, q, and on the vertical axis log10(P/|Ṗ|). The colors indicate, in log scale, the probability of having a system with those values of q and |

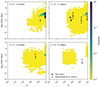 |
Fig. 4. Same as Fig. 3 but binned for an orbital period of between 0.5 days and 2.5 days. For comparison, our final five studied B+B overcontact systems and the previously studied O+O overcontact systems from Abdul-Masih et al. (2022) are shown. |
The studied sample of systems with an orbital period between 0.5 and 1.0 day does indeed have a mass ratio close to 1; however, the values of  are slightly lower than the peak of the models’ distribution. Nonetheless, these B+B overcontact systems are in better agreement with the models of Menon et al. (2021) compared to the O+O overcontact sample. To illustrate this even better, we additionally showed both samples in Fig. 4 for comparison. This trend of mass ratios close to 1 is not visible for the systems with a longer orbital period. In comparison with the models, V606 Cen and V745 Cas are found more in the tail of the probability distribution, with a lower mass ratio q. For systems with an orbital period P ≥ 1.75 days, we find the same discrepancy between our observations and the predictions as concluded in Menon et al. (2021) and Abdul-Masih et al. (2022), which are based on the models from the population synthesis (see Fig. 4 for reference).
We still need to exercise caution regarding this discrepancy, as multiple factors could have influenced our results. Possible factors include differences in metallicity assumptions. Notably, the models of Menon et al. (2021) were conducted at Large Magellanic Cloud metallicity, potentially leading to variations compared to Galactic systems. Apart from metallicity considerations, limitations in the orbital period and mass transfer assumptions, constraints on initial mass ratios, absence of energy transfer considerations (Fabry et al. 2022, 2023), and limitations in the contact scheme in MESA may also contribute to discrepancies. A more elaborate discussion about these aspects can be found in Abdul-Masih et al. (2022). From the population synthesis plots we see that we find four in the yellow and one in the blue regions, this means that the observations are not distributed in the same way as the population synthesis predicts.
The objects in the blue region should outnumber those in the yellow region by a ratio of at least 1000 to 1. While the yellow regions, representing probabilities lower than 10−3, are visible on the graph, differences within the yellow regions are not readily apparent. However, a trend toward higher mass ratios is still present. While there is an acceptable correspondence in the 0.5–1.0 orbital period bin, the identification of two poorly matching objects in the 1.0–1.75 orbital period bin signifies dissimilarity in the distributions.
Our sample containing five B+B overcontact binaries has given us more insight into the possible discrepancy between theoretical models and the observations, considering the timescale of equalization of binaries. To strengthen these results and formulate a definite conclusion, a larger sample of massive overcontact binaries is needed to better investigate their orbital period changes.
6. Conclusion
Given the discrepancy between the theoretical predictions and observations presented in Abdul-Masih et al. (2022), we set out to both provide additional observational constraints and verify this discrepancy by analyzing the period stability of a sample of B+B and O+B overcontact systems. We know B-type stars are more numerous than O-type stars, and yet the amount of known B+B overcontact binary systems is still limited. We included every system that we found in the literature that is characterized as a B+B or O+B binary in the overcontact phase and fit our selection criteria. This gave us a sample of five overcontact systems and two impostors that were investigated using their available photometric data.
Using archival photometric data spanning back as far as a century, we measured the orbital period of each system using PERIOD04 and subsets of the data in order to study the change in this parameter with time. We notice that the choice of data subset had a great influence on the end results of PERIOD04. In most cases, more data points gave a smaller error on the orbital period and made the linear fit to determine the period change much more challenging. Therefore, the selection and division of the datasets are not absolute but rather subject to the researcher’s choices. To minimize these influences, the larger datasets were split into subsets of approximately 10 years. Only when there were obvious gaps or differences did we split the datasets manually.
Subsequently, using a linear fit, we were able to deduce a quantitative value for the period variations (Ṗ) and hence P/|Ṗ| and  . A significant divergence was observed in the data from SV Cen and VFTS 066 compared to our other targets, suggesting they are evolving on a thermal timescale. Even though the overcontact binary literature often lists SV Cen as such, we also found papers suggesting that SV Cen is an Algol system (van Rensbergen et al. 2011); after measuring its period change, we tend to support the latter classification and decided to exclude SV Cen from our sample of massive overcontact binaries. VFTS 066’s limited data points, combined with its low inclination and therefore dominating ellipsoidal variations in the light curve, indicate that it should perhaps not be classified as an overcontact system. Therefore, it is excluded as well from our sample. For the remaining five systems, we find that P/|Ṗ| falls between ∼1 and 20 Myr, indicating an evolution on a nuclear timescale. Comparing our results with population synthesis simulations, we observe similar discrepancies, particularly for 1.0 ≤ P ≤ 1.75 days, between the predicted and observed distributions, as seen in a previous study of O+O massive overcontact systems.
In conclusion, this study has provided new insights into the orbital period variations and evolutionary timescales of a diverse set of B+B massive overcontact binary systems. The observed discrepancies in the mass ratio distribution for B+B overcontact binaries between empirical data and theoretical predictions from population synthesis models highlight the need for further refinement. Enhancing these models is crucial for capturing the diverse nature of overcontact binaries in various evolutionary stages more accurately. This also highlights the importance of expanding the sample size for a more comprehensive understanding. This research therefore serves as a valuable cornerstone for future studies aimed at clarifying the evolution of overcontact binary systems.
Acknowledgments
We acknowledge support from the ESO Science Support Discretionary Fund under program ID SSDF 17/23 C. This project received the support of two fellowships from “La Caixa” Foundation (ID 100010434). The fellowship codes are LCF/BQ/PI23/11970035 (MAM) and LCF/BQ/PI23/11970031 (AE). PM acknowledges support from the FWO senior postdoctoral fellowship No. 12ZY523N This research has made use of the ExoDat Database, operated at LAM-OAMP, Marseille, France, on behalf of the CoRoT/Exoplanet program. Based on data from the OMC Archive at CAB (INTA-CSIC), pre-processed by ISDC and further processed by the OMC Team at CAB. The OMC Archive is part of the Spanish Virtual Observatory project. Both are funded by MCIN/AEI/10.13039/501100011033 through grants PID2020-112949GB-I00 and PID2019-107061GB-C61, respectively. This paper includes data collected by the TESS mission, which are publicly available from the Mikulski Archive for Space Telescopes (MAST). Funding for the TESS mission is provided by NASA’s Science Mission directorate. This research made use of Lightkurve, a Python package for Kepler and TESS data analysis (Lightkurve Collaboration 2018). The DASCH project at Harvard is grateful for partial support from NSF grants AST-0407380, AST-0909073, and AST-1313370.
References
- Abdul-Masih, M., Sana, H., Conroy, K. E., et al. 2020, A&A, 636, A59 [NASA ADS] [CrossRef] [EDP Sciences] [Google Scholar]
- Abdul-Masih, M., Sana, H., Hawcroft, C., et al. 2021, A&A, 651, A96 [NASA ADS] [CrossRef] [EDP Sciences] [Google Scholar]
- Abdul-Masih, M., Escorza, A., Menon, A., Mahy, L., & Marchant, P. 2022, A&A, 666, A18 [NASA ADS] [CrossRef] [EDP Sciences] [Google Scholar]
- Alfonso-Garzón, J., Domingo, A., Mas-Hesse, J. M., & Giménez, A. 2012, A&A, 548, A79 [NASA ADS] [CrossRef] [EDP Sciences] [Google Scholar]
- Andersen, J., Nordstrom, B., & Wilson, R. E. 1980, A&A, 82, 225 [NASA ADS] [Google Scholar]
- Applegate, J. H., & Shaham, J. 1994, ApJ, 436, 312 [NASA ADS] [CrossRef] [Google Scholar]
- Barentsen, G., & Lightkurve Collaboration 2020, Am. Astron. Soc. Meet. Abstr., 235, 409.04 [NASA ADS] [Google Scholar]
- Bell, S. A., & Malcolm, G. J. 1987, MNRAS, 226, 899 [CrossRef] [Google Scholar]
- Bobylev, V. V., & Bajkova, A. T. 2015, Astron. Lett., 41, 473 [NASA ADS] [CrossRef] [Google Scholar]
- Brott, I., de Mink, S. E., Cantiello, M., et al. 2011, A&A, 530, A115 [NASA ADS] [CrossRef] [EDP Sciences] [Google Scholar]
- Çakırlı, O., Ibanoglu, C., & Sipahi, E. 2014, MNRAS, 442, 1560 [CrossRef] [Google Scholar]
- Davis, P. J., Siess, L., & Deschamps, R. 2014, A&A, 570, A25 [NASA ADS] [CrossRef] [EDP Sciences] [Google Scholar]
- De Greve, J. P., & Linnell, A. P. 1994, A&A, 291, 786 [NASA ADS] [Google Scholar]
- Deleuil, M., Meunier, J. C., Moutou, C., et al. 2009, AJ, 138, 649 [NASA ADS] [CrossRef] [Google Scholar]
- Deschamps, R., Siess, L., Davis, P. J., & Jorissen, A. 2013, A&A, 557, A40 [NASA ADS] [CrossRef] [EDP Sciences] [Google Scholar]
- Drechsel, H. 1994a, Astron. Gesellschaft Abstr. Ser., 10, 95 [NASA ADS] [Google Scholar]
- Drechsel, H. J. 1994b, The Evolutionary State of SV Centauri, IUE Proposal ID SVPHD, 4773 [Google Scholar]
- Drechsel, H., & Lorenz, R. 1993, IBVS, 3868, 1 [NASA ADS] [Google Scholar]
- Drechsel, H., Rahe, J., Wargau, W., & Wolf, B. 1982, A&A, 110, 246 [NASA ADS] [Google Scholar]
- Eggen, O. J. 1961, Roy. Greenwich Obs. Bull., 27, 61 [NASA ADS] [Google Scholar]
- Fabry, M., Marchant, P., & Sana, H. 2022, A&A, 661, A123 [NASA ADS] [CrossRef] [EDP Sciences] [Google Scholar]
- Fabry, M., Marchant, P., Langer, N., & Sana, H. 2023, A&A, 672, A175 [NASA ADS] [CrossRef] [EDP Sciences] [Google Scholar]
- Franco, G. A. P. 1994, A&AS, 104, 9 [NASA ADS] [Google Scholar]
- Gosset, E., Royer, P., Rauw, G., Manfroid, J., & Vreux, J.-M. 2001, MNRAS, 327, 435 [NASA ADS] [CrossRef] [Google Scholar]
- Grindlay, J. 2017, Astrophys. Space Sci. Proc., 50, 203 [NASA ADS] [CrossRef] [Google Scholar]
- Grudić, M. Y., & Hopkins, P. F. 2019, MNRAS, 488, 2970 [CrossRef] [Google Scholar]
- Heck, A., Manfroid, J., & Mersch, G. 1985, A&AS, 59, 63 [NASA ADS] [Google Scholar]
- Heger, A., Fryer, C. L., Woosley, S. E., Langer, N., & Hartmann, D. H. 2003, ApJ, 591, 288 [CrossRef] [Google Scholar]
- Heger, A., Müller, B., & Mandel, I. 2023, ArXiv e-prints [arXiv:2304.09350] [Google Scholar]
- Henneco, J., Schneider, F. R. N., & Laplace, E. 2024, A&A, 682, A169 [NASA ADS] [CrossRef] [EDP Sciences] [Google Scholar]
- Herczeg, T. J., & Drechsel, H. 1985, Ap&SS, 114, 1 [NASA ADS] [CrossRef] [Google Scholar]
- Herrero, A. 2008, Rev. Mex. Astron. Astrofis. Conf. Ser., 33, 15 [NASA ADS] [Google Scholar]
- Hurley, J. R., Tout, C. A., & Pols, O. R. 2002, MNRAS, 329, 897 [Google Scholar]
- Hut, P. 1981, A&A, 99, 126 [NASA ADS] [Google Scholar]
- Irwin, J. B., & Landolt, A. U. 1972, PASP, 84, 686 [NASA ADS] [CrossRef] [Google Scholar]
- Istchenko, I. M., & Chugainov, P. F. 1965, IBVS, 95, 1 [NASA ADS] [Google Scholar]
- Jenkins, J. M., Twicken, J. D., Caldwell, D. A., et al. 2021, https://doi.org/10.5281/zenodo.5136731 [Google Scholar]
- Langer, N. 2012, ARA&A, 50, 107 [CrossRef] [Google Scholar]
- Lee, U., Osaki, Y., & Saio, H. 1991, MNRAS, 250, 432 [Google Scholar]
- Lenz, P., & Breger, M. 2005, Commun. Asteroseismol., 146, 53 [Google Scholar]
- Leung, K. C. 1974, A&AS, 13, 315 [NASA ADS] [Google Scholar]
- Li, F. X., Liao, W. P., Qian, S. B., et al. 2022, ApJ, 924, 30 [NASA ADS] [CrossRef] [Google Scholar]
- Lightkurve Collaboration (Cardoso, J. V. D. M., et al.) 2018, Astrophysics Source Code Library [record ascl:1812.013] [Google Scholar]
- Linnell, A. P. 1992, IAU Symp., 151, 369 [NASA ADS] [Google Scholar]
- Lomb, N. R. 1976, Ap&SS, 39, 447 [Google Scholar]
- Lorenz, R., Mayer, P., & Drechsel, H. 1999, A&A, 345, 531 [NASA ADS] [Google Scholar]
- Lorenzo, J., Negueruela, I., Vilardell, F., et al. 2016, A&A, 590, A45 [NASA ADS] [CrossRef] [EDP Sciences] [Google Scholar]
- Maeda, K. 2022, in Handbook of X-ray and Gamma-ray Astrophysics, eds. C. Bambi, & A. Santangelo, 75 [Google Scholar]
- Maeder, A., & Meynet, G. 2012, Rev. Mod. Phys., 84, 25 [Google Scholar]
- Mahy, L., Almeida, L. A., Sana, H., et al. 2020a, A&A, 634, A119 [NASA ADS] [CrossRef] [EDP Sciences] [Google Scholar]
- Mahy, L., Sana, H., Abdul-Masih, M., et al. 2020b, A&A, 634, A118 [NASA ADS] [CrossRef] [EDP Sciences] [Google Scholar]
- Marchant, P., & Bodensteiner, J. 2024, ARA&A, 62, 21 [NASA ADS] [CrossRef] [Google Scholar]
- McLeod, A. F., Dale, J. E., Evans, C. J., et al. 2019, MNRAS, 486, 5263 [Google Scholar]
- Menon, A., Langer, N., de Mink, S. E., et al. 2021, MNRAS, 507, 5013 [NASA ADS] [CrossRef] [Google Scholar]
- Moe, M., & Di Stefano, R. 2017, ApJS, 230, 15 [Google Scholar]
- Mohamed, S., & Podsiadlowski, P. 2007, ASP Conf. Ser., 372, 397 [Google Scholar]
- Nakamura, M., & Nakamura, Y. 1982, Ap&SS, 83, 163 [NASA ADS] [CrossRef] [Google Scholar]
- Paczyński, B. 1971, ARA&A, 9, 183 [Google Scholar]
- Parsons, S. G., Marsh, T. R., Copperwheat, C. M., et al. 2010, MNRAS, 407, 2362 [NASA ADS] [CrossRef] [Google Scholar]
- Paxton, B., Bildsten, L., Dotter, A., et al. 2011, ApJS, 192, 3 [Google Scholar]
- Paxton, B., Cantiello, M., Arras, P., et al. 2013, ApJS, 208, 4 [Google Scholar]
- Paxton, B., Marchant, P., Schwab, J., et al. 2015, ApJS, 220, 15 [Google Scholar]
- Perryman, M. A. C., Lindegren, L., Kovalevsky, J., et al. 1997, A&A, 323, L49 [Google Scholar]
- Plaut, L. 1948, Annalen van de Sterrewacht te Leiden, 20, 3 [NASA ADS] [Google Scholar]
- Plewa, T., & Wlodarczyk, K. J. 1993, Acta Astron., 43, 249 [NASA ADS] [Google Scholar]
- Pojmanski, G. 1997, Acta Astron., 47, 467 [Google Scholar]
- Pojmanski, G. 2003, Acta Astron., 53, 341 [NASA ADS] [Google Scholar]
- Pols, O. R. 1994, A&A, 290, 119 [Google Scholar]
- Ricker, G. R., Winn, J. N., Vanderspek, R., et al. 2015, J. Astron. Telesc. Instrum. Syst., 1, 014003 [Google Scholar]
- Rucinski, S. M., Baade, D., Lu, W. X., & Udalski, A. 1992, AJ, 103, 573 [NASA ADS] [CrossRef] [Google Scholar]
- Sana, H., de Mink, S. E., de Koter, A., et al. 2012, Science, 337, 444 [Google Scholar]
- Scargle, J. D. 1982, ApJ, 263, 835 [Google Scholar]
- Shu, F. H., Lubow, S. H., & Anderson, L. 1979, ApJ, 229, 223 [NASA ADS] [CrossRef] [Google Scholar]
- Szymanski, M. K. 2006, ArXiv e-prints [arXiv:astro-ph/0602018] [Google Scholar]
- van Leeuwen, F. 2009, A&A, 500, 505 [NASA ADS] [CrossRef] [EDP Sciences] [Google Scholar]
- van Rensbergen, W., de Greve, J. P., Mennekens, N., Jansen, K., & de Loore, C. 2011, A&A, 528, A16 [NASA ADS] [CrossRef] [EDP Sciences] [Google Scholar]
- Villaseñor, J. I., Taylor, W. D., Evans, C. J., et al. 2021, MNRAS, 507, 5348 [CrossRef] [Google Scholar]
- Virtanen, P., Gommers, R., Oliphant, T. E., et al. 2020, Nat. Meth., 17, 261 [Google Scholar]
- Wellstein, S., Langer, N., & Braun, H. 2001, A&A, 369, 939 [NASA ADS] [CrossRef] [EDP Sciences] [Google Scholar]
- Wilson, R. E. 1979, ApJ, 234, 1054 [Google Scholar]
- Wilson, R. E., & Starr, T. C. 1976, MNRAS, 176, 625 [NASA ADS] [CrossRef] [Google Scholar]
- Woosley, S. E., Heger, A., & Weaver, T. A. 2002, Rev. Mod. Phys., 74, 1015 [NASA ADS] [CrossRef] [Google Scholar]
- Wu, C., Qian, S., Li, F., et al. 2023, PASJ, 75, 358 [NASA ADS] [CrossRef] [Google Scholar]
- Yang, Y., Yuan, H., & Dai, H. 2019, AJ, 157, 111 [NASA ADS] [CrossRef] [Google Scholar]
- Zahn, J. P. 1989, A&A, 220, 112 [Google Scholar]
Appendix A: Orbital period tables
Orbital periods obtained for each of the other B+B and O+B overcontact binary datasets. For each set the BJD from the first data point and the central BJD are given.
Appendix B: Orbital period plots
All Tables
Coordinates (J2000) and orbital periods in units of days and seconds for our sample of B+B and O+B overcontact binaries and their mass ratios q = M2/M1.
Orbital periods obtained for each of the other B+B and O+B overcontact binary datasets. For each set the BJD from the first data point and the central BJD are given.
All Figures
|
Fig. 1. Time span overview of the archival photometric data used for each target. The different instrument observations are color-coded. |
| In the text | |
|
Fig. 2. Orbital period change of CT Tau. On the vertical axis, ΔPorb is the difference between the known orbital period (see Table 1) and the orbital periods determined from archival photometric data of CT Tau using PERIOD04. The best linear fit is shown in red, and the error region on this fit is shown in blue. |
| In the text | |
|
Fig. 3. Normalized probability distribution based on the population synthesis models from Menon et al. (2021). Left: Binned models for an orbital period between 0.5 and 1.0 day. Right: Orbital periods between 1.0 and 1.75 days. On the horizontal axis is the mass ratio, q, and on the vertical axis log10(P/|Ṗ|). The colors indicate, in log scale, the probability of having a system with those values of q and |
| In the text | |
|
Fig. 4. Same as Fig. 3 but binned for an orbital period of between 0.5 days and 2.5 days. For comparison, our final five studied B+B overcontact systems and the previously studied O+O overcontact systems from Abdul-Masih et al. (2022) are shown. |
| In the text | |
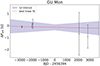 |
Fig. B.1. Similar to Fig. 2 but for GU Mon. |
| In the text | |
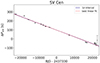 |
Fig. B.2. Similar to Fig. 2 but for SV Cen. |
| In the text | |
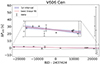 |
Fig. B.3. Similar to Fig. 2 but for V606 Cen. |
| In the text | |
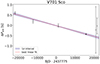 |
Fig. B.4. Similar to Fig. 2 but for V701 Sco. |
| In the text | |
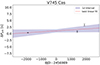 |
Fig. B.5. Similar to Fig. 2 but for V745 Cas. |
| In the text | |
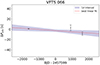 |
Fig. B.6. Similar to Fig. 2 but for VFTS 066. |
| In the text | |
Current usage metrics show cumulative count of Article Views (full-text article views including HTML views, PDF and ePub downloads, according to the available data) and Abstracts Views on Vision4Press platform.
Data correspond to usage on the plateform after 2015. The current usage metrics is available 48-96 hours after online publication and is updated daily on week days.
Initial download of the metrics may take a while.