Fig. 3.
Download original image
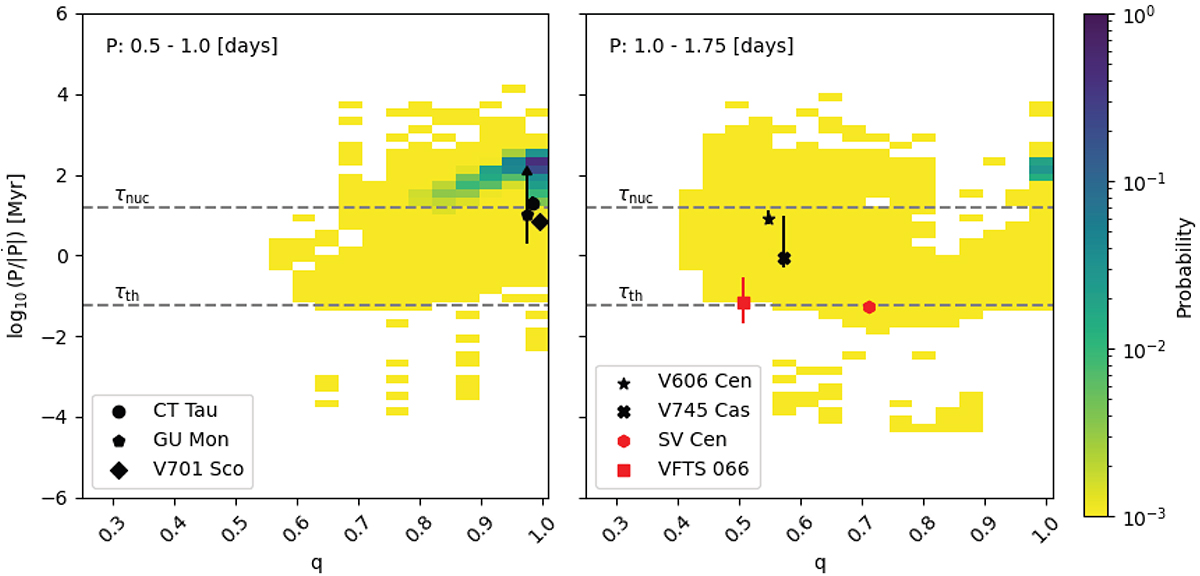
Normalized probability distribution based on the population synthesis models from Menon et al. (2021). Left: Binned models for an orbital period between 0.5 and 1.0 day. Right: Orbital periods between 1.0 and 1.75 days. On the horizontal axis is the mass ratio, q, and on the vertical axis log10(P/|Ṗ|). The colors indicate, in log scale, the probability of having a system with those values of q and ![]() . Anything with a probability of ≤10−3 is indicated in yellow. The studied systems in black are located on the probability distribution plot and are shown with their corresponding errors. If the value does not have an upper limit, we indicate this error with an arrow. The red-colored binary systems are those excluded from the discussion on overcontact binaries. For reference, we plot the nuclear and thermal timescales of a 12 M⊙ star calculated based on the evolutionary tracks from Brott et al. (2011) in gray.
. Anything with a probability of ≤10−3 is indicated in yellow. The studied systems in black are located on the probability distribution plot and are shown with their corresponding errors. If the value does not have an upper limit, we indicate this error with an arrow. The red-colored binary systems are those excluded from the discussion on overcontact binaries. For reference, we plot the nuclear and thermal timescales of a 12 M⊙ star calculated based on the evolutionary tracks from Brott et al. (2011) in gray.
Current usage metrics show cumulative count of Article Views (full-text article views including HTML views, PDF and ePub downloads, according to the available data) and Abstracts Views on Vision4Press platform.
Data correspond to usage on the plateform after 2015. The current usage metrics is available 48-96 hours after online publication and is updated daily on week days.
Initial download of the metrics may take a while.