Free Access
Fig. 3
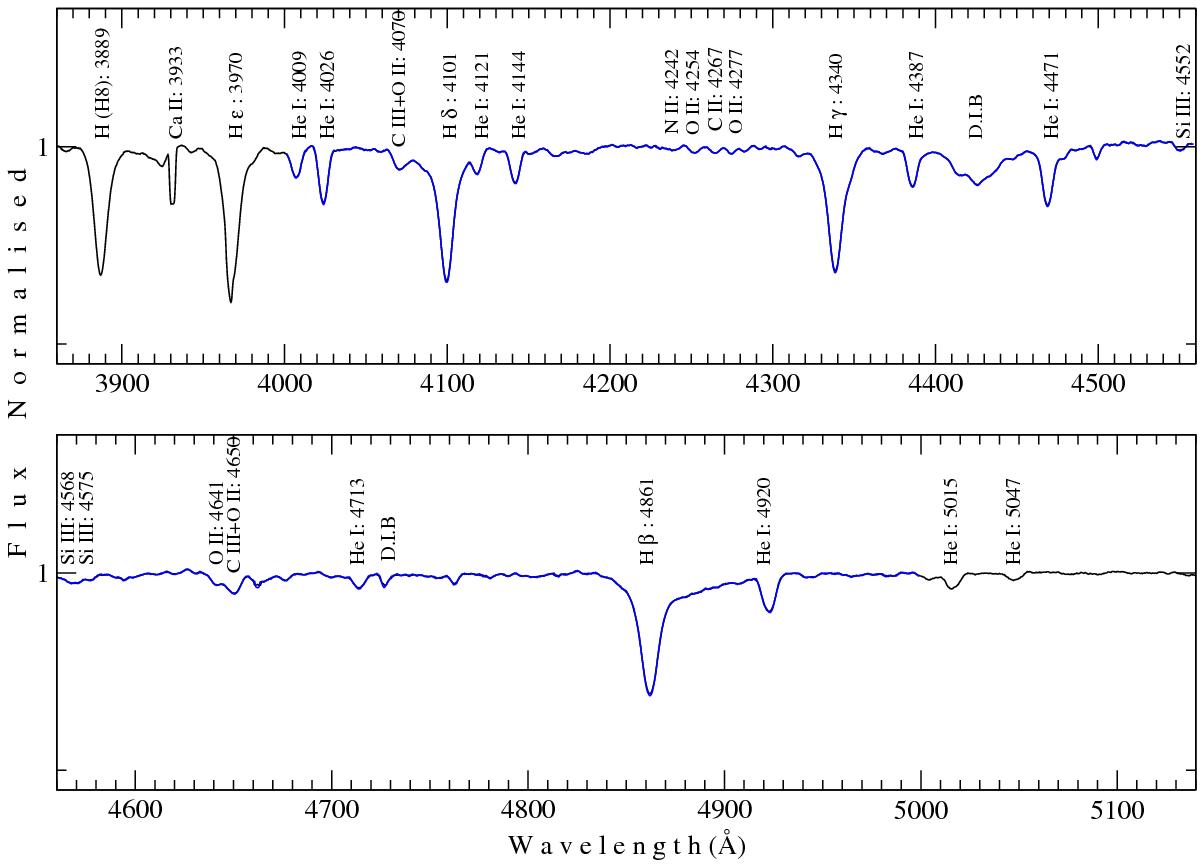
Classification spectrum of GU Mon. Labels identify the most characteristic spectral lines. The region shown in blue (between 4000 and 5000 Å) represents the spectral range selected for the cross-correlation. D.I.B indicates the main diffuse interstellar bands.
Current usage metrics show cumulative count of Article Views (full-text article views including HTML views, PDF and ePub downloads, according to the available data) and Abstracts Views on Vision4Press platform.
Data correspond to usage on the plateform after 2015. The current usage metrics is available 48-96 hours after online publication and is updated daily on week days.
Initial download of the metrics may take a while.