| Issue |
A&A
Volume 589, May 2016
|
|
|---|---|---|
| Article Number | L7 | |
| Number of page(s) | 4 | |
| Section | Letters | |
| DOI | https://doi.org/10.1051/0004-6361/201628216 | |
| Published online | 20 April 2016 | |
Light walls around sunspots observed by the Interface Region Imaging Spectrograph⋆
1
Key Laboratory of Solar Activity, National Astronomical Observatories,
Chinese Academy of Sciences,
100012
Beijing,
PR China
e-mail:
This email address is being protected from spambots. You need JavaScript enabled to view it.
2
University of Chinese Academy of Sciences,
100049
Beijing, PR
China
Received: 29 January 2016
Accepted: 1 April 2016
Abstract
Context. The Interface Region Imaging Spectrograph (IRIS) mission provides high-resolution observations of the chromosphere and transition region. Using these data, some authors have reported the new finding of light walls above sunspot light bridges.
Aims. We try to determine whether the light walls exist somewhere else in active regions in addition to the light bridges. We also examine how the material of these walls evolves.
Methods. Employing six months of (from 2014 December to 2015 June) high tempo-spatial data from the IRIS, we find many light walls either around sunspots or above light bridges.
Results. For the first time, we report one light wall near an umbral-penumbral boundary and another along a neutral line between two small sunspots. The former light wall has a multilayer structure and is associated with the emergence of positive magnetic flux in the ambient negative field. The latter light wall is associated with a filament activation, and the wall body consists of the filament material, which flowed to a remote plage region with a negative magnetic field after the light wall disappeared.
Conclusions. These new observations reveal that these light walls are multilayer and multithermal structures that occur along magnetic neutral lines in active regions.
Key words: sunspots / Sun: atmosphere / Sun: filaments, prominences / Sun: UV radiation
Movies associated to Figs. 1–4 are available in electronic form at http://www.aanda.org
© ESO, 2016
1. Introduction
Sunspots are concentrations of magnetic fields and appear as dark patches on the visible solar surface. Their strong magnetic fields of up to 4000 G inhibit the normal convective energy transports in the convection zone (Solanki 2003; Thomas & Weiss 2004). In the photosphere and chromosphere layers, a typical sunspot is characterized by a dark core, the umbra, and a less dark halo, which is the penumbra that surrounds the umbra. Based on the work of Curdt et al. (2001) about the sunspot spectra obtained by SUMER (Solar Ultraviolet Measurements of Emitted Radiation), Tian et al. (2009) revealed that the transition region above sunspots is higher and more extended than the plage regions. In the sunspot umbra, the overturning motion of the plasma is hindered by the strong magnetic field, which leads to a lower temperature in the photospheric layers as a result of the reduced energy input from below (Gough & Tayler 1966). Bright structures within the umbra are signatures of not completely suppressed convection, and light bridges are the best-known representative of these structures (Sobotka et al. 1993). The magnetic field of light bridges is generally weaker and more inclined than the local strong and vertical field, which forms a magnetic canopy (Lites et al. 1991; Rueedi et al. 1995; Leka 1997; Jurčák et al. 2006).
Recently, Yang et al. (2015) reported an oscillating light wall above a sunspot light bridge with the high tempo-spatial data from the Interface Region Imaging Spectrograph (IRIS; De Pontieu et al. 2014). They found that the light wall is brighter than the ambient areas while the wall top is much brighter than the wall body in the 1330 Å passband. Similar observations of plasma ejections from a light bridge have also been reported previously (Asai et al. 2001; Shimizu et al. 2009; Robustini et al. 2016). Nevertheless, many questions about the light wall are still waiting to be answered, for example, whether a light wall can only be rooted in a light bridge, and which physical mechanism drives the kinematic evolution of a light wall.
Our work mainly concerns the structures of light walls at different locations and the kinematics of the material the walls are made of. We examined about six months of IRIS data from 2014 December to 2015 June and found that most of the light walls originate above the light bridges, but some light walls are observed near the umbral-penumbral boundary, and one light wall is located along the polarity inversion line. Using coordinated observations from the IRIS, the Solar Dynamic Observatory (SDO; Pesnell et al. 2012), and the New Vacuum Solar Telescope (NVST; Liu et al. 2014) of the Fuxian Solar Observatory in China, we report on two light walls around sunspots in detail.
2. Observations and data analysis
In this Letter, one series of IRIS slit-jaw 1330 Å images (SJIs) and two series of SJIs in 1400 Å are studied. They are all Level 2 data. The 1330 Å passband contains emission from the strong C II 1334/1335 Å lines that are formed in the upper chromosphere and transition region, while the 1400 Å channel contains emission from the Si IV 1394/1403 Å lines that are formed in the lower transition region. On 2014 December 19, the SJIs in 1330 Å focused on NOAA AR 12242 were taken from 17:32:53 UT to 18:30:33 UT with a pixel scale of 0.̋333 and a cadence of 12 s. For the spectroscopic analysis of this event, we used the line of Si IV in 1403 Å, which is formed in the middle transition region with a temperature of about 104.9 K (Li et al. 2014; Tian et al. 2014). The spectral data were taken in a large coarse eight-step mode with 12 s cadence. Since the Si IV profiles are close to a Gaussian distribution, we used single-Gaussian fits to approximate the 1403 Å line (Peter et al. 2014). On 2015 January 16, the 1400 Å SJIs that are focused on NOAA 12259 were obtained from 07:04:41 UT to 08:04:20 UT and from 08:42:12 UT to 09:21:06 UT with a cadence of 13 s and a pixel size of 0.̋333.
The NVST was also pointed at NOAA 12259 on 2015 January 16, and we obtained a series of Hα images. From 07:18:00 UT to 08:14:00 UT, the Hα 6562.8 Å observations had a cadence of 12 s and a pixel scale of 0.̋164. The Level 0 Hα images were first calibrated to Level 1 by dark current subtraction and flat field correction, and then the Level 1 images were reconstructed to Level 1+ by speckle masking (see Weigelt 1977; Lohmann et al. 1983).
Moreover, the Atmospheric Imaging Assembly (AIA; Lemen et al. 2012) and the Helioseismic and Magnetic Imager (HMI; Scherrer et al. 2012) observations from the SDO were used. The 304 Å, 171 Å, and 193 Å data with a cadence of 12 s and a pixel size of 0.̋6 show the light wall at different temperatures. The observations of 1600 Å from 2015 January 15 15:00:00 UT to January 16 15:00:00 UT were taken to replace the 1400 Å SJIs for a long-time measurement of brightness around the light wall base. We also used the full-disk line-of-sight (LOS) magnetogram and the intensitygram from the HMI, with a cadence of 45 s and a sampling of 0.̋5 pixel-1. Using the cross-correlation method, we co-aligned all the IRIS, NVST, and SDO images according to specific features (Yang et al. 2014).
3. Results
3.1. A light wall with multilayer structure along an umbral-penumbral boundary
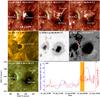 |
Fig. 1 Panels a)−c): IRIS 1400 Å images showing the development of the light wall on 2015 January 16. The green curves in different panels are the contours of the brightness at different times, which approximately denote the bases of light walls. The features in the white dashed windows are sharpened. Panels d) and g): AIA 171 Å and 1600 Å images exhibiting the light wall in two different temperatures. Panels e)−f): HMI continuum intensity and LOS magnetogram displaying the light wall location around sunspots and the underlying magnetic field, respectively. The red curves duplicate the contour in panel b). Panels h): positive magnetic flux (blue curve) and brightness (red curve) of the wall base location during 24 h. The orange region shows the stage of light wall appearance. The full temporal evolution of the 1400 Å, 171 Å, 304 Å and 1600 Å images is available as a movie. |
A light wall along an umbral-penumbral boundary appeared on 2015 January 16 around a sunspot of NOAA 12259. Figures 1a−c show that the light wall possessed a multilayer structure (see movie attached to Fig. 1). In the 1400 Å images, the wall base (green contours in panels a–c) is brighter than the surrounding area. At about 08:43 UT, the first and second layers of the light wall emerged from the umbral-penumbral boundary, but they separated and extended to different distances several minutes later. Figure 1b clearly shows two light wall layers at 08:47:17 UT. When the two layers fell back to their wall base, the third layer appeared (panel c). Panel d exhibits the first layer of the wall in 171 Å, and it is clear that the layer top has high emission, while the emissions at both the base and body are quite low. The HMI intensitygram in panel e shows the location of the wall base along the umbral-penumbral boundary. To understand the magnetic field environment around the wall base, we measured the positive magnetic flux (see the blue line in panel h) and the brightness (red line) at the wall base location. Since the data from IRIS/SJI 1400 Å do not cover the whole period of the brightness measurement, we took SDO/AIA 1600 Å observations from 15-Jan. 15:00 UT to 16-Jan. 15:00 UT as substitutes (panel g). They indicate that a line-like positive magnetic field emerged underneath the wall base (panel f). The emerging flux showed two peaks in 24 h, and the light wall appeared at the rising phase of the second peak (orange region in panel h). Meanwhile, the brightness at the wall base clearly increased.
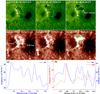 |
Fig. 2 Panels a)−c): NVST Hα images displaying the light wall one hour earlier than in Fig. 1. Panels d)−f): a series of IRIS 1400 Å images showing the light wall. The green curve in panel f) is the contour of a brightening patch, and the white curve in panel c) is the duplication of the patch contour here. The light walls in white dashed windows are sharpened. Panels g): Hα brightness along curve A–B in panel a). Panels f): Hα (blue curve) and 1400 Å (red curve) brightness within the arc-sector domain C–D in panels b) and e), respectively. An animation of the 1400 Å and the Hα images is available. |
To study the multiwavelength appearances of the light wall, we employed the NVST Hα data and compared them with corresponding IRIS SJIs of 1400 Å (see Fig. 2). The Hα observations only cover the period from 07:18:00 UT to 08:14:00 UT (see movie attached to Fig. 2), which is one hour earlier than that shown in Fig. 1, but fortunately, the simultaneous IRIS data are also available and the light wall at this time is still conspicuous. At 07:54:52 UT, the light wall in Hα seemed to be composed of multiple bright and dark threads. However, the 1400 Å image only displays the bright threads, while the dark threads could not be observed. To research the fine structures of the light wall, we made a cut along the slice A–B (see the blue curve in panel a) and present the brightness along the cut in panel g. To compare the emission between Hα and 1400 Å images, arc-sector domains (see the blue and red curves in panels b and e) along the light wall top were selected. We show the brightness along the arc-sector domains in panel h. The blue and red curves are almost unrelated, except for the first peak around 4.8 Mm. At 08:01:56 UT, a brightening patch of the light wall was observed in 1400 Å and we made a contour (green curve in panel f) to outline it. But in the Hα image of panel c, the brightening was not observed in this region. A bulk of dark materials instead occupied the area.
3.2. Light wall associated with filament activation above a neutral line
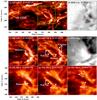 |
Fig. 3 Panels a): IRIS SJI of 1330 Å showing the light wall on 2014 December 19. The green square outlines the field of view of panels b)−h). Panels b): SDO/HMI continuum intensity displaying the light wall’s location around sunspots. The red line means the base of light wall which is rooted on the neutral line between two small sunspots. Panels c)−d) and f)−h): sequences of 1330 Å and 304 Å images displaying the evolution of the light wall and the associated filament. Panels e): HMI LOS magnetogram revealing the magnetic field beneath the light wall. The temporal evolution of the 1330 Å, 193 Å, and 304 Å images is available as a movie. |
The light wall above a neutral line occurred on 2014 December 19 and was associated with a filament activation (see movie attached to Fig. 3). Figure 3a shows the light wall in NOAA 12242. It looks like a comb. According to the intensitygram from SDO/HMI in panel b, this light wall is rooted in the neutral line (delineated by the red lines in panels b and e) between two small sunspots with opposite-polarity magnetic fields. Panels c, d display the evolution of this light wall in 1330 Å SJIs. Before the appearance of the light wall, a filament was observed near the neutral line (panels c and f). Then the filament was activated and dark material moved upward, forming a comb-shaped light wall (panels d and g). It seems that the light wall was traced out by the activated material of the filament and was composed of many fine structures as seen in 1330 Å SJI. The wall top and base were brighter than the wall body in both 304 Å and 1330 Å. At 17:40 UT, the material of the light wall descended to the base, and then the light wall disappeared (panel h). Moreover, associated with the filament activation, partial material was brightened and moved to a remote plage region with a negative magnetic field after the material of the wall body fell to the base (see movie attached to Fig. 4).
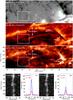 |
Fig. 4 Panels a)−c): SDO/HMI LOS magnetogram, SDO/AIA 304 Å, and IRIS 1330 Å images exhibiting the magnetic field environment and bright flow from the base after the material of the wall body fell onto the base. The white rectangles in panels a)−c) indicate the area where the flow stops. The green curve in panel c) is the brightness contour in channel 1330 Å at 17:46:12 UT and is also shown in panel a). The white dashed line in panel c) shows the slit location. Panels d)−e): Si IV 1403 Å spectra in the slit range of panel c) and the profiles (solid lines) and its Gaussian fittings (dotted lines) of this line at blue and red plus positions in panel c). Panels f)−g): similar to panels d)−e), but at 17:47:24 UT. An animation of the 1330 Å and 304 Å channels shown in this figure is available. |
To investigate the kinematic evolution of material relevant to this wall base, we chose a larger field of view that covered the wall and remote plage region. The SDO/HMI magnetogram, AIA 304 Å, and IRIS 1330 Å images are displayed, and thus we can study the relation among the magnetic connectivity, the light wall, and the bright flow from the base. Moreover, the spectra data were used for a Doppler velocity measurement (see Fig. 4). At about 17:46 UT, emission at the wall base enhanced in the 1330 Å passband, and much bright material began to move and formed a flow in the direction of the remote plage region (white rectangles in panels b and c). The magnetogram in panel a reveals that the magnetic fields in the rectangle are negative. The IRIS slit (white dashed line in panel c) was located in the middle of the material flow, therefore we took the spectra data to measure the Doppler velocity of the flow. We show them in panels d–g. In the flow region, the profile of the Si IV 1403 line is blueshifted (between the two green dashed lines in panels d and f), which means that this region is full of the flow that moves from the wall base to the rectangle area. Along the slit, we selected two locations in the flow region. We show their spectra profiles and the Gaussian fits in panels e and g. At 17:46:12 UT, the blueshift velocities at the blue and red plus positions in panel c are 13.1 and 10.4 km s-1 , respectively (see panel e). At 17:47:24 UT, the blueshift velocities at the blue and red pluses in panel c are 7.4 and 9.1 km s-1, respectively (see panel g).
4. Conclusions and discussion
Employing high tempo-spatial IRIS observations, we found many light walls. In IRIS 1400 Å and 1330 Å SJIs, the light wall is brighter than the ambient area, while its base and top are much brighter than the wall body. For the first time, we observed a light wall along the polarity inversion line between two small sunspots in NOAA 12242. This light wall was associated with a filament activation, and the wall body was filled with the filament material. In addition, along the umbral-penumbral boundary of a sunspot in NOAA 12259, we observed a light wall with a multilayer structure. It was rooted in an emerging magnetic field with a line-like shape.
The light wall on 2015 January 16 appeared along the umbral-penumbral boundary, and its base was rooted in an emerging magnetic field. It is widely believed that the bright knots and frequent mass ejections in the chromosphere are driven by emerging flux that successively reconnects with the surrounding area (Kurokawa & Kawai 1993; Asai et al. 2001; Zhang & Wang 2002; Bharti et al. 2007; Shimizu et al. 2009). Different from the works of Asai et al. (2001), Shimizu et al. (2009), and Yang et al. (2015), the light walls we reported were not located above light bridges and behaved as a whole rather than separate ejections. To explain the multilayer structure of the wall along the umbral-penumbral boundary, we proposed two scenarios: the light wall has only a single fan-shaped magnetic structure that is continuously perturbed, or the light wall has many fan-shaped magnetic structures. To study this light wall in greater detail, NVST Hα observations were added, and we showed that the same light wall displayed different features in IRIS SJIs and Hα images (see Fig. 2). The light wall apparently consists of warm (1330 Å and 1400 Å) and cold (Hα) material simultaneously. In the 1330 Å and 1400 Å channels, the cold material seems semitransparent and optically thin, while the hot structure was clearly detected (Li & Zhang 2015). This causes the wall body to appear as a brightening (see panels d–f). In the Hα passband, the cold material strongly absorbs the radiation (Heinzel et al. 2001), which causes the wall body to appear as a dark structure (see panels a–c). The observations of both the NVST Hα and IRIS UV channel are all sensitive to chromosphere and transition region temperatures, and the base of the light wall is brightening in these channels (see Fig. 2). Moreover, the brightening is associated with magnetic flux emergence at the photosphere (see Fig. 1). We therefore suggest that the magnetic reconnection, which may trigger the brightening at the wall base, occurs in the lower atmosphere.
The light wall associated with a filament is located along the polarity inversion line. We detected a material flow from the light wall base to a remote plage region with a negative magnetic field after the wall body material fell onto the base. From examining the magnetic field environment and the flow, we suggest that this light wall traces part of the magnetic structure that is rooted in the positive-polarity fields at the side of the neutral line. The flow then moves along the loops connecting the positive field beneath the wall base and the remote negative field.
Online Material
Movie of Fig. 1
Access Supplementary Material
Movie of Fig. 2
Access Supplementary Material
Movie of Fig. 3
Access Supplementary Material
Movie of Fig. 4
Access Supplementary MaterialAcknowledgments
We thank the referee for the valuable suggestions. The data are used courtesy of the IRIS, SDO and NVST science teams. IRIS is a NASA small explorer mission developed and operated by LMSAL with mission operations executed at NASA Ames Research center and major contributions to downlink communications funded by ESA and the Norwegian Space Centre. This work is supported by the National Natural Science Foundations of China (11533008, 11303050, 11303049, 11373004, 11203037 and 11221063), the Strategic Priority Research Program−The Emergence of Cosmological Structures of the Chinese Academy of Sciences (Grant No. XDB09000000) and the Youth Innovation Promotion Association of CAS (2014043).
References
- Asai, A., Ishii, T. T., & Kurokawa, H. 2001, ApJ, 555, L65 [NASA ADS] [CrossRef] [Google Scholar]
- Bharti, L., Rimmele, T., Jain, R., Jaaffrey, S. N. A., & Smartt, R. N. 2007, MNRAS, 376, 1291 [Google Scholar]
- Curdt, W., Brekke, P., Feldman, U., et al. 2001, A&A, 375, 591 [NASA ADS] [CrossRef] [EDP Sciences] [Google Scholar]
- De Pontieu, B., Title, A. M., Lemen, J. R., et al. 2014, Sol. Phys., 289, 2733 [NASA ADS] [CrossRef] [Google Scholar]
- Gough, D. O., & Tayler, R. J. 1966, MNRAS, 133, 85 [NASA ADS] [CrossRef] [Google Scholar]
- Heinzel, P., Schmieder, B., & Tziotziou, K. 2001, ApJ, 561, L223 [NASA ADS] [CrossRef] [Google Scholar]
- Jurčák, J., Martínez Pillet, V., & Sobotka, M. 2006, A&A, 453, 1079 [NASA ADS] [CrossRef] [EDP Sciences] [Google Scholar]
- Kurokawa, H., & Kawai, G. 1993, IAU Colloq. 141: The Magnetic and Velocity Fields of Solar Active Regions, 46, 507 [NASA ADS] [Google Scholar]
- Leka, K. D. 1997, ApJ, 484, 900 [NASA ADS] [CrossRef] [Google Scholar]
- Lemen, J. R., Title, A. M., Akin, D. J., et al. 2012, Sol. Phys., 275, 17 [NASA ADS] [CrossRef] [Google Scholar]
- Li, T., & Zhang, J. 2015, Sol. Phys., 290, 2857 [NASA ADS] [CrossRef] [Google Scholar]
- Li, L. P., Peter, H., Chen, F., & Zhang, J. 2014, A&A, 570, A93 [NASA ADS] [CrossRef] [EDP Sciences] [Google Scholar]
- Lites, B. W., Bida, T. A., Johannesson, A., & Scharmer, G. B. 1991, ApJ, 373, 683 [NASA ADS] [CrossRef] [Google Scholar]
- Liu, Z., Xu, J., Gu, B.-Z., et al. 2014, RA&A, 14, 705 [Google Scholar]
- Lohmann, A. W., Weigelt, G., & Wirnitzer, B. 1983, Appl. Opt., 22, 4028 [NASA ADS] [CrossRef] [PubMed] [Google Scholar]
- Pesnell, W. D., Thompson, B. J., & Chamberlin, P. C. 2012, Sol. Phys., 275, 3 [NASA ADS] [CrossRef] [Google Scholar]
- Peter, H., Tian, H., Curdt, W., et al. 2014, Science, 346, 1255726 [NASA ADS] [CrossRef] [Google Scholar]
- Robustini, C., Leenaarts, J., de la Cruz Rodriguez, J., & Rouppe van der Voort, L. 2016, A&A, in press, DOI: 10.1051/0004-6361/201528022 [Google Scholar]
- Rueedi, I., Solanki, S. K., & Livingston, W. 1995, A&A, 302, 543 [NASA ADS] [Google Scholar]
- Scherrer, P. H., Schou, J., Bush, R. I., et al. 2012, Sol. Phys., 275, 207 [Google Scholar]
- Shimizu, T., Katsukawa, Y., Kubo, M., et al. 2009, ApJ, 696, L66 [NASA ADS] [CrossRef] [Google Scholar]
- Sobotka, M., Bonet, J. A., & Vazquez, M. 1993, ApJ, 415, 832 [NASA ADS] [CrossRef] [Google Scholar]
- Solanki, S. K. 2003, A&ARv, 11, 153 [Google Scholar]
- Thomas, J. H., & Weiss, N. O. 2004, ARA&A, 42, 517 [NASA ADS] [CrossRef] [Google Scholar]
- Tian, H., Curdt, W., Teriaca, L., Landi, E., & Marsch, E. 2009, A&A, 505, 307 [NASA ADS] [CrossRef] [EDP Sciences] [Google Scholar]
- Tian, H., DeLuca, E., Reeves, K. K., et al. 2014, ApJ, 786, 137 [NASA ADS] [CrossRef] [Google Scholar]
- Weigelt, G. P. 1977, Opt. Comm., 21, 55 [Google Scholar]
- Yang, S., Zhang, J., & Xiang, Y. 2014, ApJ, 793, L28 [NASA ADS] [CrossRef] [Google Scholar]
- Yang, S., Zhang, J., Jiang, F., & Xiang, Y. 2015, ApJ, 804, L27 [NASA ADS] [CrossRef] [Google Scholar]
- Zhang, J., & Wang, J. 2002, ApJ, 566, L117 [NASA ADS] [CrossRef] [Google Scholar]
All Figures
|
Fig. 1 Panels a)−c): IRIS 1400 Å images showing the development of the light wall on 2015 January 16. The green curves in different panels are the contours of the brightness at different times, which approximately denote the bases of light walls. The features in the white dashed windows are sharpened. Panels d) and g): AIA 171 Å and 1600 Å images exhibiting the light wall in two different temperatures. Panels e)−f): HMI continuum intensity and LOS magnetogram displaying the light wall location around sunspots and the underlying magnetic field, respectively. The red curves duplicate the contour in panel b). Panels h): positive magnetic flux (blue curve) and brightness (red curve) of the wall base location during 24 h. The orange region shows the stage of light wall appearance. The full temporal evolution of the 1400 Å, 171 Å, 304 Å and 1600 Å images is available as a movie. |
| In the text | |
|
Fig. 2 Panels a)−c): NVST Hα images displaying the light wall one hour earlier than in Fig. 1. Panels d)−f): a series of IRIS 1400 Å images showing the light wall. The green curve in panel f) is the contour of a brightening patch, and the white curve in panel c) is the duplication of the patch contour here. The light walls in white dashed windows are sharpened. Panels g): Hα brightness along curve A–B in panel a). Panels f): Hα (blue curve) and 1400 Å (red curve) brightness within the arc-sector domain C–D in panels b) and e), respectively. An animation of the 1400 Å and the Hα images is available. |
| In the text | |
|
Fig. 3 Panels a): IRIS SJI of 1330 Å showing the light wall on 2014 December 19. The green square outlines the field of view of panels b)−h). Panels b): SDO/HMI continuum intensity displaying the light wall’s location around sunspots. The red line means the base of light wall which is rooted on the neutral line between two small sunspots. Panels c)−d) and f)−h): sequences of 1330 Å and 304 Å images displaying the evolution of the light wall and the associated filament. Panels e): HMI LOS magnetogram revealing the magnetic field beneath the light wall. The temporal evolution of the 1330 Å, 193 Å, and 304 Å images is available as a movie. |
| In the text | |
|
Fig. 4 Panels a)−c): SDO/HMI LOS magnetogram, SDO/AIA 304 Å, and IRIS 1330 Å images exhibiting the magnetic field environment and bright flow from the base after the material of the wall body fell onto the base. The white rectangles in panels a)−c) indicate the area where the flow stops. The green curve in panel c) is the brightness contour in channel 1330 Å at 17:46:12 UT and is also shown in panel a). The white dashed line in panel c) shows the slit location. Panels d)−e): Si IV 1403 Å spectra in the slit range of panel c) and the profiles (solid lines) and its Gaussian fittings (dotted lines) of this line at blue and red plus positions in panel c). Panels f)−g): similar to panels d)−e), but at 17:47:24 UT. An animation of the 1330 Å and 304 Å channels shown in this figure is available. |
| In the text | |
Current usage metrics show cumulative count of Article Views (full-text article views including HTML views, PDF and ePub downloads, according to the available data) and Abstracts Views on Vision4Press platform.
Data correspond to usage on the plateform after 2015. The current usage metrics is available 48-96 hours after online publication and is updated daily on week days.
Initial download of the metrics may take a while.