Fig. 1
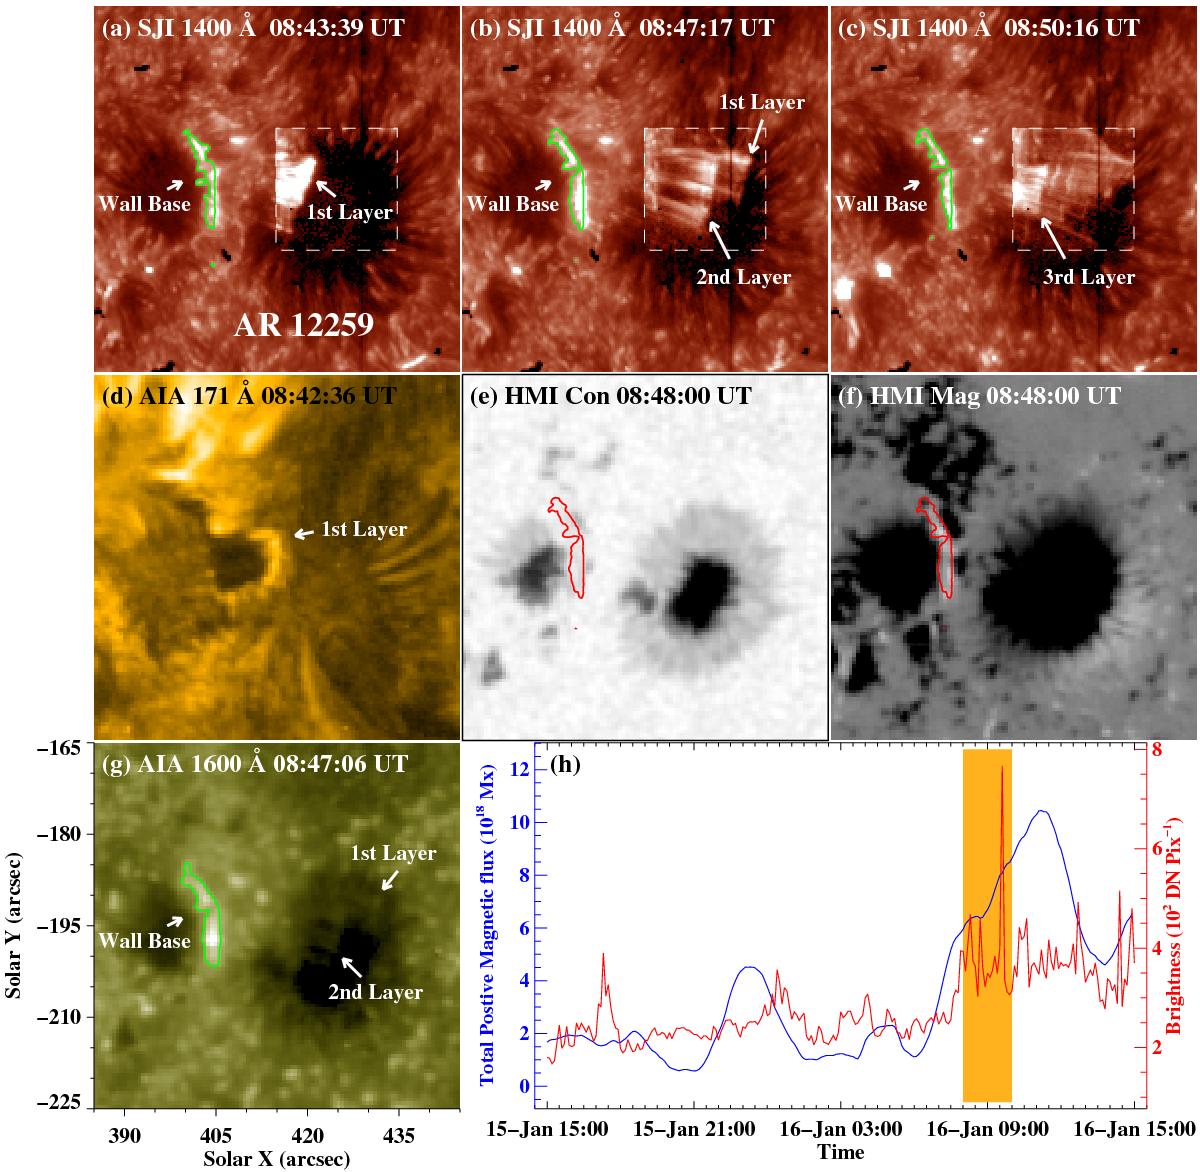
Panels a)−c): IRIS 1400 Å images showing the development of the light wall on 2015 January 16. The green curves in different panels are the contours of the brightness at different times, which approximately denote the bases of light walls. The features in the white dashed windows are sharpened. Panels d) and g): AIA 171 Å and 1600 Å images exhibiting the light wall in two different temperatures. Panels e)−f): HMI continuum intensity and LOS magnetogram displaying the light wall location around sunspots and the underlying magnetic field, respectively. The red curves duplicate the contour in panel b). Panels h): positive magnetic flux (blue curve) and brightness (red curve) of the wall base location during 24 h. The orange region shows the stage of light wall appearance. The full temporal evolution of the 1400 Å, 171 Å, 304 Å and 1600 Å images is available as a movie.
Current usage metrics show cumulative count of Article Views (full-text article views including HTML views, PDF and ePub downloads, according to the available data) and Abstracts Views on Vision4Press platform.
Data correspond to usage on the plateform after 2015. The current usage metrics is available 48-96 hours after online publication and is updated daily on week days.
Initial download of the metrics may take a while.