Fig. 3
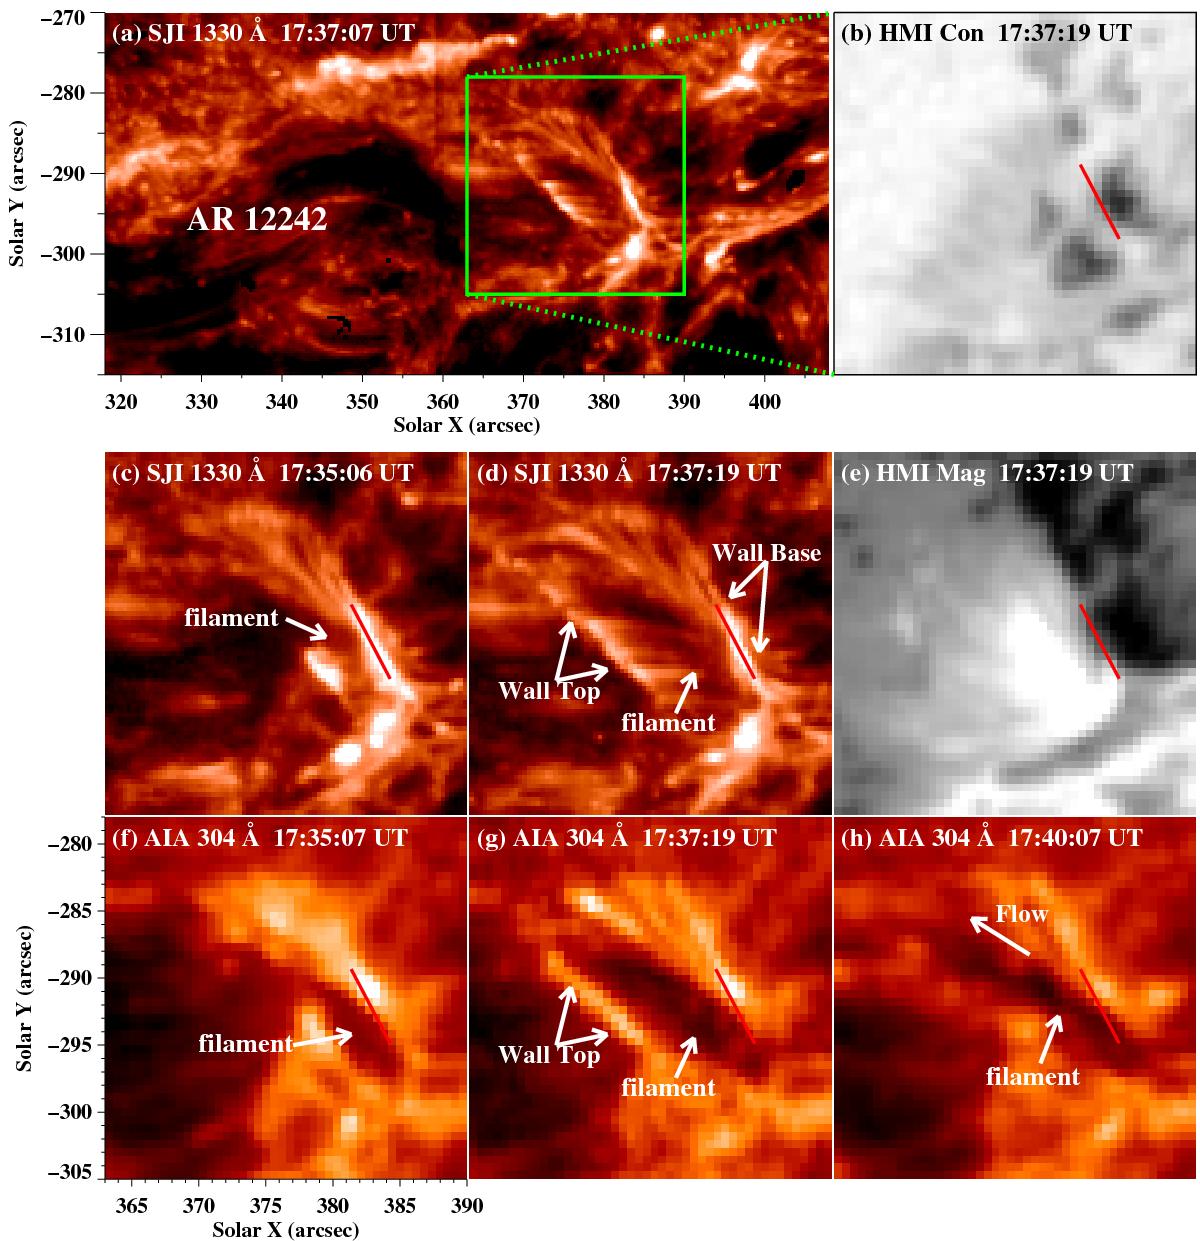
Panels a): IRIS SJI of 1330 Å showing the light wall on 2014 December 19. The green square outlines the field of view of panels b)−h). Panels b): SDO/HMI continuum intensity displaying the light wall’s location around sunspots. The red line means the base of light wall which is rooted on the neutral line between two small sunspots. Panels c)−d) and f)−h): sequences of 1330 Å and 304 Å images displaying the evolution of the light wall and the associated filament. Panels e): HMI LOS magnetogram revealing the magnetic field beneath the light wall. The temporal evolution of the 1330 Å, 193 Å, and 304 Å images is available as a movie.
Current usage metrics show cumulative count of Article Views (full-text article views including HTML views, PDF and ePub downloads, according to the available data) and Abstracts Views on Vision4Press platform.
Data correspond to usage on the plateform after 2015. The current usage metrics is available 48-96 hours after online publication and is updated daily on week days.
Initial download of the metrics may take a while.