Fig. 4
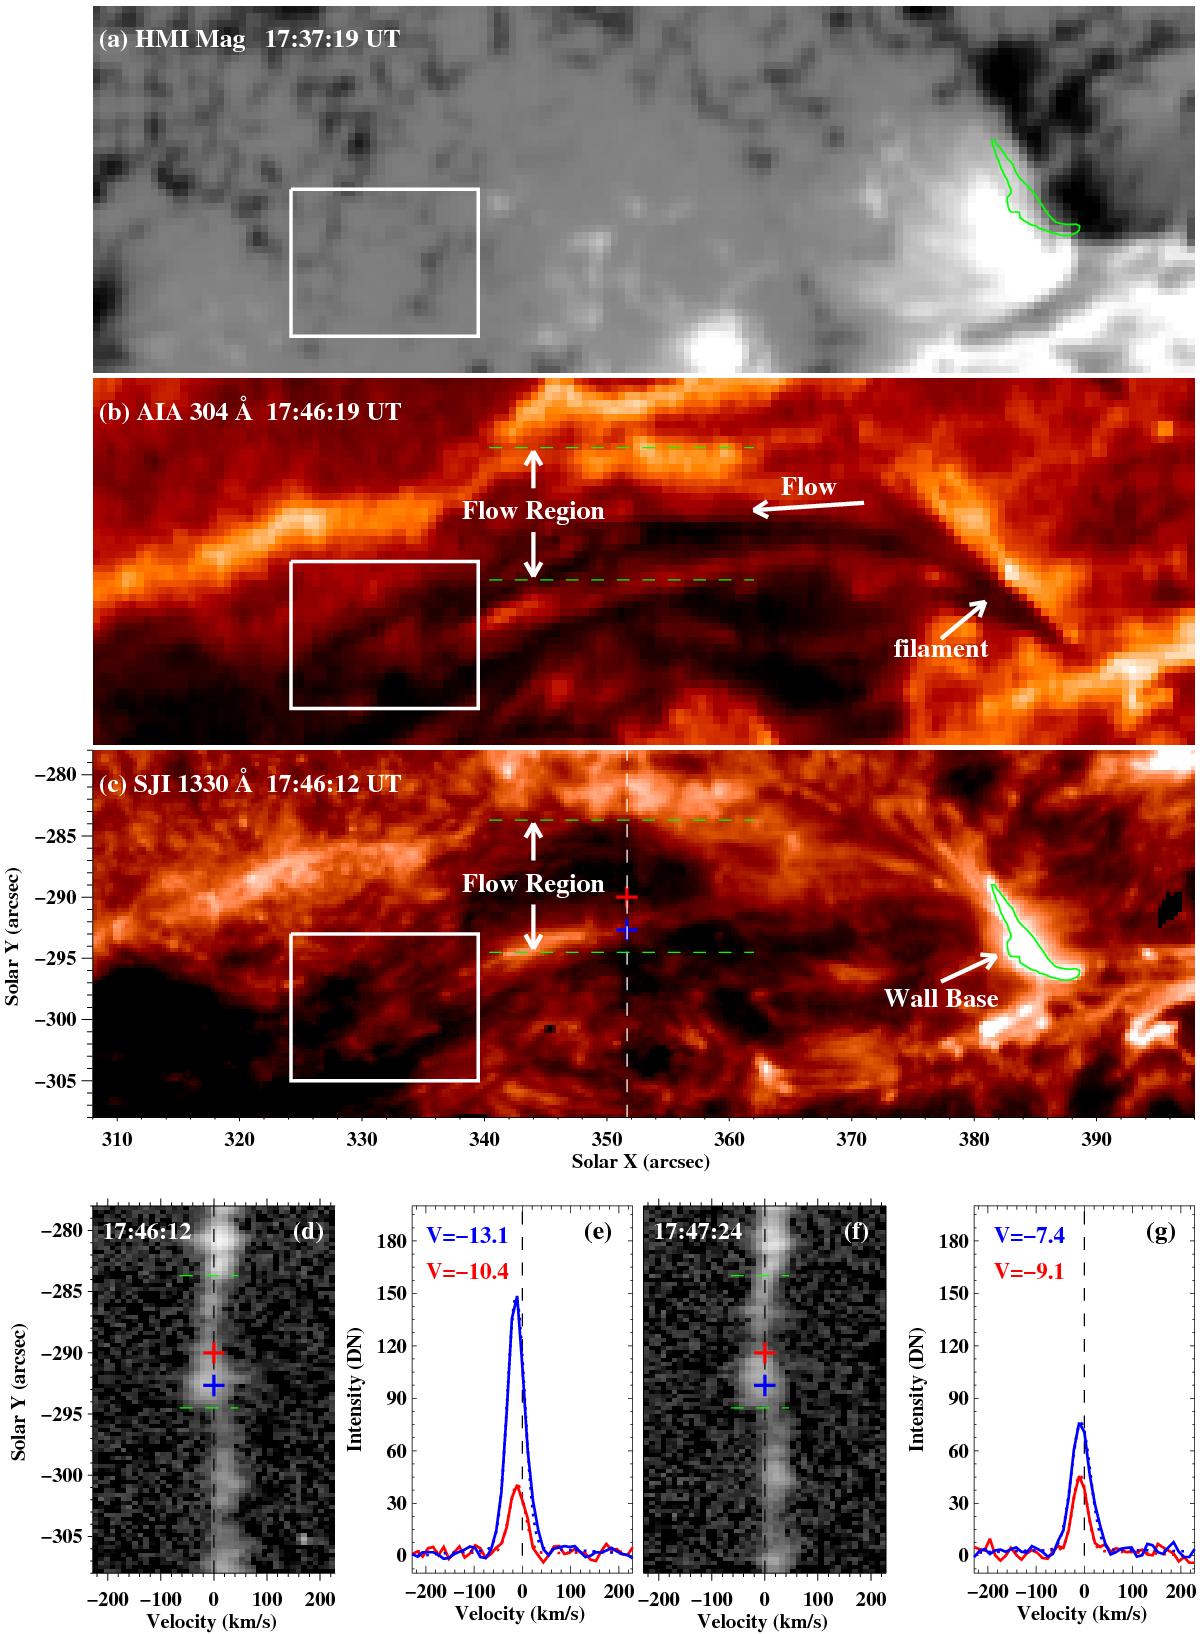
Panels a)−c): SDO/HMI LOS magnetogram, SDO/AIA 304 Å, and IRIS 1330 Å images exhibiting the magnetic field environment and bright flow from the base after the material of the wall body fell onto the base. The white rectangles in panels a)−c) indicate the area where the flow stops. The green curve in panel c) is the brightness contour in channel 1330 Å at 17:46:12 UT and is also shown in panel a). The white dashed line in panel c) shows the slit location. Panels d)−e): Si IV 1403 Å spectra in the slit range of panel c) and the profiles (solid lines) and its Gaussian fittings (dotted lines) of this line at blue and red plus positions in panel c). Panels f)−g): similar to panels d)−e), but at 17:47:24 UT. An animation of the 1330 Å and 304 Å channels shown in this figure is available.
Current usage metrics show cumulative count of Article Views (full-text article views including HTML views, PDF and ePub downloads, according to the available data) and Abstracts Views on Vision4Press platform.
Data correspond to usage on the plateform after 2015. The current usage metrics is available 48-96 hours after online publication and is updated daily on week days.
Initial download of the metrics may take a while.