Fig. 2
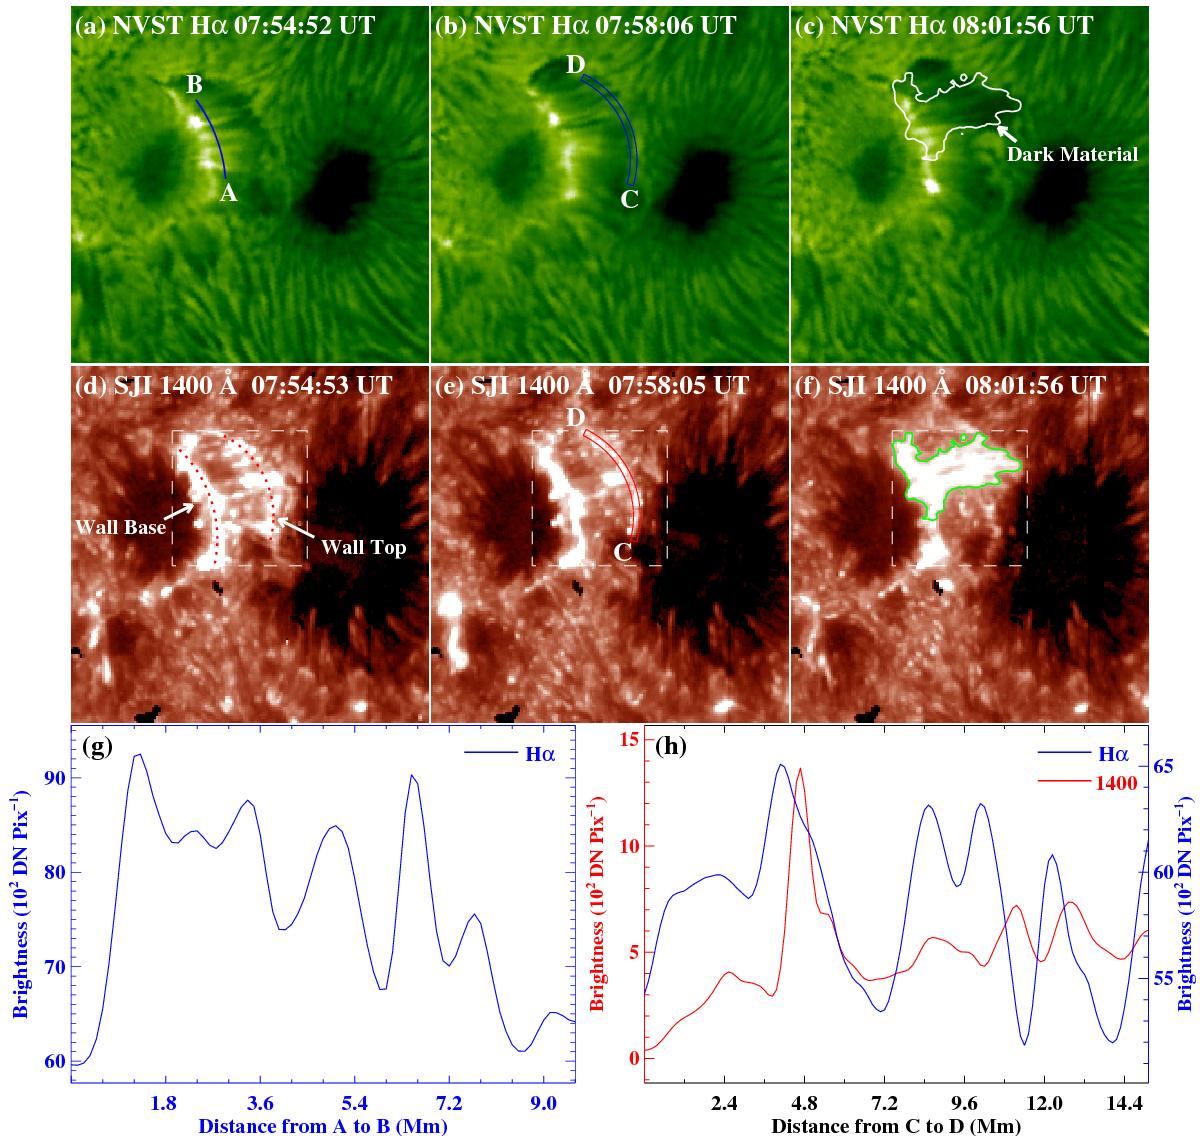
Panels a)−c): NVST Hα images displaying the light wall one hour earlier than in Fig. 1. Panels d)−f): a series of IRIS 1400 Å images showing the light wall. The green curve in panel f) is the contour of a brightening patch, and the white curve in panel c) is the duplication of the patch contour here. The light walls in white dashed windows are sharpened. Panels g): Hα brightness along curve A–B in panel a). Panels f): Hα (blue curve) and 1400 Å (red curve) brightness within the arc-sector domain C–D in panels b) and e), respectively. An animation of the 1400 Å and the Hα images is available.
Current usage metrics show cumulative count of Article Views (full-text article views including HTML views, PDF and ePub downloads, according to the available data) and Abstracts Views on Vision4Press platform.
Data correspond to usage on the plateform after 2015. The current usage metrics is available 48-96 hours after online publication and is updated daily on week days.
Initial download of the metrics may take a while.