| Issue |
A&A
Volume 589, May 2016
|
|
|---|---|---|
| Article Number | A139 | |
| Number of page(s) | 16 | |
| Section | Extragalactic astronomy | |
| DOI | https://doi.org/10.1051/0004-6361/201628137 | |
| Published online | 26 April 2016 | |
The Hydra I cluster core
I. Stellar populations in the cD galaxy NGC 3311⋆,⋆⋆
1 European Southern Observatory, Karl-Schwarzschild-Straße 2, 85748 Garching, Germany
e-mail: This email address is being protected from spambots. You need JavaScript enabled to view it.
2 Universidade de São Paulo, IAG, Departamento de Astronomia, Rua do Matão 1226, São Paulo, SP, Brazil
3 INAF, Osservatorio Astronomico di Torino, STrada Osservatorio 20, 10025 Pino Torinese, Italy
4 Departamento de Astronomia, Universidad de Concepción, Concepción, Chile
Received: 15 January 2016
Accepted: 7 March 2016
Abstract
Context. The history of the mass assembly of brightest cluster galaxies may be studied by mapping the stellar populations at large radial distances from the galaxy centre, where the dynamical times are long and preserve the chemodynamical signatures of the accretion events.
Aims. We provide extended and robust measurements of the stellar population parameters in NGC 3311, the cD galaxy at the centre of the Hydra I cluster, and out to three effective radii. We wish to characterize the processes that drove the build-up of the stellar light at all these radii.
Methods. We obtained the spectra from several regions in NGC 3311 covering an area of ~3 arcmin2 in the wavelength range 4800 ≲ λ(Å) ≲ 5800, using the FORS2 spectrograph at the Very Large Telescope in the MXU mode. We measured the equivalent widths of seven absorption-features defined in the Lick/IDS system, which were modelled by single stellar populations, to provide luminosity-weighted ages, metallicities, and alpha element abundances.
Results. The trends in the Lick indices and the distribution of the stellar population parameters indicate that the stars of NGC 3311 may be divided in two radial regimes, one within and the another beyond one effective radius, Re = 8.4 kpc, similar to the distinction between the inner galaxy and the external halo derived from the NGC 3311 velocity dispersion profile. The inner galaxy (R ≤ Re) is old (age ~14 Gyr), has negative metallicity gradients and positive alpha element gradients. The external halo is also very old, but has a negative age gradient. The metal and element abundances of the external halo both have a large scatter, indicating that stars from a variety of satellites with different masses have been accreted. The region in the extended halo associated with the off-centred envelope at 0°< PA < 90° has higher metallicity with respect to the symmetric external halo.
Conclusions. The different stellar populations in the inner galaxy and extended halo reflect the dominance of in situ stars in the former and the accreted origin for the large majority of the stars in the latter. The low value of the velocity dispersion in the inner galaxy indicates that its stars are bound to the galaxy’s gravitational potential, and the abundances and gradients suggest that the inner galaxy is formed in an outside-in scenario of merging gas-rich lumps, reminiscent of the first phase of galaxy formation. The external halo has a higher velocity dispersion, it is dynamically hotter than the galaxy and its stars are gravitationally driven by the cluster’s gravitational potential. The stars in the external halo were removed from their parent galaxies, either disks with truncated star formation, or the outer regions of early-type galaxies. Late mass accretion at large radii is now coming from the tidal stripping of stars from dwarfs and S0 galaxies. These results provide supporting evidence for the recent theoretical models of formation of massive ellipticals as a two-phase process.
Key words: galaxies: clusters: individual: Hydra I / galaxies: individual: NGC 3311 / galaxies: haloes / galaxies: evolution / galaxies: formation / galaxies: stellar content
Based on observations made with ESO Telescopes at the La Silla Paranal Observatory under programme ID 088.B-0448(B) PI Richtler.
Table 1 is only available at the CDS via anonymous ftp to cdsarc.u-strasbg.fr (130.79.128.5) or via http://cdsarc.u-strasbg.fr/viz-bin/qcat?J/A+A/589/A139
© ESO, 2016
1. Introduction
Brightest cluster galaxies (BCGs) are the giant early-type galaxies found at the core of galaxy clusters. BCGs often display extended, diffuse stellar haloes, known as cD envelopes, which are believed to be composed of stars that were stripped from satellite galaxies interacting with the cluster’s halo by tidal interactions and dynamical friction (Gallagher & Ostriker 1972; Dressler 1979). Owing to the long relaxation times at large radii, stellar haloes are not well-mixed and, therefore, preserve chemodynamical signatures of the past accretion events, which have survived to the present day and can be used to access the history of the galaxy mass assembly.
The initial processes of galaxy formation through monolithic collapse set abundance gradients, which are modified by the subsequent history of accretion over time. Initial strong metallicity gradients arise naturally in galaxies formed by the collapse of gas clouds in the monolithic scenario (Larson 1974) or by the merging of numerous gas-rich sub-galaxies (Kobayashi 2004). The occurence of major mergers is able to dilute metallicity gradients by mixing stars in the central regions of galaxies (White 1980; Kobayashi 2004), while minor mergers may form gradients at larger radii by depositing stars with different abundances (Villumsen 1983; Hirschmann et al. 2015). Observations in the last ten years, such as the population of compact massive objects at high redshift (van Dokkum et al. 2008; van der Wel et al. 2014) and the evolution of sizes and concentrations with redshift (Naab et al. 2009), suggest that massive ellipticals are formed by different processes over time in the two-phase scenario (De Lucia & Blaizot 2007; Oser et al. 2010). Galaxies are formed at high redshift (z ≳ 3) during star formation events triggered by rapid dissipative processes, such as cold accretion of gas through filaments (Kereš et al. 2005; Dekel et al. 2009) or gas-rich major mergers (Robertson et al. 2006), followed by an extended accretion of stars of smaller galaxies, usually at large galactic radii.
In the two-phase scenario, stars inhabiting a halo can be divided into two categories according to the sub-halo in which they were formed: in situ and accreted. The in situ stars were formed in the most massive sub-halo of a galaxy during the first phase of galaxy formation, which resulted in stars with relatively high metallicity, owing to their deep gravitational potential that can retain the metals ejected by supernovae (Tremonti et al. 2004), and high alpha element abundance that results from the rapid time-scales of star formation (see, e.g. Thomas et al. 2005). The accreted stars were formed in galaxies with a variety of masses and, consequently, have different abundances and ages. Spatially, in situ stars are centrally concentrated and usually dominate the light in the central ~5−10 kpc of elliptical galaxies, contributing significantly to the stellar halo out to ~30 kpc, while the accreted stars are less centrally concentrated and dominate the light in the outer regions (Oser et al. 2010; Cooper et al. 2013). From a dynamical point of view, in situ stars have experienced violent relaxation processes in the early phases of the galaxy formation, while the accreted stars may still be unrelaxed, especially at the largest radii, and thus may exhibit an inhomogeneous spatial distribution, which survived to the present day (Cooper et al. 2015).
The observational test for this model of galaxy formation relies on the measurement of stellar population parameters in early-type galaxies out to large radii, but the low surface brightness in these regions makes spectroscopic measurements difficult. Nevertheless, current state-of-the-art investigations seem in agreement with predictions from the two-phase scenario. In the case of NGC 4889 in the Coma cluster, Coccato et al. (2010b) show that there are different populations in the core and halo, consistent with the idea of accreted stars dominating the light at radii R> 18 kpc. Similarly, differences between the inner and outer stellar populations have been found for other cD galaxies such as NGC 3311 (Coccato et al. 2011), M 49 (Mihos et al. 2013), M 87 (Virgo cluster, Montes et al. 2014), and NGC 6166 (Abell 2199, Bender et al. 2015), and even in several non-BCGs (Pastorello et al. 2014). However, these studies provide limited information about the distribution of the metal abundances and ages, because they were performed either by photometry, which has good spatial information but does not provide detailed abundances and ages, or by long-slit spectroscopy, which is limited to the slit position, but provides abundance and age information in detail. Ideally we would like to be able to collect the metal abundance and age information over the entire spatial extension of the galaxy light, for an extensive mapping of its physical properties.
In this work we study the galaxy NGC 3311, the BCG of the Hydra I cluster, to provide the first bi-dimensional and large-scale view of the stellar populations of this system which, together with the detailed kinematic study (Paper II), can shed further insights into a number of specific formation scenarios that have been recently proposed for this system. NGC 3311 has a radial velocity of ~3800 km s-1 and a positive velocity dispersion profile (Ventimiglia et al. 2010), indicating that its extended halo is driven by the cluster potential at R> 8 kpc and may be composed of the debris shredded from satellite galaxies falling into the cluster’s centre (Coccato et al. 2011). Furthermore, this kind of rising velocity dispersion profile seems to be asymmetric at large radii, as observed at different position angles (Ventimiglia et al. 2010; Richtler et al. 2011). A scenario of ongoing interactions and extended build-up of the stellar mass is also supported by the presence of multiple components in the line-of-sight velocity distribution (LOSVD) of the planetary nebulae in NGC 3311 (Ventimiglia et al. 2011), of substructures and tails in the halo light distribution (Arnaboldi et al. 2012), and by the distribution of dwarf galaxies around NGC 3311 (Misgeld et al. 2008).
In the accompanying paper on the kinematics of NGC 3311 (Paper II, Hilker et al., in prep.), we focus on the kinematic properties, discuss the implications for the mass profile of NGC 3311, and explore possible formation histories of the massive star clusters observed by Misgeld et al. (2011). In the current paper, we present the spatial map of the stellar population parameters, ages, and abundances out to large radii. The article is organized as follow: in Sect. 2, we describe our data set and the methods of data reduction. In Sect. 3, we describe the measurements for the absorption features using Lick indices and, in Sect. 4, we convert this information into physical parameters of the stellar populations. In Sect. 5, we discuss the correspondence of the stellar populations with kinematic and morphological structures, which are discussed in detail in Sect. 6. In Sect. 7, we discuss our main findings in line with recent observational and theoretical works and provide an updated view of the NGC 3311 halo formation, based on recent works. Finally, we proceed to an overview and conclusion of this work in Sect. 8. We assume a distance to the core of the Hydra cluster of 50.7 Mpc, calculated by the Hubble flow, considering a radial velocity of 3777 km s-1 (Struble & Rood 1999) and H0 = 70.5 km s-1 Mpc-1 (Komatsu et al. 2009). The adopted effective radius for NGC 3311 is Re = 8.4 kpc, which is the mean value of the isophotal analysis in the V-band from Arnaboldi et al. (2012).
2. Observations and data reduction
In this study, we explore a new spectroscopic data set for the Hydra I cluster. The data were observed at the Very Large Telescope at Paranal, Chile, using the UT1 8.2 m telescope with the FOcal Reducer/low dispersion Spectrograph 2 (FORS2, Appenzeller et al. 1998) in the multi-object spectroscopic mode with the mask exchange unit (MXU), obtained under ESO programme ID 088.B-0448B (PI: Richtler).
NGC 3311 spans a large area of the sky, and thus its observation out to large galactocentric distances requires a field of view beyond the area of most integral field units available to date. To survey an area of 3 × 3 arcmin2 around NGC 3311, which translates into projected distances of ~30 kpc, we sampled regions of the stellar halo that were devoid of contamination of point sources with small slits, with a typical size of 1′′ × 5′′, using six masks that sample the stellar halo in shells: cen1, cen2, inn1 inn2, out1, and out2. We used the grism 1400V with the standard collimator to obtain a dispersion of 0.25 Å pixel-1, which gives a spectral resolution of R = 2100 at 5200 Å. The exposure times for the ceni and inni masks, which cover the central region, are 2 × 1400 s, while they are 6 × 1400 s for the outi masks. This observing strategy resulted in 135 slitlets dedicated to the observation of NGC 3311 and NGC 3309. The numbers of extracted spectra is smaller though, because we set a minimum signal-to-noise (S/N) of 10 in our observations, to constrain the stellar population parameters. A total of 118 spectra are used in our analysis. They are indicated by the red slits in Fig. 1.
The reduction processes for extracting the scientific spectra, including bias subtraction, flat fielding correction, and wavelength calibration, were performed using custom IRAF scripts. We used the long-slit spectrum of a spectrophotometric standard star, HD 102070, to test the effect of the flux calibration on the Lick indices, which are used for the analysis of the stellar populations. This test shows that the median change in the equivalent width of the indices is of 0.5% and, therefore, there is no need to flux to calibrate our spectra. The spectrum for sky subtraction of each slit was obtained simultaneously to the observations at slits in the periphery of the CCD, using the same x-axis position of the data, which ensured that science and sky spectra share the same wavelength range and exposure time for the subtraction. The wavelength range for spectra varies slightly as a function of the x-axis in the CCD, but in most cases the interval 4800 ≲ λ (Å)≲ 5800 is available. For consistency, we calculated the signal-to-noise ratio per angstrom (S/N) of each spectrum in the range 5200 ≤ λ (Å) ≤ 5500, and the distribution of the S/N is presented by the polygons in Fig. 1. In this case, and in all the maps shown in this work, we present the distribution of parameters using these polygons, which were calculated using Voronoi tessellation and the V-band contours from observations in Arnaboldi et al. (2012) to improve the visualization.
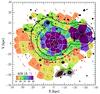 |
Fig. 1 Distribution of the signal-to-noise (S/N) of the scientific spectra in our sample. The position of the slits is shown as red bars, and the colours of the polygon, calculated by Voronoi Tessellation, indicate the S/N according to the scale in the colour bar in the bottom left corner. Slits with white background were excluded from the analysis owing to their low quality (S/N< 10). Black lines show the V-band contours in the range from 20 to 23.5 mag arcsec-2 in intervals of 0.5 mag arcsec-2, from Arnaboldi et al. (2012). The geometry of the polygons is shown hereafter in all the other maps in this study. |
3. Line strength indices
3.1. Equivalent widths of Lick indices
The stellar population properties are studied by the analysis of spectral absorption features using line-strength indices in the Lick/IDS system (Worthey 1994; Trager et al. 1998), which consists of calculating the equivalent widths (EW) of absorption features in a given central band amidst two pseudo-continuum sidebands. This process was carried out as follows:
We obtained the LOSVD for each spectrum using the pPXF code (Cappellari & Emsellem 2004) taking into account four Gauss-Hermite LOSVD moments and additive polynomials of order 12 to compensate for the variations in the continuum. The adopted templates are single stellar population (SSP) models computed with the MILES stellar library (Sánchez-Blázquez et al. 2006), with ages from 1 to 15 Gyr, metallicities in the range −0.7 ≤ [Z/H] ≤ 0.2, and computed with a Salpeter Initial Mass Function with logarithmic slope of −1.3. The template spectra from the MILES library have a resolution of FWHM = 2.5 Å, which is slightly larger than that our observations, FWHM = 2.1 Å. We then convolved our spectra with a Gaussian filter to match the resolution of the MILES stellar library. In most cases, the best fit was obtained by a linear combination of a small number of SSPs, but in a few cases a secondary nebular component was accounted for in the templates, which included emission lines for Hβ (4861 Å), NI (5200 Å), and [OIII] (4957 Å and 5007 Å at fixed ratio of 1:3), which are subtracted off the observed spectrum, if present. For the measurement of the Lick indices, we convolve our spectra to match the resolution of the Lick/IDS system, using Gaussian filters of varied resolution according to Worthey & Ottaviani (1997), before measuring the EWs using a custom Python code.
To correct for the intrinsic broadening of the absorption features, we used the ratio of the equivalent widths in the best fit from pPXF before and after the LOSVD convolution, as in Coccato et al. (2010a), using the relation 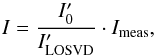 (1)where
  and
and  are the indices measured in the best fit spectra from pPXF with and without the LOSVD convolution, and Imeas and I are the measured and the corrected indices for the extracted spectra.
Finally, we also corrected the indices for the instrumental offsets by the observation of the standard star, HD 102070, for which Lick indices were determined by Schiavon (2007). Although not all indices are determined for HD 102070 in the spectral region of our data set, the relatively small value of the correction in most cases and the good agreement with previous measurements for NGC 3311 from Loubser & Sánchez-Blázquez (2012) assure us that any systematics are relatively small. Uncertainties for the Lick indices were estimated using Monte Carlo simulations with perturbations in the velocity dispersion and the addition of a bootstrapped noise, based on the residuals of the pPXF models. In Fig. 2, we show typical examples of the extracted spectrum in our data set, including the best fit and residuals calculated with pPXF and the position of the Lick indices bands. In Cols. 5 to 11 of Table 1 we show the values for the corrected Lick indices of our extracted spectra.
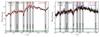 |
Fig. 2 Examples of the LOSVD fitting process with pPXF in our data set. The sky subtracted spectra (black) are superposed by the best fit templates (red) obtained by a combination of SSP spectra from the MILES library (Sánchez-Blázquez et al. 2006), emission lines, and an additive polynomial of order 12, convolved with the line-of-sight velocity distribution with four moments. The best fit emission lines (blue) are subtracted from the spectra to avoid contamination on top of the absorption features. Residuals from the fits are shown in the bottom (green dots). The Lick indices are measured at the location of the vertical shades by the measurement of the equivalent width in central bands (dark grey) compared to the level of the two pseudo continuum side bands (light grey). |
3.2. Effect of systematic errors resulting from sky subtraction
Elliptical galaxies usually present large variances in their stellar population properties at large radii, as observed in high S/N integral field observations from the SAURON survey (Kuntschner et al. 2006, 2010), and our results show similar trends. One question is whether varying S/N from the inner regions to large radii may be the primary source of scatter in the derived stellar population parameters, as function of radius. To verify whether this result is related to different S/N, we performed the following test. Since the main source of uncertainty is the sky subtraction, we performed several measurements of the Lick indices with different values of under/over sky subtraction at the level of ± 1% of the total sky in each spectrum. This percentage was obtained by a visual inspection of our spectra after the inclusion of this systematic error, which showed that errors of this magnitude would leave recognizable features that resemble the sky spectra in the 2D spectra of low signal-to-noise spectra (S/N ~ 15).
The result of this test is presented in Fig. A.1, where the difference of the EW of the indices, δILick, is plotted as a function of radius. The deviations are calculated using a running standard deviation, indicated by the grey shaded area. For a typical spectrum with S/N ~ 20, the variations of the measured EWs for the Lick indices are δHβ = 0.21 Å (12%), δFe5015 = 0.43 Å (25%), δMg b = 0.35 Å (11%), δFe5270 = 0.22 Å(18%), δFe5335 = 0.30 Å (8%), δFe5406 = 0.20 Å (10%), and δFe5709 = 0.06 Å (6%). The same test is also performed for the stellar population parameters, using the methods described in Sect. 4, resulting in changes of δlog Age (years) = 0.05 dex, δ[Z/H] = 0.48 dex, δ[α/Fe] = 0.14 dex, and δ[Fe/H] = 0.45 dex (see Fig. A.2). In the following analysis, we include the results of this test in Figs. 4 and 7, when we compare this systematic effect with the observed scatter of the Lick indices and with the scatter of the stellar population parameters respectively.
3.3. Spatial distribution and gradients of the Lick indices
The maps of the EWs for six measured Lick indices are presented in Fig. 3, including Hβ, Fe5015, Mg b, Fe5270, Fe5335, and Fe5406. The index Fe5709 is not displayed in the figure because it is measured only in a fraction of our spectra, owing to issues with the red continuum for some observational masks, but it is also used for the modelling of stellar populations whenever possible. These maps indicate that each index has a particular pattern, and that the central region of NGC 3311 stands out by having a relatively weaker Hβ absorption and stronger metal line indices than the outskirts.
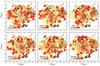 |
Fig. 3 Spatial distribution of the equivalent width of six Lick indices: Hβ, Fe5015, Mg b, Fe5270, Fe5335, and Fe5406. Black lines indicate the contours of the V-band image from Arnaboldi et al. (2012) between 20 to 23.5 mag arcsec-2 in steps of 0.5 mag arcsec-2.These maps illustrate the presence of a homogeneous inner region and a large scatter at large radii, for all indices. |
The large-scale behaviour of the Lick indices can be observed in Fig. 4, where the Lick indices are displayed as a function of the projected galactic log-radial distance from the centre of NGC 3311, in units of effective radius. The results from our measurements are shown as circles of different colours according to the S/N of the spectra. We also include a comparison with the long-slit data from the literature including Loubser et al. (2009), Coccato et al. (2011), and Loubser & Sánchez-Blázquez (2012). Our indices are not only in good agreement with the literature, but also complement the data from Loubser & Sánchez-Blázquez (2012) by extending the radial coverage.
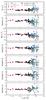 |
Fig. 4 Lick indices as a function of the distance from the centre of NGC 3311. The EWs measured for our spectra are shown by full circles, with different colours according to their S/N, as indicated in the top panel. Long-slit data from the literature is also displayed, including Coccato et al. (2011), as orange triangles, Loubser & Sánchez-Blázquez (2012) as red squares and Loubser et al. (2009) as red arrows. The two black dashed lines indicate the gradients obtained by linear regression in the two regions corresponding to the inner galaxy and the external halo. The grey shaded areas around the dashed lines represent the variance in the equivalent width generated by a systematic error in the sky subtraction by ±1%. The different gradients indicate different mechanisms for the assembly of the stellar haloes. |
As we already commented in Sect. 3.2, one important characteristic of Fig. 4 is the large scatter in the external halo. This scatter is larger than that caused by the systematic effects of over/under subtraction of the sky by ± 1%, shown in the figure by the grey shaded areas. Hence we also expect a large true scatter in the abundance and age distributions at large radii. Further evidence for the intrinsic nature of the scatter at R ~ Re and outwards is the significant variance of the stellar population parameters derived for the highest S/N spectra in the data set, shown by the dark blue circles.
Another important feature of Fig. 4 is the presence of a break in the radial gradients, from the inner to the outer profiles. This break occurs at about one effective radius (Re = 8.4 kpc), which is close to the expected transition between the in situ and accreted components according to models (e.g. Cooper et al. 2015). Therefore, to quantify the mean trends of the Lick indices, we divided them into two radial regions, the inner galaxy (R ≤ Re), and the extended halo (R>Re). In each of these regions, we measured the radial gradients using the equation  (2)where X = log (R/Re) is the logarithm of the projected galactocentric distance R, normalized by the effective radius Re, ILick(X) are the corrected Lick indices as a function of X, and ΔILick is the calculated gradient.The gradient is determined from a χ2 minimization weighted by the uncertainties of the data points. We do not remove any outliers, but we implement a geometric selection by excluding the spectra that are i) very close to NGC 3309 and ii) on top of HCC 007. The coefficients of the linear regressions are presented in Table 2 and the best fit is shown by the black dashed lines in Fig. 4.
Linear regression coefficients for the Lick indices as function of radius.
The main result of this section is summarized in Fig. 4. The distribution of the measured values for the Lick indices in the inner galaxy are different from the distribution of the values of the same indices in the external halo. The break occurs at R = Re for all indices. This implies that independent of the stellar population models that may translate the equivalent widths of the absorption features into other physically relevant quantities, there is going to be a break in the stellar population properties with different values for the inner galaxy and the external halo.
4. Stellar populations
We adopted the model from Thomas et al. (2011) to derive luminosity-weighted stellar population parameters, i.e. age, total metallicity ([Z/H]), and alpha element abundance ([α/Fe]), which are computed using a Salpeter initial stellar mass function.We also estimated the iron abundance using the relation (Thomas et al. 2003) ![Mathematical equation: \begin{equation} \mbox{[Z/H]} = \mbox{[Fe/H]} + A [\alpha/\mbox{Fe]} \label{eq:abundances} , \end{equation}](/articles/aa/full_html/2016/05/aa28137-16/aa28137-16-eq69.png) (3)considering the factor A = 0.94 (Trager et al. 2000). All those parameters will help us to understand the mass assembly history of stars in NGC 3311. The inferred ages may constrain the time since the last burst of star formation, the metallicities, are a proxy for the mass of the parent halo where these stars were formed and the alpha element abundances set constraints on the star formation time-scales (Thomas et al. 2005).
(3)considering the factor A = 0.94 (Trager et al. 2000). All those parameters will help us to understand the mass assembly history of stars in NGC 3311. The inferred ages may constrain the time since the last burst of star formation, the metallicities, are a proxy for the mass of the parent halo where these stars were formed and the alpha element abundances set constraints on the star formation time-scales (Thomas et al. 2005).
Before we describe in detail the methods to compute the stellar population parameters, we list the distinct features of this modelling approach. We assume that the SSP approximation is valid locally for each of our spectra, while we may be observing composite stellar populations (CSP). Each of the SSP parameters is sensitive to a different stellar population, which may or may not be the one dominating the stellar mass. In our discussion, we are going to use the interpretation of the stellar population parameters according to Serra & Trager (2007), which relate SSP-equivalent parameters to CSPs as follows. Ages are biased towards the age of the youngest stellar populations, even in cases where they only have a small fraction of the mass, and therefore spectra with very low ages are not considered as young, but instead old populations with a contribution of young stars. In case of element abundances, these reflect the distribution of the most massive components in the composite stellar populations and, therefore, approximately reflect the mass-weighted properties.
4.1. Determination of SSP properties using Markov Chains
We used Monte Carlo Markov chains (MCMC, Markov 1913) to obtain SSP parameters, θ = (log Age, [Fe/H], [α/Fe]) from the information contained in the set of Lick indices, D, available for each spectrum. A complete discussion of the MCMC method can be obtained elsewhere (e.g. MacKay 2003; Wall & Jenkins 2012), and here we only summarize the main concepts. The idea is to infer the posterior probability distribution of the parameters given the data, p(θ | D), using Bayes’ theorem, 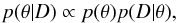 (4)where p(θ) is the prior distribution and p(D | θ) is the likelihood distribution. We assume that the priors are uniform within the ranges of the models from Thomas et al. (2011), extrapolated in metallicity, 0.1 ≤ Age(Gyr) ≤ 15, −2.25 ≤ [Z/H] ≤ 0.90 and −0.3 ≤ [α/Fe] ≤ 0.5, and that the likelihood distributions are Gaussian functions with standard deviations equal to the uncertainties of the measurements of the Lick indices. The calculations of the samples were performed with the PyMC package (Patil et al. 2010) using the Metropolis-Hastings algorithm with SSP models linearly interpolated for sub-grid resolution.
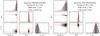 |
Fig. 5 Examples of the posterior distributions for two spectra using the MCMC method. The panels in the main diagonal show histograms of the marginalized distributions, which are used to determine the representative values and their uncertainties. The thick red lines show the best fit to the posterior samples, either a Gaussian or a generalized extreme value function. Projections of the posterior distributions in the lower left panels show the correlations among parameters. The histograms in the upper right corner of each panel indicate the maximum probabilities and the 1σ deviations of the stellar population parameters in each case. |
Figure 5 illustrates the posterior distribution in two cases. The panels in the lower left show projections of the parameter space, which indicate that parameters are not independent of each other. In particular, a small age-metallicity degeneracy is present (Worthey 1994). However, the relevant statistics are obtained by the marginalization of the parameters, indicated by the histograms, which already take these effects into account. For symmetric posterior distributions, such as the metallicities in both examples of Fig. 5, we fit a simple Gaussian to obtain the mode and the standard deviation. However, in several cases the distributions are skewed towards the limits of the models, such as the ages in Fig. 5, which required a fit of a generalized extreme value (GEV) function. In these cases, we used the mode as the relevant statistic, and the uncertainties are calculated by determining two iso-probability values encompassing the maximum probabilities for which the posterior distribution integrals add up to 68% of the area under the curve, similar to the 1σ deviations of a Gaussian distribution.
The results of this analysis are presented in Cols. 12 to 14 of Table 1. In low S/N regimes, the posterior distributions become flat owing to the larger uncertainties in the Lick indices. To avoid such unconstrained parameters in the analysis, we set a maximum limit of 0.2, 0.7, 0.2, and 0.8 dex in the uncertainties of log (Age), [α/Fe], [Z/H], and [Fe/H], respectively.
4.2. Spatial distribution and gradients of SSP parameters
In Fig. 6, we present the spatial distribution of the four stellar population parameters, i.e. log (Age), [Z/H], [α/Fe], and [Fe/H]. As observed in the distribution of Lick indices, the large scale distribution of the stellar populations is scattered, predominantly in the outer regions, while the inner galaxy displays a more regular behaviour. The central region shows rather old ages and super solar abundances. The external halo is much more diverse, presenting some large scale structures uncorrelated to the isophotes. However, considering the low spatial resolution of our observations, the relatively small S/N in several of these spectra, and the expected spread in stellar populations, we consider that most of the apparent structures may be explained by random fluctuations.
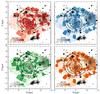 |
Fig. 6 Maps of the modelled luminosity-weighted stellar population properties: ages (top left), total metallicity (top right), alpha-element abundance (bottom left), and iron abundance (bottom right). Black lines display the V-band surface brightness contours from Arnaboldi et al. (2012) in the range from 20 to 23.5 in steps of 0.5 mag arcsec-2. Colours indicate the SSP equivalent parameters according to the colour bars in the bottom left section of each panel. The inner galaxy (R< ~ 10 kpc) is characterized by homogenous old age, high metallicity, and super solar [α/Fe]; the outer halo shows a more complex behaviour; see extended discussion in Sect. 6. |
To describe the large-scale distribution, we again refer to the analysis of the radial trends and their gradients. In Fig. 7, we plot the stellar population parameter values determined from this work: in circles with different colours according to their S/N, as function of both the radial distance from the centre of NGC 3311, and also as a function of the V-band surface brightness at the location of the slits (left and central panels, respectively). We also show the stellar population parameters derived from the observations of Loubser & Sánchez-Blázquez (2012) and Thomas et al. (2011), as squares and triangles respectively, calculated from their published values of the Lick indices, using our MCMC approach for consistency. We also show the central stellar population parameters from Loubser et al. (2009) using a arrow indicating the published value in their paper.
There is considerable scatter in the external halo properties, similarly to that of the Lick indices plotted in Fig. 4. Once more, we compare this scatter with the systematic effect of an incorrect sky subtraction by ± 1%, as displayed by the grey shaded areas. The comparison shows that the observed scatter is larger than that caused by a systematic effect in the sky subtraction of ± 1%. To reproduce a scatter similar to the one measured in the external halo, an error of ~6% is necessary, which is much larger than any of the residuals in our extracted spectra. Therefore, we have evidence that the scatter at large radii is an intrinsic property of the external stellar halo.
Similarly to the method deployed for the Lick indices, we quantify the radial trends in the stellar population properties using gradients which are computed separately for the inner galaxy and the external halo. The separation between these two regions is set at the projected distance of 1Re from the centre, which is approximately represented by the isophotal surface brightness level of μv ≈ 22.2 mag arcsec-2. We used Eq. (2)to parametrize the gradients; this time we used two parameters for the abscissa, X = { log (R/Re),μv }. For this calculation of the gradients, we excluded the slits around NGC 3309 and the three slits covering the dwarf galaxy HCC 007 at the south of NGC 3311 to avoid contamination. We note that the stellar population gradients as a function of the radius from the centre of NGC 3311 is our primary diagnostic to characterize the global variations in stellar population parameters and, as such, this is discussed in detail below. We expect the gradients as function of the local surface brightness values to be affected by the presence of substructures, as is the case for the external halo of NGC 3311 (see Arnaboldi et al. 2012), and hence have a larger scatter than radial gradients.
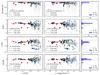 |
Fig. 7 Gradients of the stellar population parameters. Left: ages, [Z/H], [α/Fe], and [Fe/H] as function of the log-distance to the centre of NGC 3311. Circles indicate data points from this work, coloured according to their S/N as dark blue (S/N> 30), light blue (15 ≤ S/N ≤ 30) and white (S/N< 15). Data from Loubser et al. (2009) and Coccato et al. (2011) are shown by red arrow and orange triangles, respectively. New calculated values for the stellar population parameters based on data from Loubser & Sánchez-Blázquez (2012) are indicated by red squares. Dot-dashed and dashed lines indicate the regression for the inner and external halo, respectively, with the gradients displayed in the bottom left of each panel. The grey shades represent the systematic error of under/over subtraction of the sky by 1%. Centre: same as for the left panels, but with gradients measured as a function of the V-band surface brightness. Right: histograms of the distribution of the stellar population parameters, combining our data with those of Loubser & Sánchez-Blázquez (2012), with the inner galaxy and external halo shown in blue and grey bins, respectively. The gradients in the inner galaxy are consistent with the predictions from a quasi-monolithic collapse model, while the shallow azimuthally-averaged gradients and the large scatter in the outer halo are consistent with the results of accreted stars from a variety of different progenitors. |
Linear regression coefficients for the fitting of the stellar population parameters.
5. Correspondence among stellar populations, surface brightness components, and kinematical structures in the inner galaxy and external halo of NGC 3311
The presence of a break in the measured Lick indices and the clearly distinct distribution of the stellar population parameters for the inner galaxy (R<Re) and the external halo point towards different formation channels for the stars in these two regions. We derive consistent values for the ages, the total metallicity, and gradients in [α/Fe] and [Fe/H], with very small scatter for the inner galaxy. The distribution of values derived for the external halo have a very large scatter in comparison. The findings for the inner galaxy are consistent with the expectations from the in situ formation, which maintains gradients from the time of initial rapid star formation. Conversely, the larger scatter of the values in the external halo suggests that these stars come from the debris of gravitationally disrupted galaxies, as suggested by the classical model (Dressler 1979) for the formation of cD haloes. Thus the breaks at 1Re are interpreted as transition from the in situ to the accreted stellar populations, and are observed in other giant ellipticals from the MASSIVE survey (Greene et al. 2013, 2015).
In NGC 3311, this type of break in the stellar properties of the inner galaxy and the external halo correlates with variations in the velocity dispersion profile. Within one Re, stars move under the influence of the galaxy mass, reaching a σ0 ≈ 160 km s-1 at the centre. At one Re and slightly larger radii, the line-of-sight (LOS) velocity dispersion has a positive gradient reaching σ(R) ≈ 400 km s-1 at 30 kpc (Ventimiglia et al. 2010; Richtler et al. 2011; Paper II). This increase in σ(R) with radius indicates that the stars are progressively driven by the massive external halo associated with the Hydra I cluster, as mapped by the hot X-ray emission (Hayakawa et al. 2004).
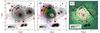 |
Fig. 8 Evidence of a large-scale component in the external halo of NGC 3311. A), B) V-band image and residual from the Sérsic n = 10 model from Arnaboldi et al. (2012) illustrate the presence of an off-centred envelope. C) X-rays image from Hayakawa et al. (2006) indicates an excess emission at the same position of the off-centred envelope. Red circles indicate the position of dwarf galaxies from the catalogue of Misgeld et al. (2008). |
We now discuss the properties of the external halo of NGC 3311, defined as the region R>Re. This halo is not homogeneous and the presence of additional components can be physically motivated. Using deep V-band imaging, Arnaboldi et al. (2012) show that the light of NGC 3311 is described primarily by a single Sérsic function with index n ≈ 10 at all radii. No break or no photometric signature of the two-component structure is expected in a cD galaxy: the cluster dominated halo is not obvious in the photometry. This Sérsic n = 10 component centred on NGC 3311 fits most of the light in all directions and is responsible for the featureless appearance observed in Panel A of Fig. 8. However, once the symmetric main component is subtracted, Arnaboldi et al. (2012) detected an additional feature in the galaxy light, the off-centred envelope, which is located at a projected distance of 18 kpc from the centre of NGC 3311, towards the north-east direction (panel B of Fig. 8). At the location of the off-centred envelope, there is an excess emission in X-rays (Hayakawa et al. 2004, 2006, see panel C) and a group of dwarf galaxies are found around this position with high relative LOS velocities of ~1000 km s-1 (Misgeld et al. 2008), compared to the systemic velocity of the Hydra I cluster. At the optical wavelengths, the off-centred envelope is fainter than the symmetric main halo, contributing up to ≈30% of the light (Coccato et al. 2011; Arnaboldi et al. 2012).
The off-centred envelope is also associated with kinematical signatures. Ventimiglia et al. (2011) show that the LOSVD of planetary nebulae in the cluster core around NGC 3311 halo is multi-peaked, with three distinct components: a broad asymmetric component with velocities of ~3100 km s-1, a blue-shifted north-south elongated component at ~1800 km s-1, and a red-shifted component at ~5000 km s-1, at the location of the off-centred envelope. Furthermore Arnaboldi et al. (2012) show that asymmetric features in the velocity dispersion and the LOS velocity profiles correlate with the spatial location of the off-centred envelope. That is, at the location of the envelope, the LOSVs are redshifted with respect to the centre of NGC 3311 and the velocity dispersion is larger than at the symmetric location in the external halo, opposite the galaxy centre. These features can be explained by the superposition along the LOS of two distinct structural components, the Sérsic n = 10 halo and the off-centred envelope, with different LOSVs by ≥50 kms-1.
Therefore, the external halo properties may be associated with two structural components: the “symmetric” Sérsic n = 10 halo, which is found at all azimuthal angles, and the off-centred envelope in the north-east quadrant. The exact boundaries of these components are not well defined, hence we adopt a simple scheme to seek out their signatures in the distribution of the parameters for the stellar populations. The properties of the stellar population in the symmetric external halo are derived for R>Re and 90° ≤ PA ≤ 360°, while the population of the off-centred halo is studied in the quadrant at 0°< PA < 90°. As the symmetric halo contributes 70% or even larger amounts to the light at the location of the off-centred envelope, we would expect to only detect small variations in the distributions of the stellar population parameters at the location of the off-centred envelope, compared to the symmetric halo distribution.
6. Properties of the stellar populations of the stellar light in NGC 3311
6.1. Stellar populations in the inner galaxy
The stellar population properties of the inner galaxy (R ≲ Re) have well-constrained values as indicated by the blue histograms on the right side of Fig. 7. The radial linear gradients of the stellar parameters are minor. There are three deviating data points: one at the position of the dust lane in the central kpc of NGC 3311 (Arnaboldi et al. 2012), and two in other regions further out, see Loubser et al. (2009) and Loubser & Sánchez-Blázquez (2012).
The stars of the inner galaxy are old, compatible with the oldest modelled stellar populations (15 Gyr), with no gradient in age. The total metallicity of the stars is super solar, with a mild gradient of −0.23 ± 0.18 dex dex-1, while the alpha element abundance is high at the centre, [α/Fe] ≈ 0.2 dex, with a positive gradient of 0.18 ± 0.06 dex dex-1. The resulting iron abundance is close to solar, with a gradient of −0.16 ± 0.08 dex dex-1.
The very old age of NGC 3311 is expected for BCGs. Oliva-Altamirano et al. (2015) observe that one-third of their BCG sample has similarly old stellar populations (age > 12 Gyr), while Loubser et al. (2009) find that about 50% of the BCGs have central old stellar populations. The flat age gradient and the abundance gradients are consistent with the values observed in BCGs by Oliva-Altamirano et al. (2015).
6.2. Stellar populations in the external halo
The properties of the outer stellar halo of NGC 3311 are considerably different from those inferred for the inner galaxy, as shown in Fig. 7, left and central panels at R ≳ Re and μv ≳ 22.2 mag arcsec-2. We detect a shallow age gradient of Δlog Age = −0.02 ± 0.02 dex dex-1 in the external halo, which is compatible with the flat gradient in the inner galaxy. The total metallicity gradient is steeper than that of the inner galaxy, with Δ [Z/H] = −0.46 ± 0.39 dex dex-1, and an inversion of the radial trends is observed in the alpha element abundance, with Δ [α/Fe] = −0.20 ± 0.22 dex dex-1, and in the abundance of iron, with Δ [Fe/H] = 0.14 ± 0.43 dex dex-1.
In addition to the average radial trends, the clear feature of the outer stellar halo of NGC 3311 is the considerable larger scatter of the stellar population parameters. The histograms on the right side of Fig. 7 show the distribution of stellar population properties for the inner galaxy (blue) and outer stellar halo (grey). The large scatter is present for the SSP parameters of high S/N (≥40) spectra and at a radius of R ~ 0.6Re = 5.3 kpc, as indicated by the dark blue circles in the radial plots for [Z/H], [α/Fe], and [Fe/H] in Fig. 7. Moreover, the width of the distribution of the stellar population parameters is larger than expected from a systematic error in the sky subtraction of ±1%, as indicated by the grey shaded areas shown around the mean gradients.
In the histograms on the right side of Fig. 7, the positions of the mean peak of the distributions and their widths are different in the inner galaxy and external halo. A common characteristic of these distributions is that their widths for the external halo are twice as large as those for the inner galaxy. In the case of the [Z/H] and [α/Fe] distributions, there are multiple peaks for the external halo. Therefore, contrary to the inner galaxy, which can be explained by a rapid process of collapse and merger of gas-rich lumps, the outer stellar halo was most likely built up by an accretion of stars from a variety of progenitors, with different masses and star formation histories.
We now investigate whether there are differences in the stellar population parameters between the off-centred envelope and the rest of the external halo of NGC 3311. Figure 9 shows the distribution of the stellar population parameters for the off-centred envelope (red) and the rest of the external halo (grey). To determine the number of peaks that are statistically significant in each case, we used Gaussian mixture models (GMM) to estimate the number of populations which minimize the Bayesian information criteria (BIC), results of which are summarized in Table 5. The [α/Fe] distributions for the off-centred envelope and symmetric halo are those for which two components are statistically favoured with respect to the single peak distribution. The distributions for the ages and metallicities can be relatively well described by single Gaussian functions instead. The GMM models are shown in Fig. 9 by dashed lines, with arrows indicating the position of the peak for each component.
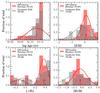 |
Fig. 9 Distribution of stellar population parameters of the off-centred envelope (red) and the symmetric halo (grey). The histograms are normalized and the number of spectra (N) used in each case is shown in the legend of each panel. Dashed lines indicate the components of the GMM analysis, while the arrows indicate the position of the peak of each component. The off-centred envelope is responsible for a significant shift of the metallicity where it is located, while ages and alpha-element abundance distributions are similar to those inferred for the symmetric halo. |
Properties of the Gaussian mixture models with lowest Bayesian information criteria for the off-centred envelope and the symmetric halo.
We used the Kolmogorov-Smirnov (KS) test to statistically compare the distributions of the stellar population parameters for the off-centred envelope and the symmetric halo. The result of the KS tests indicates that the age and the alpha element abundances of these two components may have been drawn from the same parent distribution, with probabilities of 78 and 32% respectively. In both components, stars are predominantly old with ages of ~14 Gyr, which is compatible with the oldest stellar populations in the models of Thomas et al. (2011). This old age distribution extends the results from Coccato et al. (2011) to the entire halo and is also supported by the lack of features in the UV emission from GALEX observations (Gil de Paz et al. 2007). The age is the only external halo property for which the gradient is representative of the vast majority of the observed data points.
The distribution of alpha element abundance in the symmetric halo and in the off-centred envelope show similar multi-modal distributions, modelled as a mixture of two Gaussian components. The main contribution to the alpha element abundance are stars with [α/Fe] ≈ 0.4 dex and spread of 0.1 dex, observed in 64% of cases, while the secondary population has an abundance of [α/Fe] ≈−0.1 dex and a spread of 0.15 dex. The explanation for almost identical alpha element abundance at the off-centred envelope and in the symmetric halo is that this property is robust against a contamination of a minor component in the total integrated light, as indicated by the simulations of Coccato et al. (2011). Comparing the SSP parameters of a superposition of a typical, alpha-enhanced symmetric halo spectrum ([Z/H] =−0.34 dex, [α/Fe] = 0.50 dex) with the properties of the dwarf galaxy HCC 026 ([Z/H] =−0.85 dex, [α/Fe] = 0.03 dex), they noticed that 35% of the light is necessary to decrease the element abundance by only 0.05 dex. There may be specific regions in the off-centred envelope where this amount may be slightly larger, especially in those regions with the largest velocity dispersion observed in Paper II but, considering the total light, the fraction of light at the substructure should not exceed 30%, confirming the findings of Coccato et al. (2011), and in agreement with the estimates of Arnaboldi et al. (2012).
In contrast to the age and [α/Fe] distributions, the total metallicity and the iron abundance distributions do differ between the off-centred envelope and the symmetric halo. The probability that these distributions are drawn from the same parent distributions are low, i.e. ~1% and ~3%, respectively. The total metallicity distribution of the off-centred envelope is most discrepant. The difference is clearly shown in Fig. 9: the metallicity distribution of the stellar populations at the location of the off-set envelope is a single peaked distribution centred at [Z/H] = 0.1 dex and width of 0.33 dex, while the metallicity of the symmetric halo is a much broader distribution, with mean value [Z/H] = −0.24 dex and width of 0.64 dex. The stars in the quadrant where the off-centred envelope is located have higher metallicities than most of the stars at the same radii, except for the stars sampled by spectra extracted in proximity of the giant companion, NGC 3309. A similar result holds for the iron abundance with the symmetric halo, which has [Fe/H] = −0.38 dex and dispersion of 0.68 dex, while the mean abundances of the off-centred envelope is [Fe/H] = −0.12 dex, with a dispersion of 0.41 dex. Since the light at the location of the off-centred envelope is given by the superposition of this component and the symmetric halo, the intrinsic metallicity of the stars in the envelope may be significantly higher than solar.
Our derived stellar population parameters for the external halo of NGC 3311 are compatible with previous results from Coccato et al. (2011), and are similar to the stellar populations of other cD galaxy haloes, such as NGC 4889 in the Coma cluster (Coccato et al. 2010b) and NGC 6166 in the Abell 2199 cluster (Bender et al. 2015). These physical properties are also similar to those inferred for the stellar populations in other BCGs (Spolaor et al. 2008) and massive early-type galaxies (Spolaor et al. 2010; Greene et al. 2012, 2013, 2015).
7. Implications for the assembly history of NGC 3311
Recent cosmological models for the formation of large early-type galaxies predict that the majority of stars in external haloes originated from satellite galaxies in the so-called two-phase scenario (e.g. De Lucia & Blaizot 2007; Naab et al. 2009; Oser et al. 2010; Cooper et al. 2013). In the following sections, we compare our results with recent modelling of BCGs to relate the inferred distributions of the stellar population parameters with the physical mechanisms involved in the formation of extended haloes of BCGs in clusters.
7.1. The inner galaxy
As presented in previous sections, the distribution and the distinct radial gradients of the age, [Z/H], [Fe/H], and [α/Fe] of stellar populations in the inner galaxy are consistent with stars born in situ. According to the models of Cooper et al. (2013), the large number of in situ stars in the central regions of BCGs are expected to occur up to a stellar mass threshold of M200 ≲ 1013M⊙ since, for more massive galaxies, the accreted stars become increasingly dominant even in their innermost regions (Cooper et al. 2015). NGC 3311 is very close to this boundary, with M200 ≈ 0.63M500 = 6.3 × 10¹³M⊙ (Piffaretti et al. 2011), and our determination of the stellar population parameters shows the presence of in situ and accreted stars in two radial regions, and thus in agreement with the predictions of Cooper et al. (2013).
We can also compare our results with those for other massive early-type galaxies. The total metallicity gradient of the inner galaxy in NGC 3311, Δ [Z/H] = −0.23 ± 0.18 dex dex-1, is comparable to the gradients of other BCG galaxies (Oliva-Altamirano et al. 2015) and non-BCGs (Kuntschner et al. 2010). Positive [α/Fe] gradients are also common among early-type galaxies (Kuntschner et al. 2010) and BCGs (Brough et al. 2007) and, therefore, the mechanisms that set the gradients in BCGs must be similar to those that form ordinary early-type galaxies. In a simple, quasi-monolithic scenario, such gradients can be explained in an outside-in scenario (e.g. Pipino et al. 2006, 2008, 2010). In this context, early-type galaxies are formed by the merging of gas-rich lumps, which produces an intense star formation, but with a differential rate at different radii. Star formation in the outer regions around 1Re is characterized by short time-scales and strong stellar winds that deplete the iron efficiently, whereas star formation is the core is prolonged and metals, in particular iron, are kept owing to the strong gravitational potential. This produces positive alpha element gradients and negative total metallicity gradients. The abundance gradients of the inner galaxy of NGC 3311 are compatible with the results of these models, considering a few episodes of dry mergers (Pipino et al. 2010).
7.2. The extended symmetric halo
With reference to the main peak of the alpha element abundance distribution, see Fig. 9, the extended halo can be described as a mix of old stars with metallicities of [Z/H] ≈ −0.25 and [α/Fe] ≈ 0.4, at first order. As discussed earlier, the high value for the α abundance does not imply that all stars were formed in galaxies with high [α/Fe], since this quantity does not change a lot by the contamination of less alpha-enhanced stars. Nevertheless, the majority of stars in the external halo may indeed have high [α/Fe]. In the nearby universe, high [α/Fe] stars are those:
-
1.
Stars that are produced in disky galaxies with truncated starformation. Greeneet al. (2012, 2013)show that the metallicity and the alpha element abundance at theoutskirts of massive galaxies are similar to those found in theMilk-Way thick disk, which is predicted to have been formed inshort time-scales (Chiappiniet al. 1997). These disks could havebeen destroyed in interactions and mergers very early on, sincegalaxy encounters at high redshift were much more common thanin the present day universe.
-
2.
Stars from galaxies in compact groups. De la Rosa et al. (2007) have found that galaxies with σ0 ≲ 160 km s-1 in Hickson Compact Groups have larger [Mg/Fe] and lower [Z/H] compared to field galaxies of similar masses, and proposed that such galaxies may have their otherwise extended star formation quenched by mergers.
-
3.
Stars on the outskirts of massive early-type galaxies with declining metallicity gradients and flat-to-positive alpha element gradients (Coccato et al. 2011). Negative metallicity gradients extending to the outer radii are found in most early-type galaxies (e.g. Baes et al. 2007; La Barbera et al. 2012). Flat and positive [α/Fe] gradients are commonly found in early-type galaxies at small radii (Kuntschner et al. 2010), and there is evidence that, at least, metallicity gradients extend to larger radii (La Barbera et al. 2012; Pastorello et al. 2014). In other nearby clusters, such as Virgo and Fornax, declining metallicity gradients and flat alpha element abundances are found in almost all cases (Spolaor et al. 2010), but there is no such information for the giant ellipticals in the Hydra I cluster. If these have similar gradients, the central stellar populations of the Hydra I ellipticals should exhibit high [Z/H] and [α/Fe], similar to those found in the extended halo of NGC 3311 (Coccato et al. 2011).
All of the above galaxies could have provided stars that have now been found to have contributed most of the light of the symmetric external halo. They do not exclude each other necessarily, since they could have been different parts of the same process in a hierarchical scenario. More importantly, however, is that the high [α/Fe] indicates star formation that is happening on short time-scales of ≈0.1 Gyr, according to the approximation of Thomas et al. (2005). We can also estimate the most likely masses of the progenitors of the stars in the external halo from the metallicity distribution in Fig. 9. Translating these metallicities into stellar masses according to the relations from Gallazzi et al. (2005), the typical galaxies contributing to the formation of the extended symmetric halo are Milky Way-like galaxies, including mostly galaxies in the range ~1010M⊙ to ~1012M⊙.
The extrapolation of the inner galaxy gradient in [α/Fe] matches the position of the dominant alpha element abundance in the external halo, indicating that these stars may have similar origins. Cosmological hydrodynamical simulations from Murante et al. (2007) indeed indicate that most of the diffuse halo is composed of stars that were liberated from the most massive galaxies in episodes of major mergers that were related to the formation of the cD galaxy, where tidal shocking and stripping of massive galaxies are able to unbound up to 30% of their stellar mass. In agreement with several predictions from the models of Murante et al. (2007), the semi-analytical models of Contini et al. (2014), including disruption of galaxies and tidal interactions, are able to reproduce both the typical masses of the progenitors in our observations, as well as the typical total metallicities. Therefore, our observations are in agreement with models in which the assembly of the BCG is directly connected with the formation of the diffuse halo.
The [α/Fe] distribution of the symmetric halo indicates the presence of a secondary population, with solar and sub-solar α-abundances. These lower alpha element abundances suggest a much more extended star formation, i.e. ~15 Gyr, according to the approximation of Thomas et al. (2005). In this case, there is already one galaxy in the Hydra I cluster that has similar properties, the dwarf galaxy HCC 026. This dwarf galaxy has solar alpha-abundance, [α/ Fe] = −0.03 ± 0.05 dex, and low metallicity, [Z/H] = −0.85 ± 0.03 (Coccato et al. 2011). HCC 026 is part of a group of dwarf galaxies in the same location of the off-centred envelope (Misgeld et al. 2008) and it has strong tidal tails that indicate that this galaxy is being disrupted by the tidal field close to the cluster centre (Arnaboldi et al. 2012). Hence HCC 026 is the typical object that contributes to the late accretion events that build-up the halo today.
These types of solar and sub-solar α abundance populations are inferred from a substantial fraction of the extracted spectra in about 40% of the total sample in the external halo. Hence the accretion of stars from disrupted dwarfs or irregular galaxies is an important channel for the late build-up of the external halo. Very recent observations of the planetary nebulae in the halo of M 87 and the intracluster light in the Virgo core show that the contribution from Magellanic cloud-like irregular galaxies is responsible for a sizeable fraction of the halo light being added in the last Gyr to the M 87 halo and ICL (Longobardi et al. 2015a,b). Models from Murante et al. (2007) indicate that low-mass galaxies (M∗< 1010M⊙) may contribute to the formation of the diffuse halo, but numerical issues related to the particle resolution of low-mass galaxies did not allow them to set proper constraints on this secondary population.
Our current results for NGC 3311 and the recent findings for M 87 indicate that it is important to study the details of the late mass accretion, which is responsible for a sizeable amount of the chemical composition and kinematics of the haloes of massive nearby galaxies.
7.3. The metallicity distribution of the off-centred envelope
The stellar populations located at the off-centred envelope show an enhancement of metals in comparison with the rest of the symmetric halo, while the alpha element abundance and age distributions are similar. The strongly peaked metallicity distribution centred around [Z/H] ≈ 0.1 indicates that the stars associated with the substructure were formed in massive galaxies. According to Murante et al. (2007), massive ellipticals can lose up to 30% of their stars during their merging events with the cD, and these stars then contribute to the build-up of the external halo. The question then is, how this external high metallicity halo component acquired an offset and became off-centred with respect to the high surface brightness, highly concentrated inner galaxy.
Off-centred outer components in BGCs are quite frequent: from a sample of 24 clusters, Gonzalez et al. (2005) show that a two-component fit to the light profiles of BCGs provides an improved match to the data and that the two photometric components are misaligned in 60% of the sample. In the Gonzalez et al. (2005) sample, the cluster Abell 1651 has a cD galaxy where the two components have different centres, with the outer component being off-centred by 15 kpc linear distance in projection, i.e. very similar to what is observed for NGC 3311. As observed in cosmological simulations (e.g. Murante et al. 2007), the highly radial orbits of the dark haloes of massive ellipticals and their tidal interaction with the cD dark halo may cause a deflection of the central part of the cD from its dark halo, while the outer envelopes maintain their orbital directions, thus creating an offset between core and halo in the cD galaxy. Candidate dark haloes responsible for a tidal interaction with NGC 3311 are the dark halo associated with the group of infalling dwarfs or the dark halo associated with NGC 3309. These tidal interactions would then be similar to what is observed in the Coma cluster core (Gerhard et al. 2007). Such mechanisms may also explain the gas stripping of NGC 3311, as observed in the X-rays (Hayakawa et al. 2004, 2006), since the mass of the gas is compatible with the mass of NGC 3311.
8. Summary and conclusions
We performed a spatially extended survey of the stellar populations in NGC 3311, the brightest galaxy of the Hydra I cluster. By analysing the absorption line equivalent widths using a Bayesian framework with Monte Carlo Markov Chains, we probed luminosity-weighted parameters, i.e. age, [Z/H], [α/Fe], and [Fe/H] out to ~3Re. This enabled the characterization of the stellar content of three physically motivated components of this system: the inner galaxy, the symmetric external halo, and the off-centred envelope.
The inner stellar halo (R<Re) presents stellar populations typical of massive early-type galaxies, including old ages, high metallicities, and high alpha-element abundances. Similar to other BCGs, the inner galaxy has a well-defined negative metallicity and a positive alpha element abundance gradient which can be explained by a quasi-monolithic scenario involving a few dry mergers. These gradients, and the smaller velocity dispersion of the inner galaxy, are clear indications that the stars in this region were formed in situ in the early phases of galaxy formation.
The stellar component of the outer symmetric stellar halo is characterized by a large spread of the stellar parameter values rather than by clearly defined radial gradients. This region is also characterized by high velocity dispersions which are indicative of these stars being driven by the cluster’s potential and being generated by accumulation of tidal debris. While the mean value of the metallicity distribution in this region indicates sub-solar abundances, the [α/Fe] distribution of the symmetric halo is bimodal, with high (~0.4) and low (~0) components. The majority of stars in the symmetric halo are generated in galaxies with a rapid star formation and short time-scales, in agreement models for the formation of cD envelopes (e.g. Murante et al. 2004, 2007; Contini et al. 2014). However, a substantial number of stars, about 40%, have a low [α/Fe] value, which indicates that stars from less massive galaxies have also also been added to the cD halo. Their association with dwarf galaxies that are currently being disrupted at the position of the off-set envelope indicates that the growth of the cD halo is an ongoing process, which is fed by late mass accretion.
Finally, the stellar populations at the position of the off-centred envelope, a substructure also observed in photometry, X-rays and kinematics, indicates that the dark matter halo of an infalling group may have interacted with the BCG halo, causing the stripping of gas and stars.
We conclude that massive satellite galaxies in the vicinity of NGC 3311 merged with the central cD in early times and formed its symmetric outer halo, while the build-up process of the extended halo is still ongoing, as indicated by the presence of an infalling group of dwarfs that are currently adding their stars to the halo. Tidal interactions between the dark haloes of the infalling group, of NGC 3309, and NGC 3311 may be responsible for the stripping of stars and gas in the halo of NGC 3311. Although very challenging from an observational point of view, the haloes of cD galaxies provide important constraints on the formation and morphological transformation of galaxies in nearby clusters.
Acknowledgments
We would like to thank Dr. Ilani Loubser for kindly sharing data from the inner regions of NGC 3311. We would like to thank the referee for his/her constructive comments. This research has made use of the NASA/IPAC Extragalactic Database (NED) which is operated by the Jet Propulsion Laboratory, California Institute of Technology, under contract with the National Aeronautics and Space Administration. CEB and CMdO are grateful to the São Paulo Research Foundation (FAPESP) funding (Procs. 2011/21325-0, 2012/22676-3 and 2014/07684-5). T.R. acknowledges financial support from FONDECYT project No. 1100620, and from the BASAL Centro de Astrofísica y Tecnologias Afines (CATA) PFB-06/2007. T.R. also thanks ESO/Garching for a visitorship.
References
- Appenzeller, I., Fricke, K., Fürtig, W., et al. 1998, The Messenger, 94, 1 [NASA ADS] [Google Scholar]
- Arnaboldi, M., Ventimiglia, G., Iodice, E., Gerhard, O., & Coccato, L. 2012, A&A, 545, A37 [NASA ADS] [CrossRef] [EDP Sciences] [Google Scholar]
- Baes, M., Sil’chenko, O. K., Moiseev, A. V., & Manakova, E. A. 2007, A&A, 467, 991 [NASA ADS] [CrossRef] [EDP Sciences] [Google Scholar]
- Bender, R., Kormendy, J., Cornell, M. E., & Fisher, D. B. 2015, ApJ, 807, 56 [NASA ADS] [CrossRef] [Google Scholar]
- Brough, S., Proctor, R., Forbes, D. A., et al. 2007, MNRAS, 378, 1507 [NASA ADS] [CrossRef] [Google Scholar]
- Cappellari, M., & Emsellem, E. 2004, PASP, 116, 138 [NASA ADS] [CrossRef] [Google Scholar]
- Chiappini, C., Matteucci, F., & Gratton, R. 1997, ApJ, 477, 765 [NASA ADS] [CrossRef] [Google Scholar]
- Coccato, L., Arnaboldi, M., Gerhard, O., et al. 2010a, A&A, 519, A95 [NASA ADS] [CrossRef] [EDP Sciences] [Google Scholar]
- Coccato, L., Gerhard, O., & Arnaboldi, M. 2010b, MNRAS, 407, L26 [NASA ADS] [Google Scholar]
- Coccato, L., Gerhard, O., Arnaboldi, M., & Ventimiglia, G. 2011, A&A, 533, A138 [NASA ADS] [CrossRef] [EDP Sciences] [Google Scholar]
- Contini, E., De Lucia, G., Villalobos, Á., & Borgani, S. 2014, MNRAS, 437, 3787 [NASA ADS] [CrossRef] [EDP Sciences] [Google Scholar]
- Cooper, A. P., D’Souza, R., Kauffmann, G., et al. 2013, MNRAS, 434, 3348 [NASA ADS] [CrossRef] [Google Scholar]
- Cooper, A. P., Gao, L., Guo, Q., et al. 2015, MNRAS, 451, 2703 [NASA ADS] [CrossRef] [Google Scholar]
- de la Rosa, I. G., de Carvalho, R. R., Vazdekis, A., & Barbuy, B. 2007, AJ, 133, 330 [NASA ADS] [CrossRef] [Google Scholar]
- De Lucia, G., & Blaizot, J. 2007, MNRAS, 375, 2 [NASA ADS] [CrossRef] [Google Scholar]
- Dekel, A., Birnboim, Y., Engel, G., et al. 2009, Nature, 457, 451 [NASA ADS] [CrossRef] [PubMed] [Google Scholar]
- Dressler, A. 1979, ApJ, 231, 659 [NASA ADS] [CrossRef] [Google Scholar]
- Gallagher, III, J. S., & Ostriker, J. P. 1972, AJ, 77, 288 [Google Scholar]
- Gallazzi, A., Charlot, S., Brinchmann, J., White, S. D. M., & Tremonti, C. A. 2005, MNRAS, 362, 41 [NASA ADS] [CrossRef] [Google Scholar]
- Gerhard, O., Arnaboldi, M., Freeman, K. C., et al. 2007, A&A, 468, 815 [NASA ADS] [CrossRef] [EDP Sciences] [Google Scholar]
- Gil de Paz, A., Boissier, S., Madore, B. F., et al. 2007, ApJS, 173, 185 [NASA ADS] [CrossRef] [Google Scholar]
- Gonzalez, A. H., Zabludoff, A. I., & Zaritsky, D. 2005, ApJ, 618, 195 [Google Scholar]
- Greene, J. E., Murphy, J. D., Comerford, J. M., Gebhardt, K., & Adams, J. J. 2012, ApJ, 750, 32 [NASA ADS] [CrossRef] [Google Scholar]
- Greene, J. E., Murphy, J. D., Graves, G. J., et al. 2013, ApJ, 776, 64 [NASA ADS] [CrossRef] [Google Scholar]
- Greene, J. E., Janish, R., Ma, C.-P., et al. 2015, ApJ, 807, 11 [NASA ADS] [CrossRef] [Google Scholar]
- Hayakawa, A., Furusho, T., Yamasaki, N. Y., Ishida, M., & Ohashi, T. 2004, PASJ, 56, 743 [NASA ADS] [Google Scholar]
- Hayakawa, A., Hoshino, A., Ishida, M., et al. 2006, PASJ, 58, 695 [NASA ADS] [Google Scholar]
- Hirschmann, M., Naab, T., Ostriker, J. P., et al. 2015, MNRAS, 449, 528 [NASA ADS] [CrossRef] [Google Scholar]
- Kereš, D., Katz, N., Weinberg, D. H., & Davé, R. 2005, MNRAS, 363, 2 [NASA ADS] [CrossRef] [Google Scholar]
- Kobayashi, C. 2004, MNRAS, 347, 740 [NASA ADS] [CrossRef] [Google Scholar]
- Komatsu, E., Dunkley, J., Nolta, M. R., et al. 2009, ApJS, 180, 330 [NASA ADS] [CrossRef] [Google Scholar]
- Kuntschner, H., Emsellem, E., Bacon, R., et al. 2006, MNRAS, 369, 497 [NASA ADS] [CrossRef] [Google Scholar]
- Kuntschner, H., Emsellem, E., Bacon, R., et al. 2010, MNRAS, 408, 97 [NASA ADS] [CrossRef] [Google Scholar]
- La Barbera, F., Ferreras, I., de Carvalho, R. R., et al. 2012, MNRAS, 426, 2300 [NASA ADS] [CrossRef] [Google Scholar]
- Larson, R. B. 1974, MNRAS, 166, 585 [NASA ADS] [CrossRef] [Google Scholar]
- Longobardi, A., Arnaboldi, M., Gerhard, O., & Hanuschik, R. 2015a, A&A, 579, A135 [NASA ADS] [CrossRef] [EDP Sciences] [Google Scholar]
- Longobardi, A., Arnaboldi, M., Gerhard, O., & Mihos, J. C. 2015b, A&A, 579, L3 [NASA ADS] [CrossRef] [EDP Sciences] [Google Scholar]
- Loubser, S. I., Sánchez-Blázquez, P., Sansom, A. E., & Soechting, I. K. 2009, MNRAS, 398, 133 [NASA ADS] [CrossRef] [Google Scholar]
- Loubser, S. I., & Sánchez-Blázquez, P. 2012, MNRAS, 425, 841 [NASA ADS] [CrossRef] [Google Scholar]
- MacKay, D. 2003, Information theory, inference, and learning algorithms (Cambridge, UK, New York: Cambridge University Press) [Google Scholar]
- Markov, A. A. 1913, Proceedings of the Academy of Sciences of St. Petersburg, 7, 153 [NASA ADS] [Google Scholar]
- Mihos, J. C., Harding, P., Rudick, C. S., & Feldmeier, J. J. 2013, ApJ, 764, L20 [NASA ADS] [CrossRef] [Google Scholar]
- Misgeld, I., Mieske, S., & Hilker, M. 2008, A&A, 486, 697 [NASA ADS] [CrossRef] [EDP Sciences] [Google Scholar]
- Misgeld, I., Mieske, S., Hilker, M., et al. 2011, A&A, 531, A4 [NASA ADS] [CrossRef] [EDP Sciences] [Google Scholar]
- Montes, M., Trujillo, I., Prieto, M. A., & Acosta-Pulido, J. A. 2014, MNRAS, 439, 990 [NASA ADS] [CrossRef] [Google Scholar]
- Murante, G., Arnaboldi, M., Gerhard, O., et al. 2004, ApJ, 607, L83 [NASA ADS] [CrossRef] [Google Scholar]
- Murante, G., Giovalli, M., Gerhard, O., et al. 2007, MNRAS, 377, 2 [Google Scholar]
- Naab, T., Johansson, P. H., & Ostriker, J. P. 2009, ApJ, 699, L178 [NASA ADS] [CrossRef] [Google Scholar]
- Oliva-Altamirano, P., Brough, S., Jimmy, Kim-Vy, T., et al. 2015, MNRAS, 449, 3347 [NASA ADS] [CrossRef] [Google Scholar]
- Oser, L., Ostriker, J. P., Naab, T., Johansson, P. H., & Burkert, A. 2010, ApJ, 725, 2312 [NASA ADS] [CrossRef] [Google Scholar]
- Pastorello, N., Forbes, D. A., Foster, C., et al. 2014, MNRAS, 442, 1003 [NASA ADS] [CrossRef] [Google Scholar]
- Patil, A., Huard, D., & Fonnesbeck, C. J. 2010, J. Stat. Software, 35, 1 [Google Scholar]
- Piffaretti, R., Arnaud, M., Pratt, G. W., Pointecouteau, E., & Melin, J.-B. 2011, A&A, 534, A109 [NASA ADS] [CrossRef] [EDP Sciences] [Google Scholar]
- Pipino, A., Matteucci, F., & Chiappini, C. 2006, ApJ, 638, 739 [NASA ADS] [CrossRef] [Google Scholar]
- Pipino, A., D’Ercole, A., & Matteucci, F. 2008, A&A, 484, 679 [NASA ADS] [CrossRef] [EDP Sciences] [Google Scholar]
- Pipino, A., D’Ercole, A., Chiappini, C., & Matteucci, F. 2010, MNRAS, 407, 1347 [NASA ADS] [CrossRef] [Google Scholar]
- Richtler, T., Salinas, R., Misgeld, I., et al. 2011, A&A, 531, A119 [NASA ADS] [CrossRef] [EDP Sciences] [Google Scholar]
- Robertson, B., Bullock, J. S., Cox, T. J., et al. 2006, ApJ, 645, 986 [NASA ADS] [CrossRef] [Google Scholar]
- Sánchez-Blázquez, P., Peletier, R. F., Jiménez-Vicente, J., et al. 2006, MNRAS, 371, 703 [NASA ADS] [CrossRef] [Google Scholar]
- Schiavon, R. P. 2007, ApJS, 171, 146 [NASA ADS] [CrossRef] [Google Scholar]
- Serra, P., & Trager, S. C. 2007, MNRAS, 374, 769 [NASA ADS] [CrossRef] [Google Scholar]
- Spolaor, M., Forbes, D. A., Proctor, R. N., Hau, G. K. T., & Brough, S. 2008, MNRAS, 385, 675 [NASA ADS] [CrossRef] [Google Scholar]
- Spolaor, M., Kobayashi, C., Forbes, D. A., Couch, W. J., & Hau, G. K. T. 2010, MNRAS, 408, 272 [NASA ADS] [CrossRef] [Google Scholar]
- Struble, M. F., & Rood, H. J. 1999, ApJS, 125, 35 [NASA ADS] [CrossRef] [Google Scholar]
- Thomas, D., Maraston, C., & Bender, R. 2003, MNRAS, 339, 897 [NASA ADS] [CrossRef] [Google Scholar]
- Thomas, D., Maraston, C., Bender, R., & Mendes de Oliveira, C. 2005, ApJ, 621, 673 [NASA ADS] [CrossRef] [Google Scholar]
- Thomas, D., Maraston, C., & Johansson, J. 2011, MNRAS, 412, 2183 [NASA ADS] [CrossRef] [Google Scholar]
- Trager, S. C., Worthey, G., Faber, S. M., Burstein, D., & González, J. J. 1998, ApJS, 116, 1 [NASA ADS] [CrossRef] [MathSciNet] [Google Scholar]
- Trager, S. C., Faber, S. M., Worthey, G., & González, J. J. 2000, AJ, 120, 165 [NASA ADS] [CrossRef] [Google Scholar]
- Tremonti, C. A., Heckman, T. M., Kauffmann, G., et al. 2004, ApJ, 613, 898 [NASA ADS] [CrossRef] [Google Scholar]
- van der Wel, A., Franx, M., van Dokkum, P. G., et al. 2014, ApJ, 788, 28 [NASA ADS] [CrossRef] [Google Scholar]
- van Dokkum, P. G., Franx, M., Kriek, M., et al. 2008, ApJ, 677, L5 [NASA ADS] [CrossRef] [Google Scholar]
- Ventimiglia, G., Gerhard, O., Arnaboldi, M., & Coccato, L. 2010, A&A, 520, L9 [NASA ADS] [CrossRef] [EDP Sciences] [Google Scholar]
- Ventimiglia, G., Arnaboldi, M., & Gerhard, O. 2011, A&A, 528, A24 [NASA ADS] [CrossRef] [EDP Sciences] [Google Scholar]
- Villumsen, J. V. 1983, MNRAS, 204, 219 [NASA ADS] [CrossRef] [Google Scholar]
- Wall, J. V., & Jenkins, C. R. 2012, Practical Statistics for Astronomers (Cambridge University Press) [Google Scholar]
- White, S. D. M. 1980, MNRAS, 191, 1 [Google Scholar]
- Worthey, G. 1994, ApJS, 95, 107 [NASA ADS] [CrossRef] [Google Scholar]
- Worthey, G., & Ottaviani, D. L. 1997, ApJS, 111, 377 [NASA ADS] [CrossRef] [Google Scholar]
Appendix A: Simulations of the variance of Lick indices and stellar populations generated by a systematic error of the sky subtraction at the ± 1% level
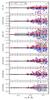 |
Fig. A.1 Difference of the Lick indices values generated by a systematic error in the sky subtraction of ± 1% as a function of the distance to the centre of NGC 3311. The blue (red) circles represent the measurements performed by the addition (subtraction) of 1% of the sky spectra. The grey shaded areas represent the rolling standard deviation in the measurements. |
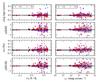 |
Fig. A.2 Difference of the stellar population parameters generated by a systematic error in the sky subtraction of ±1% as a function of the distance to the centre of NGC 3311 (left) and as a function of the V-band surface brightness (right). The blue (red) circles represent the measurements performed by the addition (subtraction) of 1% of the sky spectra. The grey shaded areas represent the rolling standard deviation in the measurements. |
All Tables
Linear regression coefficients for the fitting of the stellar population parameters.
Properties of the Gaussian mixture models with lowest Bayesian information criteria for the off-centred envelope and the symmetric halo.
All Figures
|
Fig. 1 Distribution of the signal-to-noise (S/N) of the scientific spectra in our sample. The position of the slits is shown as red bars, and the colours of the polygon, calculated by Voronoi Tessellation, indicate the S/N according to the scale in the colour bar in the bottom left corner. Slits with white background were excluded from the analysis owing to their low quality (S/N< 10). Black lines show the V-band contours in the range from 20 to 23.5 mag arcsec-2 in intervals of 0.5 mag arcsec-2, from Arnaboldi et al. (2012). The geometry of the polygons is shown hereafter in all the other maps in this study. |
| In the text | |
|
Fig. 2 Examples of the LOSVD fitting process with pPXF in our data set. The sky subtracted spectra (black) are superposed by the best fit templates (red) obtained by a combination of SSP spectra from the MILES library (Sánchez-Blázquez et al. 2006), emission lines, and an additive polynomial of order 12, convolved with the line-of-sight velocity distribution with four moments. The best fit emission lines (blue) are subtracted from the spectra to avoid contamination on top of the absorption features. Residuals from the fits are shown in the bottom (green dots). The Lick indices are measured at the location of the vertical shades by the measurement of the equivalent width in central bands (dark grey) compared to the level of the two pseudo continuum side bands (light grey). |
| In the text | |
|
Fig. 3 Spatial distribution of the equivalent width of six Lick indices: Hβ, Fe5015, Mg b, Fe5270, Fe5335, and Fe5406. Black lines indicate the contours of the V-band image from Arnaboldi et al. (2012) between 20 to 23.5 mag arcsec-2 in steps of 0.5 mag arcsec-2.These maps illustrate the presence of a homogeneous inner region and a large scatter at large radii, for all indices. |
| In the text | |
|
Fig. 4 Lick indices as a function of the distance from the centre of NGC 3311. The EWs measured for our spectra are shown by full circles, with different colours according to their S/N, as indicated in the top panel. Long-slit data from the literature is also displayed, including Coccato et al. (2011), as orange triangles, Loubser & Sánchez-Blázquez (2012) as red squares and Loubser et al. (2009) as red arrows. The two black dashed lines indicate the gradients obtained by linear regression in the two regions corresponding to the inner galaxy and the external halo. The grey shaded areas around the dashed lines represent the variance in the equivalent width generated by a systematic error in the sky subtraction by ±1%. The different gradients indicate different mechanisms for the assembly of the stellar haloes. |
| In the text | |
|
Fig. 5 Examples of the posterior distributions for two spectra using the MCMC method. The panels in the main diagonal show histograms of the marginalized distributions, which are used to determine the representative values and their uncertainties. The thick red lines show the best fit to the posterior samples, either a Gaussian or a generalized extreme value function. Projections of the posterior distributions in the lower left panels show the correlations among parameters. The histograms in the upper right corner of each panel indicate the maximum probabilities and the 1σ deviations of the stellar population parameters in each case. |
| In the text | |
|
Fig. 6 Maps of the modelled luminosity-weighted stellar population properties: ages (top left), total metallicity (top right), alpha-element abundance (bottom left), and iron abundance (bottom right). Black lines display the V-band surface brightness contours from Arnaboldi et al. (2012) in the range from 20 to 23.5 in steps of 0.5 mag arcsec-2. Colours indicate the SSP equivalent parameters according to the colour bars in the bottom left section of each panel. The inner galaxy (R< ~ 10 kpc) is characterized by homogenous old age, high metallicity, and super solar [α/Fe]; the outer halo shows a more complex behaviour; see extended discussion in Sect. 6. |
| In the text | |
|
Fig. 7 Gradients of the stellar population parameters. Left: ages, [Z/H], [α/Fe], and [Fe/H] as function of the log-distance to the centre of NGC 3311. Circles indicate data points from this work, coloured according to their S/N as dark blue (S/N> 30), light blue (15 ≤ S/N ≤ 30) and white (S/N< 15). Data from Loubser et al. (2009) and Coccato et al. (2011) are shown by red arrow and orange triangles, respectively. New calculated values for the stellar population parameters based on data from Loubser & Sánchez-Blázquez (2012) are indicated by red squares. Dot-dashed and dashed lines indicate the regression for the inner and external halo, respectively, with the gradients displayed in the bottom left of each panel. The grey shades represent the systematic error of under/over subtraction of the sky by 1%. Centre: same as for the left panels, but with gradients measured as a function of the V-band surface brightness. Right: histograms of the distribution of the stellar population parameters, combining our data with those of Loubser & Sánchez-Blázquez (2012), with the inner galaxy and external halo shown in blue and grey bins, respectively. The gradients in the inner galaxy are consistent with the predictions from a quasi-monolithic collapse model, while the shallow azimuthally-averaged gradients and the large scatter in the outer halo are consistent with the results of accreted stars from a variety of different progenitors. |
| In the text | |
|
Fig. 8 Evidence of a large-scale component in the external halo of NGC 3311. A), B) V-band image and residual from the Sérsic n = 10 model from Arnaboldi et al. (2012) illustrate the presence of an off-centred envelope. C) X-rays image from Hayakawa et al. (2006) indicates an excess emission at the same position of the off-centred envelope. Red circles indicate the position of dwarf galaxies from the catalogue of Misgeld et al. (2008). |
| In the text | |
|
Fig. 9 Distribution of stellar population parameters of the off-centred envelope (red) and the symmetric halo (grey). The histograms are normalized and the number of spectra (N) used in each case is shown in the legend of each panel. Dashed lines indicate the components of the GMM analysis, while the arrows indicate the position of the peak of each component. The off-centred envelope is responsible for a significant shift of the metallicity where it is located, while ages and alpha-element abundance distributions are similar to those inferred for the symmetric halo. |
| In the text | |
|
Fig. A.1 Difference of the Lick indices values generated by a systematic error in the sky subtraction of ± 1% as a function of the distance to the centre of NGC 3311. The blue (red) circles represent the measurements performed by the addition (subtraction) of 1% of the sky spectra. The grey shaded areas represent the rolling standard deviation in the measurements. |
| In the text | |
|
Fig. A.2 Difference of the stellar population parameters generated by a systematic error in the sky subtraction of ±1% as a function of the distance to the centre of NGC 3311 (left) and as a function of the V-band surface brightness (right). The blue (red) circles represent the measurements performed by the addition (subtraction) of 1% of the sky spectra. The grey shaded areas represent the rolling standard deviation in the measurements. |
| In the text | |
Current usage metrics show cumulative count of Article Views (full-text article views including HTML views, PDF and ePub downloads, according to the available data) and Abstracts Views on Vision4Press platform.
Data correspond to usage on the plateform after 2015. The current usage metrics is available 48-96 hours after online publication and is updated daily on week days.
Initial download of the metrics may take a while.