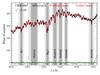
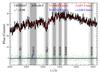
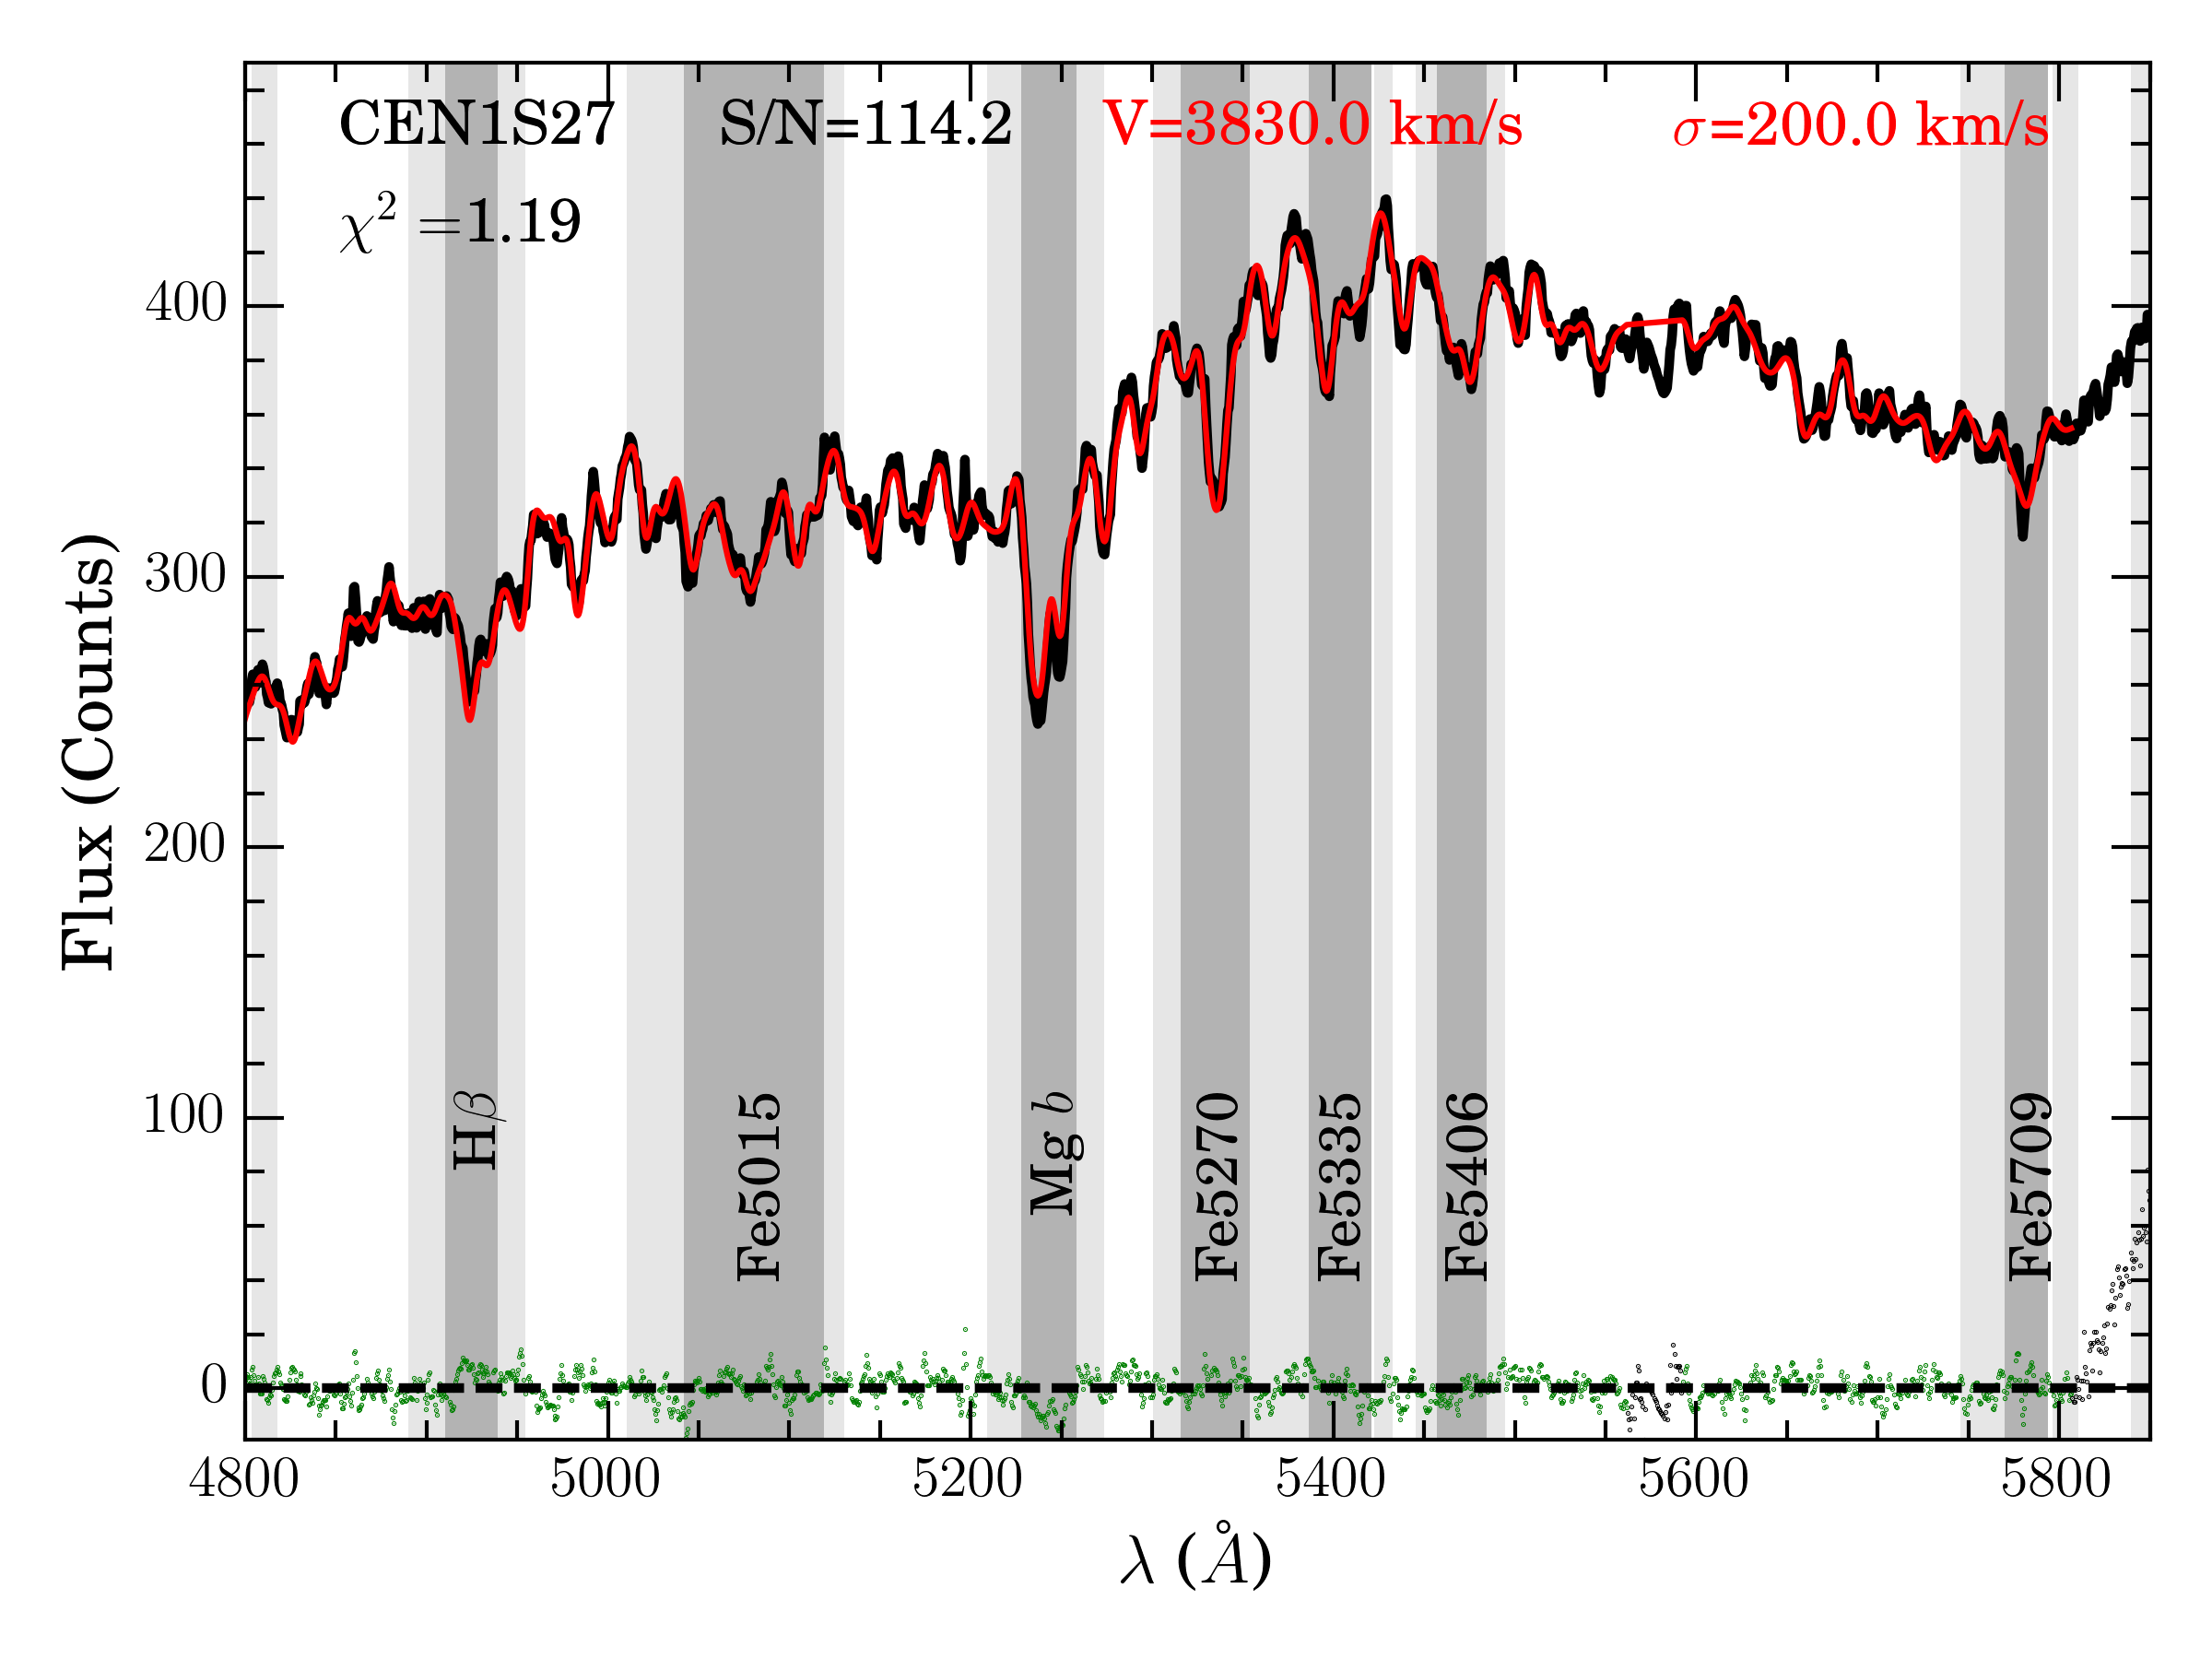
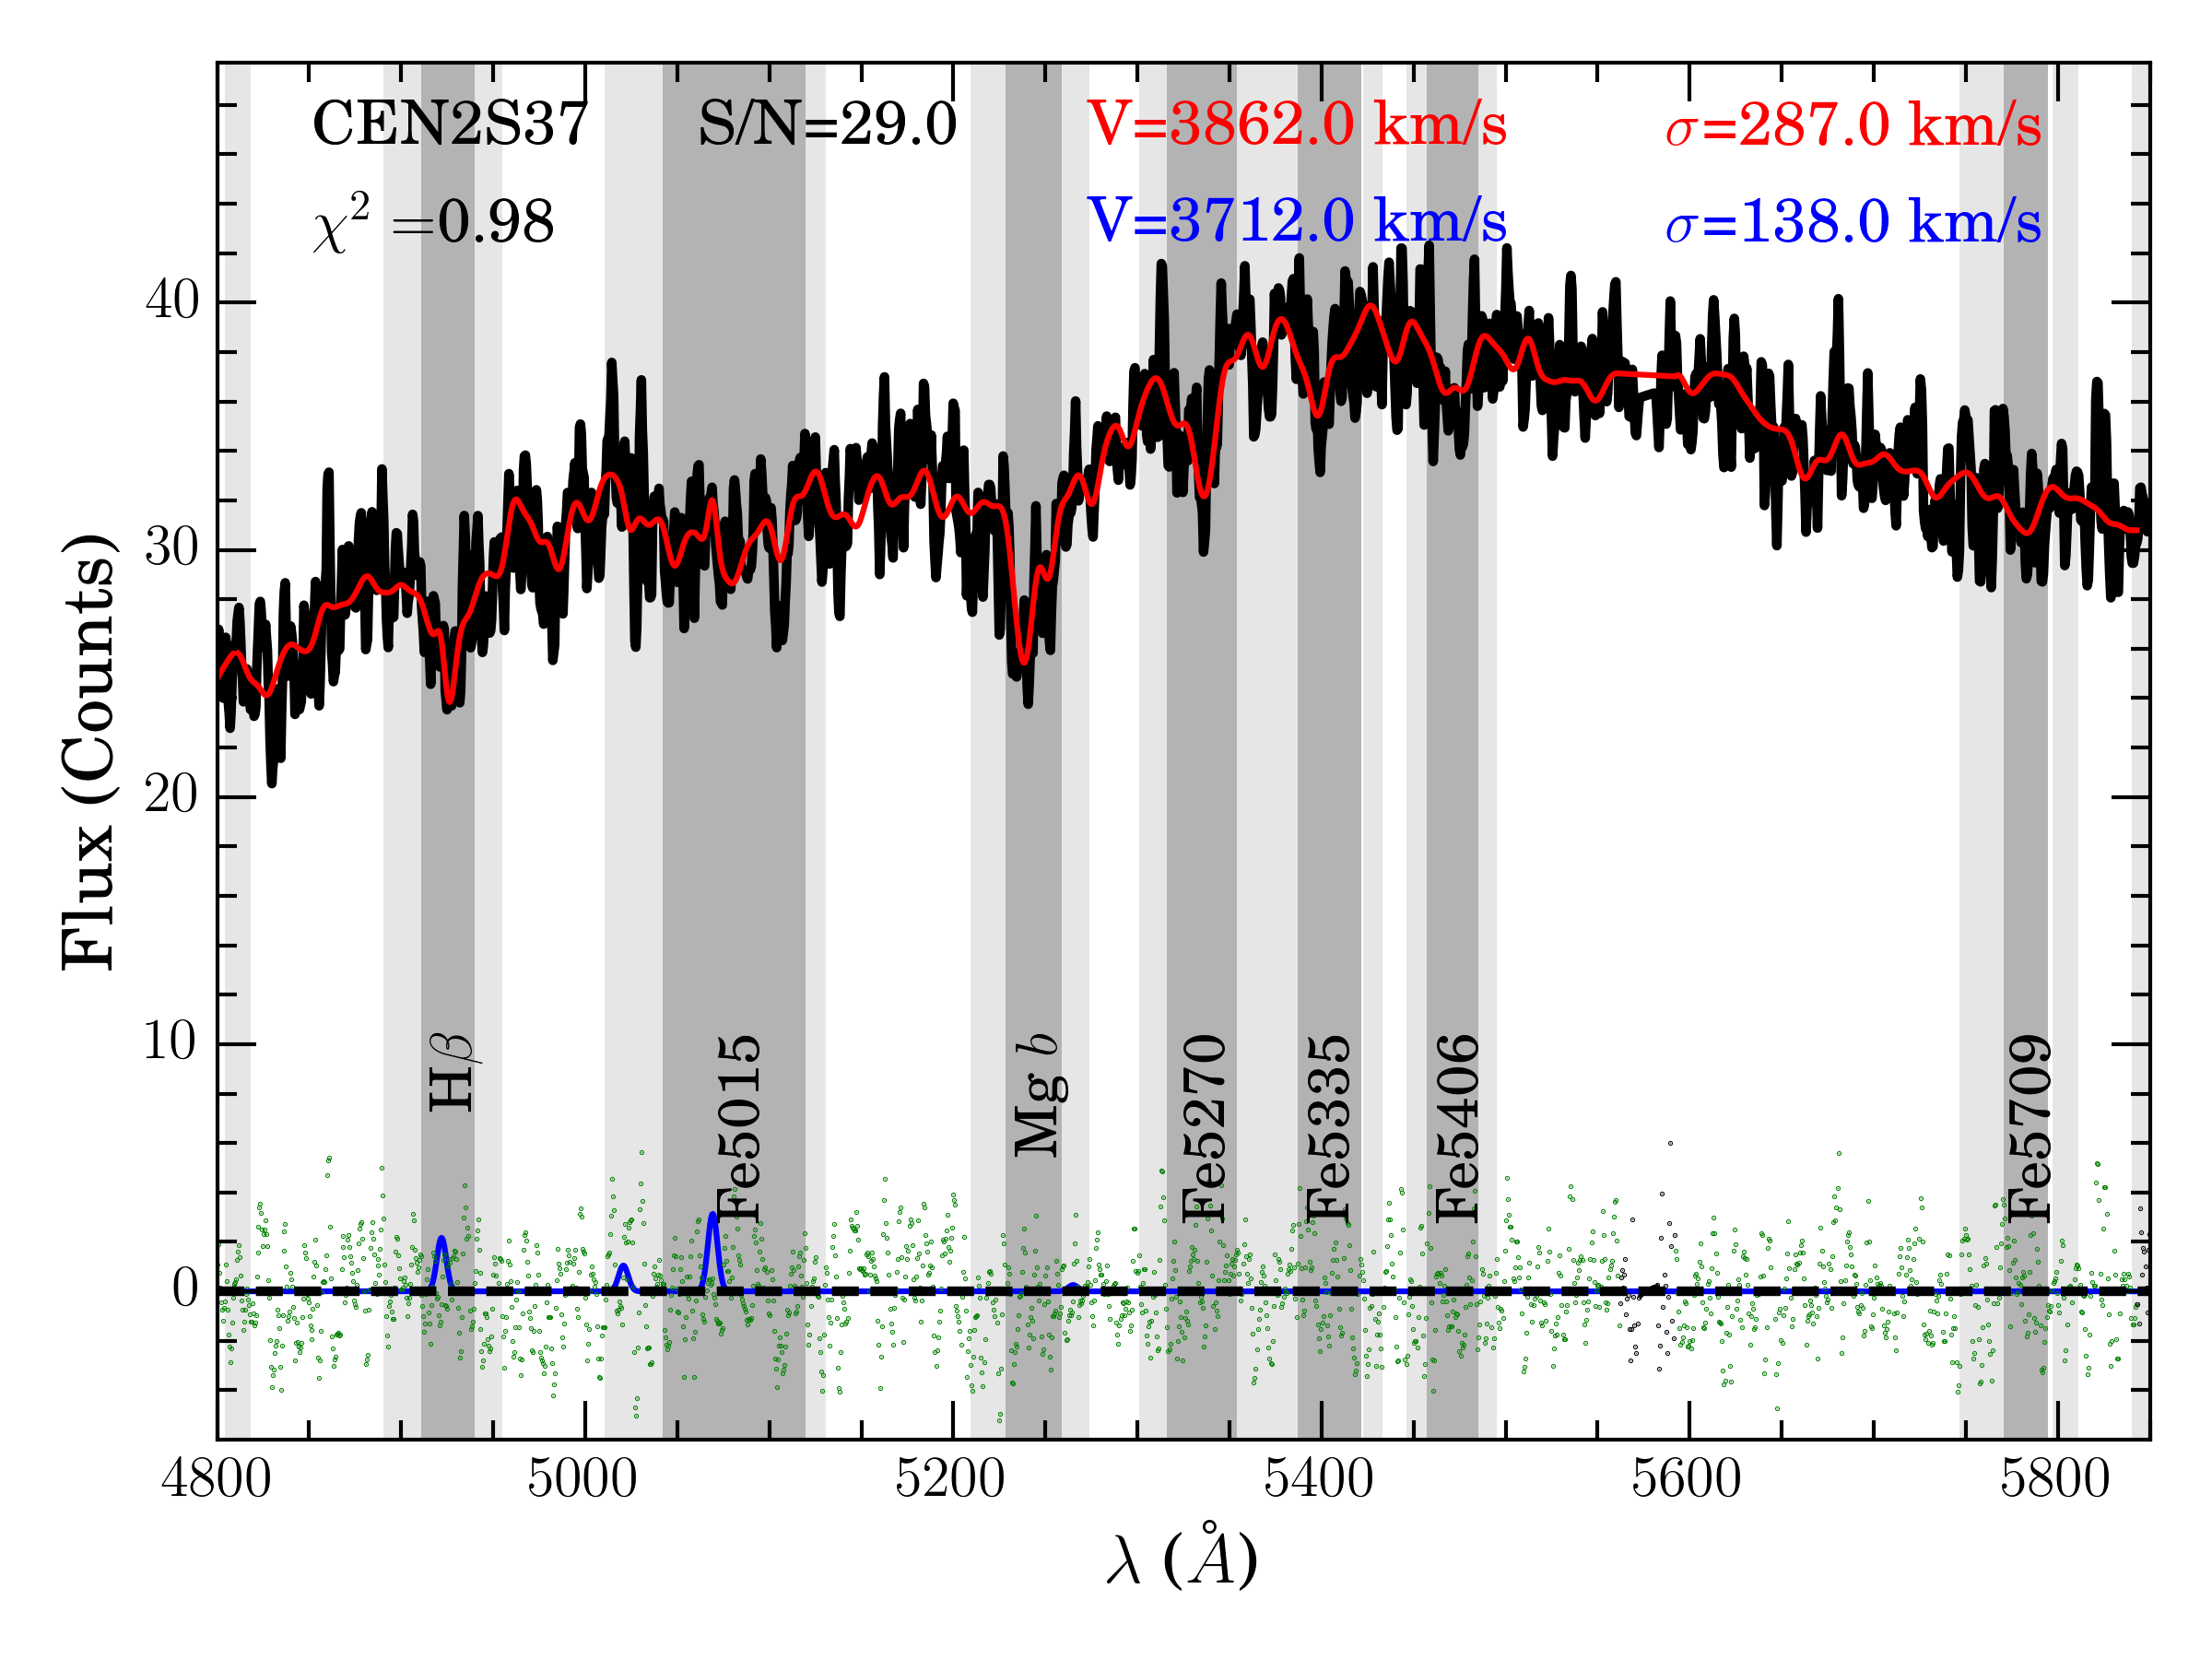
Fig. 2

Examples of the LOSVD fitting process with pPXF in our data set. The sky subtracted spectra (black) are superposed by the best fit templates (red) obtained by a combination of SSP spectra from the MILES library (Sánchez-Blázquez et al. 2006), emission lines, and an additive polynomial of order 12, convolved with the line-of-sight velocity distribution with four moments. The best fit emission lines (blue) are subtracted from the spectra to avoid contamination on top of the absorption features. Residuals from the fits are shown in the bottom (green dots). The Lick indices are measured at the location of the vertical shades by the measurement of the equivalent width in central bands (dark grey) compared to the level of the two pseudo continuum side bands (light grey).
Current usage metrics show cumulative count of Article Views (full-text article views including HTML views, PDF and ePub downloads, according to the available data) and Abstracts Views on Vision4Press platform.
Data correspond to usage on the plateform after 2015. The current usage metrics is available 48-96 hours after online publication and is updated daily on week days.
Initial download of the metrics may take a while.